Research Collection
Report
Past, current, and future changes in floods in Switzerland
Author(s):
Ruiz-Villanueva, Virginia; Molnar, Peter Publication Date:
2020-12
Permanent Link:
https://doi.org/10.3929/ethz-b-000458556
Rights / License:
Creative Commons Attribution-NonCommercial 4.0 International
This page was generated automatically upon download from the ETH Zurich Research Collection. For more information please consult the Terms of use.
ETH Library
IM AUFTRAG DES BUNDESAMTES FÜR UMWELT BAFU – DEZEMBER 2020
EINE STUDIE IM RAHMEN DES NCCS THEMENSCHWERPUNKTES “HYDROLOGISCHE GRUNDLAGEN ZUM KLIMAWANDEL” DES NATIONAL CENTRE FOR CLIMATE SERV ICES
Past, current, and future changes in floods in
Switzerland
V. RUIZ-VILLANUEVA, P. MOLNAR (EDS.)
Impressum
Commissioned by: Federal Office for the Environment (FOEN), Hydrology Division, CH-3003 Bern. The FOEN is an agency of the Federal Department of the Environment, Transport, Energy and Communications (DETEC)
Contractor: ETH Zürich (Institute of Environmental Engineering), University of Geneva Editing Authors: Virginia Ruiz-Villanueva, Peter Molnar (Editors)
Section Authors: Andres N., Aemisegger F., Anselmetti F., Brunner M.I., Chang Y.Y., Freudiger D., Martius O., Molnar P., Moraga S., Mudelsee M., Mülchi R., Peleg N., Peña J.C., Pfister C., Rössler O., Röthlisberger V., Ruiz-Villanueva V., Schmocker- Fackel P., Schulte L., Seibert J., Stoffel M., Stuber M., Viviroli D., Wetter O., Zappa M., Zischg A.
FOEN support: Fabia Huesler, Petra Schmocker-Fackel
Note: This study was prepared under contract to the Federal Office for the Environment (FOEN). The contractors bear sole responsibility for the content.
Citation: V. Ruiz-Villanueva and P. Molnar (eds), 2020. Past, current, and future changes in floods in Switzerland. Hydro-CH2018 project. Commissioned by the Federal Office for the Environment (FOEN), Bern, Switzerland, 89 pp
DOI: 10.3929/ethz-b-000458556 (https://doi.org/10.3929/ethz-b-000458556)
Page 2/89
List of authors
Andres N., WSL, norina.andres@wsl.ch
Aemisegger F., IAC, ETH Zurich, franziska.aemisegger@env.ethz.ch
Anselmetti F.S., University of Bern and OCCR, flavio.anselmetti@geo.unibe.ch Brunner M.I., NCAR, manuelab@ucar.edu
Chang Y.Y., IFU, ETH Zurich, ychang@student.ethz.ch
Freudiger D., University of Zurich, daphne.freudiger@geo.uzh.ch Martius O., University of Bern, olivia.romppainen@giub.unibe.ch Molnar P., IFU, ETH Zurich, peter.molnar@ifu.baug.ethz.ch Moraga S., IFU, ETH Zurich, moraga@ifu.baug.ethz.ch
Mudelsee M., Climate Risk Analysis, mudelsee@climate-risk-analysis.com Mülchi R., University of Bern, regula.muelchi@giub.unibe.ch
Peleg N., IFU, ETH Zurich, nadav.peleg@sccer-soe.ethz.ch Peña J.C., Servei Meteorològic de Catalunya, jpena@meteo.cat Pfister C., OCCR, University of Bern, christian.pfister@hist.unibe.ch
Rössler O., formerly at University of Bern, currently at BFG, Koblenz, roessler@bafg.de Röthlisberger V., University of Bern, veronika.roethlisberger@giub.unibe.ch
Ruiz-Villanueva V., University of Lausanne, virginia.ruiz-villanueva@unil.ch Schmocker-Fackel P., BAFU, petra.schmocker-fackel@bafu.admin.ch Schulte L., University of Barcelona, schulte@ub.edu
Seibert J., University of Zurich, jan.seibert@geo.uzh.ch Stoffel M., University of Geneva, markus.stoffel@unige.ch Stuber M., University of Bern, martin.stuber@hist.unibe.ch Viviroli D., University of Zurich, daniel.viviroli@geo.uzh.ch
Wetter O., OCCR, University of Bern, oliver.wetter@hist.unibe.ch Zappa M., WSL, massimiliano.zappa@wsl.ch
Zischg A., University of Bern, andreas.zischg@giub.unibe.ch
Page 3/89
Table of Contents
List of authors ... 2
Table of Contents ... 3
Zusammenfassung ... 5
Resumé ... 7
1. Introduction ... 9
2. Paleofloods: changes in prehistoric flood occurrence ... 11
2.1. Introduction ... 11
2.2. Lakes as recorders of past flood events ... 12
2.3. Geoarchives and historical data from floodplains ... 13
2.3.1. Multi-archive analysis of floodplains ... 13
2.3.2. Flood reconstruction from floodplain deposits ... 15
2.4. Paleoflood reconstructions based on tree rings ... 16
2.5. Paleofloods and climate variability ... 18
2.5.1. Floods in the Northern Alps during the last 2500 years ... 18
2.5.2. Holocene flood frequency across the Central Alps ... 18
2.5.3 2600-yr sedimentary flood record from the Hasli-Area floodplain ... 19
2.5.4 Temporal-spatial integration of multi-archive datasets in the Bernese Alps . 20 3. Historical floods: changes in floods since the 13th Century ... 22
3.1. Introduction ... 22
3.2. High Rhine River flood occurrences since the 13th Century ... 23
3.3. Low and high flood frequency periods since the 16th century in Swiss river basins... 24
4. Recent floods: changes in floods since the 19th Century ... 29
4.1. Introduction ... 29
4.2. Flood change detection and attribution ... 31
4.3. The relevance of non-stationarity ... 32
4.4. Trends in floods in Switzerland since the 19th century ... 33
5. Understanding flood triggering mechanisms and flood risk changes ... 38
5.1. Introduction ... 38
5.2. Climatic drivers of floods ... 38
5.2.1 Flood generating hydro-meteorological processes ... 38
5.2.2 Synoptic-scale flow and moisture sources of heavy precipitation events associated with floods in Switzerland ... 39
5.2.3 The interplay of rain and snow (melt) ... 42
5.2.4 The interplay of rain and soil moisture ... 43
5.3. Non-climatic drivers of floods ... 43
Page 4/89
5.3.1. Non-climatic flood drivers at the catchment scale ... 44
5.3.2. Non-climatic flood drivers at the river corridor scale ... 44
5.4. Flood change attribution ... 45
5.4.1. Recent changes in climatic drivers of floods ... 45
5.4.2. Recent changes in non-climatic drivers of floods ... 47
5.5. Changes in flood exposure and risk ... 49
6. Future changes in floods ... 51
6.1. Introduction ... 51
6.2. Methodological details ... 52
6.3. Projected flood changes ... 53
6.4. High resolution (hourly) changes ... 57
7. Research gaps and open questions ... 59
7.1. Paleofloods: changes in prehistoric flood occurrence ... 59
7.2. Historical floods: changes in floods since the 13th Century ... 59
7.3. Recent floods: changes in floods since the 19th Century ... 60
7.4. Understanding flood triggering mechanisms and flood risk changes ... 60
7.5. Future changes in floods derived by modelling ... 61
8. Concluding remarks and recommendations ... 62
9. References ... 63
10. Appendix ... 82
Page 5/89
Zusammenfassung
Das Kapitel „Vergangene, aktuelle und zukünftige Veränderungen der Überschwemmungen in der Schweiz“ ist Teil der Hydro-CH2018-Studie zu den hydrologischen Auswirkungen des Klimawandels in der Schweiz. In diesem Kapitel fassen wir die wichtigsten Ergebnisse von Studien zu Hochwasseränderungen für Schweizer Flüsse zusammen und stellen sie in den Kontext von Hochwasseränderungen in Europa und weltweit. Wir beschreiben die neuesten Methoden der Forschung über Hochwasseränderungen und präsentieren diese systematisch und diskutieren die potenziellen Ursachen und Auslöser von Überschwemmungen und ihre Folgen für das Hochwasserrisiko. Das Kapitel wurde von der Schweizer Wissenschaftsgemeinschaft verfasst; in jedem Unterabschnitt sind die Autoren aufgeführt.
Überschwemmungen sind das Ergebnis der Umwandlung von Niederschlag in Abfluss im Einzugsgebiet. Ursächlich sind intensive Regenfälle, außergewöhnlich hohe Schneeschmelze, gesättigte Bodenfeuchtebedingungen oder eine Kombination davon.
Da sich die Rahmenbedingungen für Überschwemmungen in der Vergangenheit geändert haben und sich auch in Zukunft ändern werden, können wir auch Änderungen der Häufigkeit und des Ausmasses von Überschwemmungen über die Zeit erwarten. Für die Beschreibung der Art des Hochwassertyp und -stärkenwechsels in einer Region ist es daher von vorrangiger Bedeutung, zunächst Änderungen des Hochwasserregimes in der fernen und jüngeren Vergangenheit zu quantifizieren. Damit können mögliche Ursachen identifiziert und dann Prognosen über mögliche Auswirkungen des Klimawandels in die Zukunft erstellt werden. Die Kapitel sind gemäss dieser Herangehensweise strukturiert.
In Abschnitt 2 untersuchen wir die ferne Vergangenheit und überprüfen Methoden zur Rekonstruktion der holozänen Hochwasserhäufigkeit und -intensitäten aus Paläoflutaufzeichnungen, die auf Sedimentablagerungen in Seen und Auen, aus Sedimentgeochemie und Korngrößen basieren. Dendrochronologische Methoden werden für kürzere Zeiträume vorgestellt. In Abschnitt 3 untersuchen wir, wie dokumentarische historische Hochwasserinformationen verwendet werden können, um die Hochwasserhäufigkeit und die Hochwasserintensitäten in der Zeit vor der Instrumentierung zu bewerten und zu rekonstruieren. In diese Zeit fallen auch starke menschliche Veränderungen von Landschaft und Flüssen. In Abschnitt 4 wenden wir uns statistischen Methoden zur formalen Erkennung von Änderungen (Trends) des Hochwasserzeitpunkts und der Intensitäten aus jüngsten Instrumentenaufzeichnungen zu. Wir zeigen, dass diese Studien in der Schweiz unterschiedliche Trends nördlich und südlich des Alpenkamms und klare saisonale Signale zeigen. In Abschnitt 5 betrachten wir dann die klimatischen und nicht-klimatischen Ursachen von Überschwemmungen und deren Veränderungen. Die betrachteten hydrometeorologischen Ursachen von Überschwemmungen sind intensive Regenfälle, starke Schneeschmelze oder Regen- auf-Schnee-Situationen, sowie Bedingungen mit hoher Bodenfeuchtigkeit. Die häufigsten nicht-klimatischen Ursachen für Überschwemmungen sind Veränderungen der Landbedeckung, Urbanisierung und des Flussbaus. Änderungen dieser Ursachen in der Schweiz werden aus Daten- und Modellstudien zusammengefasst.
Die zukünftigen Auswirkungen des Klimawandels auf Überschwemmungen werden in Abschnitt 6 vorgestellt, in dem wir die jüngsten Ergebnisse der neuen Schweizer Klimawandelszenarien CH2018 zusammenfassen. Drei hydrologische Niederschlagsabflussmodelle werden verwendet, um die Änderungen der jährlichen Hochwassermaxima und ihre Verteilung in bis zu 300 Einzugsgebieten zu quantifizieren.
Page 6/89
Die Ergebnisse zeigen eine Tendenz zu einem zukünftigen Anstieg der Hochwasserintensitäten in der Schweiz von durchschnittlich 0-10%. Die Veränderungen liegen jedoch im Bereich der aktuellen natürlichen Variabilität . Dies macht Prognosen über zukünftige Änderungen der Hochwasserspitzen sehr unsicher, so dass diese größere Unsicherheiten als Änderungen des allgemeinen Abflussregimes aufweisen. In vergletscherten Einzugsgebieten im Hochgebirge sind die vorhergesagten Hochwasseränderungen vernachlässigbar oder sogar stark negativ, wenn die Beiträge der Eisschmelze zu den zukünftigen Abflüssen verschwinden. Das Erkennen von Unsicherheiten und Variabilitäten ist wichtig für Hochwasservorhersagen; dies wird zusammen mit methodischen Modellierungsaspekten diskutiert. Wir schließen das Kapitel mit einer Zusammenfassung der wichtigsten offenen Fragen zur Forschung von Hochwasseränderungen (Abschnitt 7) und geben Empfehlungen für die Zukunft ab (Abschnitt 8).
Page 7/89
Resumé
Le chapitre «Évolution passée, actuelle et future des crues en Suisse» fait partie du projet Hydro-CH2018 sur les impacts hydrologiques du changement climatique en Suisse. Dans ce chapitre, nous synthétisons les principaux résultats des études sur l'évolution des crues des rivières suisses et les plaçons dans le contexte des changements des crues en Europe et dans le monde. Nous décrivons de manière systématique les méthodes les plus avancées utilisées dans la recherche sur l'évolution des crues et discutons les facteurs potentiels causant des inondations et leurs conséquences sur le risque d'inondation. Ce chapitre a été rédigé par la communauté scientifique suisse et chaque sous-section a une liste des auteurs contributeurs.
Les inondations résultent de la transformation des précipitations en ruissellement de surface à l’échelle d’un bassin versant. Ces ruissellements se produisent, lors de fortes pluies, de fonte des neiges exceptionnellement élevée, lorsque les sols sont humides, ou lors d’un effet combiné. Étant donné que les conditions induisant des inondations ont changé par le passé et continueront de changer à l'avenir, nous pouvons également nous attendre à des changements dans la fréquence et l'ampleur des crues.
Pour décrire la nature de ces changements dans une région, il est donc primordial de quantifier d'abord les changements des régimes d'inondation dans un passé lointain et plus récent, d'identifier leurs possibles causes, puis de faire des projections des impacts possibles du changement climatique dans le futur. Ce chapitre est structuré suivant cette approche.
Dans la section 2, nous analysons le passé lointain et examinons les méthodes utilisées pour reconstruire, à l’échelle de l'Holocène, la fréquence et l'ampleur des paléo- crues à partir de dépôts de sédiments dans les lacs et les plaines inondables, en analysant la géochimie des sédiments et la taille des grains. Les méthodes dendrochronologiques sont présentées pour des échelles de temps plus courtes. Dans la section 3, nous examinons comment la documentation des inondations historiques peut être utilisée pour évaluer et reconstruire la fréquence et l'ampleur des crues pendant la période pré-instrumentale, durant laquelle les modifications humaines du paysage et des rivières étaient dominantes. Dans la section 4, nous nous tournons vers les méthodes statistiques utilisées pour la détection des changements (tendances) du moment d’occurrence et de l'ampleur des crues à partir d’enregistrements instrumentaux récents. Les études de détection des changements de crues en Suisse montrent des tendances différentes au nord et au sud de la ligne de partage alpin et des signaux saisonniers clairs. Dans la section 5, nous examinons ensuite de plus près les facteurs climatiques et non climatiques induisant des inondations et leurs changements. Les facteurs climatiques considérés sont les fortes pluies, la fonte des neiges ou la pluie sur neige, et les conditions d'humidité élevée du sol. Les facteurs non climatiques les plus courants sont les changements d’utilisation du sol, l'urbanisation et l'ingénierie fluviale.
L'évolution de ces facteurs en Suisse est évaluée et résumée à partir d’études de données et de modélisation.
Les impacts futurs du changement climatique sur les inondations sont présentés dans la section 6 où nous résumons les résultats récents tirés des nouveaux scénarios de changement climatique CH2018 en Suisse. Trois modèles hydrologiques précipitation-écoulement sont utilisés pour quantifier les changements des crues annuelles maximales et leur distribution pour près de 300 bassins versants. Les résultats montrent une tendance à une augmentation de l'ampleur des crues en Suisse dans le futur (de l'ordre de 0 à 10%) en moyenne. Cependant, ces changements se situent dans la variabilité naturelle des inondations, même dans le climat actuel. Cela rend les
Page 8/89
projections des changements des pics de crue dans le futur très incertaines et nous leur faisons beaucoup moins de confiance qu'aux projections de changement du régime général de ruissellement. Dans les bassins versants glaciaires de hautes altitudes, les changements de crue prédits sont négligeables, voire fortement négatifs, lorsque les contributions de la fonte des glaces au ruissellement disparaissent à l'avenir. Il est important de reconnaitre l'incertitude et la variabilité dans les prévisions des inondations, point qui est discuté et mis en lien avec les aspects méthodologiques de la modélisation.
Nous terminons le chapitre par un résumé des principales questions qui restent encore ouvertes dans la recherche sur les changements liés aux inondations (section 7) et formulons des recommandations pour l'avenir (section 8).
Page 9/89
1. Introduction
Molnar, P.1, Ruiz-Villanueva, V.2
1 ETH Zürich, peter.molnar@ifu.baug.ethz.ch
2 University of Lausanne, virginia.ruiz-villanueva@unil.ch
Floods are the outcome of the catchment transformation of precipitation into runoff under a combination of certain conditions, i.e. during heavy rainfall, exceptionally high snowmelt, wet soil conditions, or a combination thereof (e.g., BERGHUIJS et al., 2019; BLÖSCHL et al, 2019). Floods are already one of the most impacting natural hazards in Switzerland (HILKER et al., 2009), and flood-related damages are expected to continue increasing in Switzerland and many parts of the world in the future. This is mainly because of projected increases in the frequency of flood-generating conditions due to climate change, and increases in population density and assets in floodplains (e.g., BARREDO, 2009; IPCC, 2012; HALL et al., 2014; HIRSCH and ARCHFIELD, 2015; WINSEMIUS et al., 2016; VIGLIONE et al., 2016; BLÖSCHL et al., 2017, 2020).
For describing the nature of flood change in a region it is therefore of primary importance to quantify changes in flood regimes in the distant and more recent past, identify their possible causes, and make projections of possible climate change impacts on floods into the future. In this Chapter we collect key research results on these aspects for Switzerland, taking into account complementary European and global findings.
In Section 2 we look into the distant past, and review methods to reconstruct flood frequency and magnitude from paleoflood records derived from sediment deposits in lakes and floodplains, from sediment geochemistry and grain sizes, at long (e.g.
Holocene) timescales. Dendrochronological methods, which record damages in tree rings of riparian species, are presented for shorter timescales. Such paleoflood reconstructions are useful to fill gaps in instrumental records, extend time series of floods into the past, and provide envelope values for extreme floods which have not yet been observed. The authors of this section present case studies in Switzerland and make a connection between long-term climate variability and paleoflood variability.
In Section 3 we look at how documentary historical flood information can be used to assess and reconstruct flood frequency and flood magnitudes in the pre-instrumental period in which human modifications to the landscape and rivers were dominant. The authors of this section use Rhine and Limmat case studies to show how the anthropogenic influence on runoff conditions can be semi-quantitatively assessed. Data evidence is given for the clustering of floods into flood-rich and flood-poor periods due to a combination of climatic variables, and the differences in flood frequencies between regions and between catchments due to basin size effects and different rainfall-runoff transformation processes are discussed.
In Section 4 we turn to methods for the formal detection of changes (trends) in flood timing and magnitude from recent instrumental records. The authors of this section present several published and new case studies in Switzerland and globally, where statistical trend testing results for floods and potential climatic drivers are reported. Trend detection studies in Switzerland show the different tendencies north and south of the Alpine divide, and seasonal signals. Trends in floods are not consistent and may affect neighbouring catchments in different ways. Difficulties in interpreting cause and effect relations are presented, and the presence of non-stationarity in flood records is discussed.
In Section 5 we then look closer at the climatic and non-climatic drivers of floods and changes therein. The considered climatic drivers of flooding are heavy rainfall,
Page 10/89
snowmelt or rain-on-snow, and high soil moisture conditions. Floods can generally be attributed to one or more of these climatic drivers and changes therein. The most common non-climatic drivers of flooding are changes in land cover, urbanization, and river engineering infrastructures. Changes in both climatic and non-climatic drivers in Switzerland are summarised from data and modelling studies. The authors of this section stress that flood impacts and flood risk ultimately arise from the interplay of flood hazard, exposure and vulnerability, and their changes in time, and will continue to do so in the future.
In Section 6 we summarise recent studies on climate change impacts on floods, driven by the new CH2018 Swiss climate change scenarios. The authors of this section use three hydrological rainfall-runoff models forced by climate predicted by the CH2018 scenarios to quantify the changes in annual flood maxima and their distributions.
Although the results show small increases in expected annual flood peaks on the average over Switzerland, there is large variability between catchments. In some catchments the climate change signal may hardly be visible, while in others it is strong and prominent. Recognizing uncertainty and variability is important for such predictions, and this is discussed in detail together with methodological modelling aspects.
We close the chapter with a summary of the main open questions (Section 7) and make some recommendations for future research (Section 8).
The overall goals of the Flood Chapter were (a) to synthesize the main results of flood change studies for Swiss rivers and place them in the context of flood changes in Europe and globally, (b) to describe the state-of-the-art methods used in flood change research and provide methodological guidance to readers, and (c) to systematically present and discuss the potential drivers of floods and the problem of attributing changes in floods to their possible causes (flood-generating mechanisms), and their consequences on flood risk. The Flood Chapter was written as a community effort and each section has the contributing authors listed.
Page 11/89
2. Paleofloods: changes in prehistoric flood occurrence
Anselmetti, F.1, Schulte, L.2, Stoffel, M.3
1 University of Bern and Oeschger Centre for Climate Change Research, flavio.anselmetti@geo.unibe.ch
2 University of Barcelona, schulte@ub.edu
3 University of Geneva, markus.stoffel@unige.ch
2.1. Introduction
Recurrence times of the most extreme events as well as periodicity of climate fluctuations usually exceed the time span of instrumental and historic records, so that knowledge of paleofloods is required to obtain a complete understanding of flood frequency and related controlling factors. Paleofloods are past or ancient floods that occurred without direct observation or recording by humans (BAKER 2006). Paleoflood records can be established by geologic (lake sediments, floodplains, geomorphology) or biologic (dendrogeomorphology, lichenometry) archives. These data can be merged with historic and instrumental data to obtain a complete past record of floods, also on younger timescales, and to calibrate the geologic/biologic archives. In this section, we focus on floods in Switzerland on a Holocene timescale and their analysis by means of paleoflood data, techniques and archive integration (SCHULTE et al. 2019a; 2019b; WILHELM et al. 2019).
The systematic records of streamflow from the Swiss urban areas in the lowlands go back to the early 19th century (e.g. the Basel–Rhine station, in operation since AD 1808). In the Alps, in contrast, instrumental hydrological measurements only go back 100 years and many of the time series are affected by flood gaps, e.g. from AD 1937 to 1967 (GEES 1997). For this reason, it is difficult to confidently assess floods with a return period of >200 years using short instrumental series (SCHULTE et al. 2015). The incorporation of paleoflood datasets into conventional flood-frequency analyses greatly extends the hydrological data series (COSTA and BAKER, 1981) reducing uncertainty (RUIZ-VILLANUEVA et al. 2013) and improving the data available for risk analysis (BAKER 2006; 2008). This approach is thus of great value for the planning of large-scale hydrological projects (e.g. OSTENAA and LEVISH 1996). Paleoflood data also provide a significant added value to the instrumental time series by defining the maximum limit of flooding in the analysis of envelope curves (ENZEL et al. 1993), or testing the analysis performed in the calculation of the probable maximum flood PMF (BENITO and THORNDYCRAFT 2005). The PMF has been used as a standard for hydrological analyses of dam safety, a critical topic in Switzerland, for decades. In Switzerland, dam safety guidelines prescribe the estimation of the so-called design flood with return period 1000 years, HQ1000, and the safety flood, estimated by 1.5·HQ1000 or the PMF for dam design (SFOE, 2008). Recent research has focused on using the PMF estimation based on hydrological modelling (ZEIMETZ et al. 2014; 2015), however, the use of paleoflood data series could also improve the estimation of HQ1000. A recent example in Switzerland is the EXAR project (Hazard information for extreme flood events on the rivers Aare and Rhine), which aims to acquire information on extreme floods with return periods between 103 and 107 years in the Aare and Rhine Rivers with paleoflood techniques. Also, the international FWG-INT project developed in the Bernese Alps is an innovative approach that integrates multi-archive datasets from floodplains, lakes, historical sources and botanical evidence for the development of a temporal-spatial (4- D) paleoflood model of alpine catchments (SCHULTE et al., 2019b).
Page 12/89
Paleoflood studies do not necessarily provide analogues of future flood–climate episodes but they may provide evidence of flood response to climate shifts in terms of flood magnitude and frequency (KNOX 2000; REDMOND et al. 2002). Several paleoflood studies in Switzerland have documented the sensitivity of floods to climatic conditions and solar activity (SCHULTE et al. 2008; 2015; GLUR et al. 2013; WIRTH et al. 2013a, 2013b) and the preferential clustering of large floods in certain time periods, influenced by long-term trends in atmospheric circulation or oceanic sea-surface temperatures (SCHULTE et al. 2015; PEÑA et al. 2015).
2.2. Lakes as recorders of past flood events
Lakes act as efficient traps for clastic material eroded from the catchment slopes and floodplains and subsequently transported through the fluvial system (OLDFIELD 2000; SCHILLEREFF et al. 2014). Therefore, lacustrine sediments may record flood events in a continuous and high-resolution mode and thus provide an excellent archive for reconstructing past flood occurrence (e.g. NOREN et al. 2002; MORENO et al. 2008;
DEBRET et al. 2010; GIGUET-COVEX et al. 2011; STØREN et al. 2012; WILHELM et al. 2012; CZYMZIK et al. 2013; GILLI et al. 2013; GLUR et al. 2013; WIRTH et al. 2013a).
An important advantage is that lake sediments are barely prone to erosion (GILLI et al.
2013) when compared to much more erosive systems in fluvial sedimentary sequences (e.g. SHEFFER et al. 2003; MACKLIN et al. 2005; THORNDYCRAFT et al. 2005;
SCHULTE et al., 2019). The intercalation of continuously deposited background sediment with discrete flood layers, usually differing strongly in lithology (Box 2.1), offers the potential for the reconstruction of a temporally complete flood record (GILLI et al.
2013). The temporal resolution of such lake-sediment sequences depends on the background sedimentation rate but in the case of annually-layered lithology (varves), even the seasons of paleofloods can sometimes be determined (WIRTH et al. 2013a).
These lake-sediment sequences usually contain abundant terrestrial organic matter so that reliable radiocarbon dating can be established.
Extreme precipitation mobilizes and entrains large amounts of sediment particles in a catchment and feeds them into the river network. In the next downstream lake, these floods produce characteristic turbidite layers (MULDER and CHAPRON 2011; GILLI et al. 2013: SCHILLEREFF et al. 2014). Best-suited lakes for flood reconstructions have sufficient relief in the catchment, have inflows forming deltas, and are characterized by a flat and horizontal basin floor, where the flood turbidites accumulate and consequently level out inherited topography (GILLI et al. 2013). Single-lake records may be strongly influenced by local signals or particularities of the specific catchment, such as anthropogenic impact, glacier-cover change, or hydrologic changes. Regionally more significant paleoclimate reconstructions can be obtained using multiple-lake records through investigating and averaging as many sites as possible (see two case studies in sections 2.2.1 and 2.2.2).
Box 2.1: Lacustrine flood layers
Flood layers show a characteristic particle-size grading reflecting the waxing (i.e.
coarsening up) and waning (i.e. fining) of the paleoflood hydrograph (Figure) (MULDER et al. 2003; LAMB and MOHRIG 2009; MULDER and CHAPRON 2011; GILLI et al.
2013). The top part of the flood layer shows the finest particles and has often a distinctive light colour. Sometimes, several stacked graded intervals within the same flood layer indicate multiple discharge peaks (GILLI et al. 2013). Similar turbiditic deposits may originate from subaquatic mass movements triggered by earthquake-induced shaking, delta overloading, or lake-level fluctuations (e.g. GIRARDCLOS et al. 2007; STRASSER et al. 2007; WIRTH et al. 2011). Hence, it is important to distinguish between flood- and mass-movement-induced turbidite layers (BECK 2009; WIRTH et al. 2011; SIMONNEAU
Page 13/89
et al. 2013). Mass-movement turbidites are composed by remobilized lake sediments showing a different grain-size pattern and mineralogical and organic composition than flood turbidites. They are often, but not necessarily, thicker than flood layers with a weaker grain-size sorting and a higher content of endogenic minerals and a dominance of aquatic organic material (ARNAUD et al. 2002; SIMONNEAU et al. 2013).
Figure: (a) Contrasting lithologies between background deposits and flood layers. Flood layers (grey bars) are characterized by the fine-grained top part of the layer (‘clay cap’) marked in light grey bars; (b) Grain-size measurements across one flood layer indicated by the white arrow in Lake Thun (core width = 6 cm) (modified from GILLI et al. 2013).
In addition to the occurrence and age of paleofloods, several studies indicated that paleoflood intensities can be reconstructed using lacustrine flood layers (BROWN et al. 2000; MULDER et al. 2003; BUSSMANN AND ANSELMETTI 2010). The thickness of a detrital layer reflects the volume of mobilized particles, whereas the grain-size distribution of the flood turbidites may reflect the flood dynamics and magnitude.
However, these characteristics of the flood layers are also influenced by sediment availability in the catchment, which in turn is influenced by climate, human impact and vegetation cover.
2.3. Geoarchives and historical data from floodplains
2.3.1. Multi-archive analysis of floodplainsMost Pleistocene, glacier-scarped main valleys of the Alps are hotspots of flood risk in Switzerland. The principal reason is the dense population and very limited space for settlement, corresponding mostly to distal areas of alluvial cones and river floodplains, and the fast flood response of small- and mid-size Alpine catchments to
Page 14/89
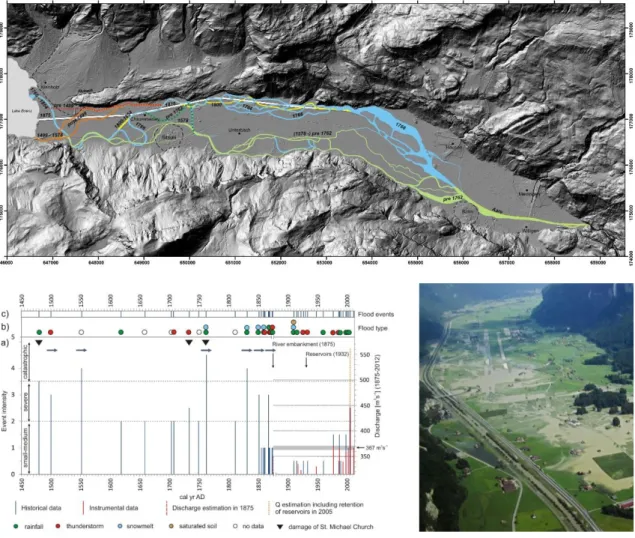
heavy rainfall (WEINGARTNER et al. 2003; VISCHER 2003). The on-site analysis of flood archives on floodplains where major damage occurs is promising, but also challenging, due to the complexity of physical processes involved in a dynamic mountain environment (SCHULTE et al. 2019b). Nevertheless, the floodplains of Alpine main valleys and deltas in Switzerland provide excellent sites to reconstruct a continuous flood history (SCHULTE et al. 2009a; SCHULTE et al. 2015; LAIGRE et al. 2013). For example, fluvial erosion, aggradation, channel shifting and avulsion, crevasse splay, effects of embankment and channel correction, generated a characteristic spatial imprint of valley floor geomorphology over centuries in the Aare River valley (Figure 2.1).
Figure 2.1: Top -- Evolution of Aare River paleo-channels reconstructed from historical maps, field survey and documentary sources. Bottom left -- Historical flood chronology of the Aare river in the Hasli Valley from AD 1480 to 2012 (SCHULTE et al. 2015). Bottom right -- Oblique aerial photograph (Credits Schweizer Luftwaffe) of the 2005 flooding of the Hasli-Aare floodplain.
The problem of complexity of the time-space evolution of floodplain dynamics can be overcome by an accurate multi-archive reconstruction as demonstrated by SCHULTE et al. (2009a), (2009b), (2015) for the Lütschine and Lombach Deltas and the lower Hasli- Aare Valley (Figure 2.1). From the integration of historical data, channel capacity and instrumental measurements, the authors concluded that before AD 1875 a discharge of 351 m3s-1 (a conservative estimate) produced small-medium intensity damage, whereas a discharge of 500 m3s-1 or higher, probably caused catastrophic damage.
Page 15/89
2.3.2. Flood reconstruction from floodplain deposits
Sedimentary and geochemical proxy data can be obtained from floodplain deposits (SCHULTE et al., 2008; 2015; CARVALHO and SCHULTE, 2013; Box 2.2).
These data can be used to reconstruct flood activity by tracing geochemical signatures in floodplain deposits (SMITH and BOARDMAN 1989; PAINE et al. 2002; SCHULTE et al. 2008; JONES et al. 2012; BERNER et al. 2012).
Box 2.2: Sedimentary floodplain archives
Different sediment structures, facies and mineralogy of flood layers result from colluvial, fluvial, alluvial and soil-formation processes. Channel and crevasse splay deposits are generally composed by coarse sand and gravel, levees by sand layers, and over-bank deposits by fine sand and silt, and interdistributary basins contain clay-rich and organic- rich layers as well as peat horizons (Figure). River channel shifts and avulsions may cause erosion and re-deposition, whereas sediments in intradistributary basins are deposited conformably. In addition, grain size also reflects flood magnitude. During larger floods, coarse-grained flood layers are deposited, while during moderate and minor floods, fine, sand and silt deposits, and organic-rich horizons are generally formed (SCHULTE et al. 2009a; BERNER et al. 2012).
Figure: Top -- IN-2 key section of the Lütschine fan delta. Below -- Lithology, facies and chronology of the IN-10 key section, located 250 m southwest of the IN-2 section. Radiocarbon dates presented in grey were not used for the chronological model (modified from SCHULTE et al. 2009a).
Page 16/89
BERNER et al. (2012) reconstructed the modern river flood history of the Rhine River based on the correlation between discharge and carbonate content of the suspended load of the Rhine River and floodplain chemostratigraphic characterization.
SCHULTE et al. (2008), (2009), (2015) studied the provenance, deposition and diagenetic processes of sedimentary materials and pedological features in several floodplains of the Bernese Alps.
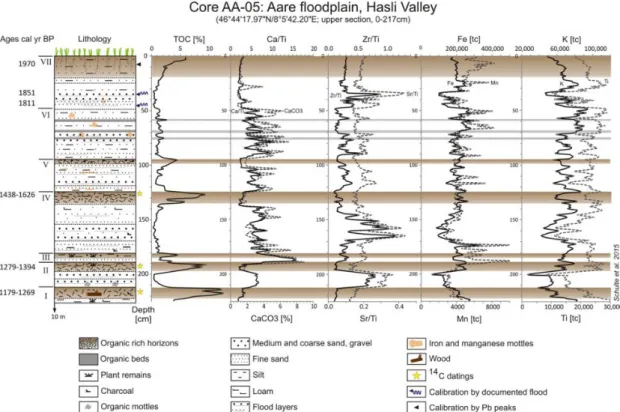
Figure 2.2 shows several major deposition pulses and geochemical variability of upward thinning sequences in a key-section of the Hasli-Aare floodplain. The aggradation of sandy overbank deposits during major flooding is accurately recorded by Zr/Ti, Sr/Ti and Ca/Ti peaks associated with coarse-grained flood layers. Between AD 1480 and AD 1875 (termination of the Aare River Correction) twelve of the fourteen historically recorded extreme events were also recorded by coarse-grained flood layers (Figures 2.1 and 2.4). Furthermore, the ratios of stable elements provide information on the provenance of sediments. Zircon is a tracer for sediment supply from the highest area of the basin because this heavy mineral is present in the crystalline rocks such as syenite, granite and amphibolites of late Palaeozoic intrusions.
Figure 2.2: Lithology, chronology and geochemical stratigraphy of a core from the Aare floodplain.
(from SCHULTE et al. 2015).
2.4. Paleoflood reconstructions based on tree rings
Trees preserve evidence of floods in their annual growth rings whenever they are impacted by floods. The use of trees as paleoflood indicators is based on the ‘process–
event–response’ concept (SHRODER 1978), in which a flood represents the ‘process’, the ‘event’ is the resulting tree disturbance (e.g., abrasion scars, abnormal stem morphologies, eroded roots, tilted trunks, or standing dead trees) and the ‘response’
refers to the physiological response of trees to the disturbance, which results in a specific anatomical imprint created within the tree’s annual growth rings (STOFFEL and CORONA 2014; BALLESTEROS-CÁNOVAS et al. 2015a). Scars on tree trunks are the
Page 17/89
most common evidence of past flood activity. Scars are caused by the impact and abrasion of debris and wood transported during floods (STOFFEL and BOLLSCHWEILER 2008). Scarring can also cause secondary growth and anatomical signatures, such as tangential rows of traumatic resin ducts, changes in vessel size, or callus tissues (BALLESTEROS et al. 2010; ARBELLAY et al. 2012). These features are used to identify the year of past floods, and sometimes even determine the season of flooding (STOFFEL and CORONA 2014). The height of scars can be used to derive peak discharge estimates (BALLESTEROS-CÁNOVAS et al. 2011).
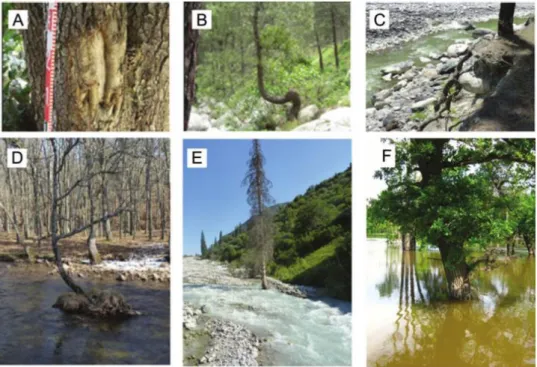
Other paleoflood evidence recorded by trees include (Figure 2.3): (i) abrupt decreases in tree-ring widths due to partial tree burial, which limits their nutrient supply and ability to take in water (FRIEDMAN et al. 2005; KOGELNIG-MAYER et al. 2013); (ii) changes in root anatomy after exposure by bank erosion (MALIK 2006), or (iii) anatomical anomalies produced when trees are inundated for weeks during the early growing season (ST. GEORGE et al. 2002; WERTZ et al. 2013).
The use of tree-ring records as a surrogate of flood timing and magnitude has expanded substantially in recent time (ZIELONKA et al. 2008, THERRELL and BIALECKI 2015, BALLESTEROS-CÁNOVAS et al. 2017). A detailed review of paleoflood studies based on tree rings is given by BALLESTEROS-CÁNOVAS et al.
(2015a).
The reliability of tree-based paleoflood estimates has been tested against historical and instrumental flood records. The accuracy of the approach depends in part on tree age (TICHAVSKÝ et al. 2017) and species (BALLESTEROS-CÁNOVAS et al.
2015b) . Because riparian trees can be damaged by other causes (e.g. human activities), trees must be selected carefully to minimize the influence of non-flood signals. Moreover, because flood damage can vary between neighbouring trees, samples must be taken from a sufficiently high number of trees to replicate the flood signals and develop reliable estimates of past flood events (BALLESTEROS-CÁNOVAs et al. 2015a; CORONA et al.
2012).
Figure 2.3: Types of botanical evidence to identify paleofloods using tree rings: (A) tree injuries;
(B) broken stems and unusual stem morphologies; (C) exposed roots; (D) tilting trees; (E) dead trees; (F) abnormal anatomical structures due to inundation (from BALLESTEROS-CÁNOVAS et al. 2015a).
Page 18/89
Tree rings have also been used to reconstruct mass-wasting processes in Switzerland, such as debris flows (STOFFEL and BOLLSCHWEILER 2008;
SCHNEUWLY et al. 2012), landslides (SAVI et al. 2013; LOPEZ-SAEZ et al. 2017), rockfalls (STOFFEL et al. 2005; TRAPPMANN et al. 2013; MOREL et al. 2015) or snow avalanches (STOFFEL et al. 2006; FAVILLIER et al. 2017, 2018). To-date, tree-ring studies have not been applied widely to reconstruct floods in Switzerland.
2.5. Paleofloods and climate variability
2.5.1. Floods in the Northern Alps during the last 2500 years
A 2500-year long flood reconstruction for the Northern Alps, on the basis of dated sedimentary flood deposits from ten lakes in Switzerland, showed strong decadal to centennial-scale variations in the occurrence of floods (GLUR et al. 2013). The condensed signal on the basis of over 800 identified and dated flood layers is interpreted to be a regional paleoclimatic signal less influenced by local effects. These data were compared to an independent temperature reconstruction using tree rings sampled in an adjacent region (BÜNTGEN et al. 2011). The comparison indicates that high flood frequency coincides significantly with cool summer temperatures reflecting varying climate states through the last 2500 years affecting both temporal patterns of temperature and of precipitation extremes.
This pattern implies that enhanced (decreased) occurrence of westerly and Vb storm tracks during cooler (warmer) summers increase (decrease) the frequency of flood events in the Alps. As the main determining factor for the frequency of intense precipitation events in the Alps, a variable extent of the Hadley Cell and consequently changing atmospheric circulation patterns were proposed. This wet-cold synchronism suggests enhanced flood occurrence to be triggered by latitudinal shifts of Atlantic and Mediterranean storm tracks. This paleoclimatic perspective reveals natural analogues for varying climate conditions, and thus can contribute to a better understanding and improved projections of weather extremes and floods under climate change.
2.5.2. Holocene flood frequency across the Central Alps
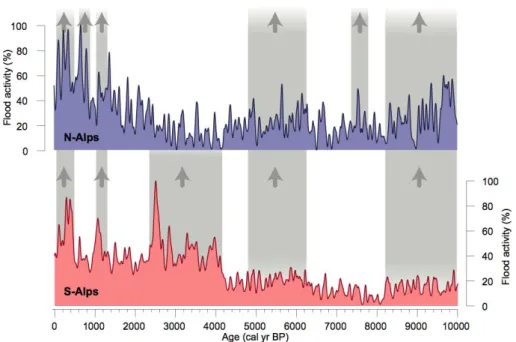
Over 4700 flood layers from 15 lacustrine sediment records from the Northern and Southern Central Alps were identified, dated and merged in a comprehensive Alpine flood catalogue covering the past 10,000 years (WIRTH et al. 2013a). This Holocene flood record provides the possibility to investigate flood occurrence during warm (e.g.
Holocene Thermal Maximum) and cool (e.g. Neoglaciation) periods at a large spatial extent, potentially providing information on characteristic atmospheric circulation patterns during different climatic conditions (Figure 2.4). At this large temporal and spatial scale, flood frequency was found to be higher during cool periods, coinciding with lows in solar activity. Periodicities of flood occurrence match those from reconstructions of solar activity from 14C and 10Be records. As mentioned above, the likely driving mechanism, an expansion/shrinking of the Hadley cell with increasing/decreasing air temperature, causing dry/wet conditions in Central Europe during phases of high/low solar activity is suggested. Furthermore, differences between the flood patterns from the Northern Alps and the Southern Alps indicate changes in North Atlantic circulation.
Enhanced flood occurrence in the South compared to the North suggests a pronounced southward position of the Westerlies and/or blocking over the northern North Atlantic, hence resembling a negative NAO state (most distinct from 4.2 to 2.4 kyr BP and during the Little Ice Age). South-Alpine flood activity therefore provides a qualitative record of variations in a paleo-NAO pattern during the Holocene.
Page 19/89
.
Figure 2.4: Stacked flood records for the N- and S-Alps (100-year low-pass filtered) spanning the past 10 kyr. Grey areas and grey arrows mark periods with increased flood activity (from WIRTH et al. 2013a).
2.5.3 2600-yr sedimentary flood record from the Hasli-Area floodplain
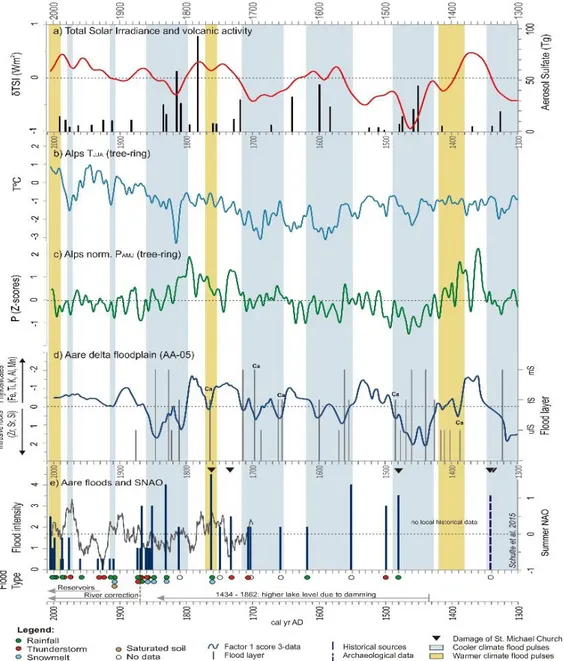
In the Bernese Alps SCHULTE et al. (2008), (2009), (2015) showed the possibility to correlate geochemical floodplain proxies with paleoclimate variability over three millennia. Figure 2.5 shows that seven paleoflood clusters defined by flood layers deposited predominantly during periods of reduced solar irradiance, cooler summer temperatures and phases of drier spring climate. Cooler climate pulses typically generate glacier advance, more extensive snow cover, and snow patches through the summer.
Water storage and larger areas susceptible for melting processes associated with rainfall episodes and abrupt rises in temperature can increase surface runoff on slopes and consequently the discharges of Alpine rivers. However, three flood clusters occurred during warmer climate pulses (1380-1420; around 1760; 1977-present). Glacier and snow melt, higher snow limits, reduced snow cover and consequently a larger area of surface runoff combined with intense summer precipitation promoted flooding in the valley floor in these periods.
Spectral analysis of the geochemical and pollen time series and climate proxies such as Total Solar Irradiance and δ18O isotopes from Greenland ice cores, temperature and precipitation reconstruction from tree-rings, and climate teleconnection indices (NAO, SNAO), indicate similar periodicities around 80, 100, 120 and 200 years (Gleissberg and Suess cycles). Thus, the mechanisms of the flood processes, at this large scale, are influenced not just by local factors but are strongly influenced by the North Atlantic dynamics and solar forcing.
The influence of atmospheric circulation dynamics on flood frequencies in the Hasli-Aare Valley is observed when flood intensities and geochemical proxies from the Hasli Valley and indices of atmospheric modes AD 1670 to 2000 are compared (Figure 2.5; SCHULTE et al. 2015; PEÑA et al. 2015). Severe floods occurred mostly during positive trends of Summer North Atlantic Oscillation (SNAO) phases or short positive SNAO pulses (cyclones of Mediterranean origin) following years or even decades dominated by negative SNAO (North Atlantic front systems; PEÑA et al. 2015; PEÑA and SCHULTE, 2020). This combination underlines the importance of the effect of
Page 20/89
snowmelt during short warm episodes within cool climate periods characterized by larger snow cover and glaciers.
Figure 2.5: Comparison between historical flood reconstruction of the Hasli-Aare and solar and volcanic activity, tree-rings and climate proxies (1300-2010 cal yr AD) (from SCHULTE et al.
2015).
2.5.4 Temporal-spatial integration of multi-archive datasets in the Bernese Alps The spatial and temporal integration of multi-archive flood series from the Hasli- Aare, Lütschine, Kander, Simme, Lombach, and Eistlenbach catchments constitutes an innovative approach to the reconstruction of accurate flood pulses over the last six centuries and the development of a temporal-spatial model of past flood behaviour (SCHULTE et al. 2019a, 2019b). Paleoflood records obtained from floodplains (four flood series) and lake sediments (four series), together with documentary data (six series), were analyzed and compared with instrumental measurements (four series) and the profiles of lichenometric-dated flood heights (four series).
Page 21/89
The most accurate, continuous series, corresponding to the period from 1400 to 2005 CE, were integrated employing a complex integration process that involved data selection, normalization, filtering and factor analysis with different settings into a synthetic flood master curve that defines ten dominant flood pulses. This robust master curve improved the previously published individual floodplain and lake paleoflood data series. It is worth to note that the pulses of sedimentary floodplain proxies are similar to the flood evidences provided in documentary data series, showing the large flooding in the settled floodplains and deltas, whereas lake records from small catchments reflect more erosion processes related to hydro-meteorological events. Six of the integrated flood pulses correspond to cooler climate pulses (around 1480, 1570, 1760, 1830, 1850 and 1870 CE), three to intermediate temperatures (around 1410, 1650 and 1710 CE), while the most recent corresponds to the current pulse of Global Warming (2005 CE).
Furthermore, five coincide with the positive mode of the Summer North Atlantic Oscillation, characterized by a strong blocking anticyclone between the Scandinavia Peninsula and Great Britain.
For two of the most catastrophic flood events in the Bernese Alps (those of 1762 and 1831 CE), the location and magnitude of all the flood records compiled were plotted to provide an accurate mapping of the spatial pattern of flooding. This was then compared to the pattern of atmospheric variability by applying CESM-LME simulations (SCHULTE et al. 2019b; PEÑA and SCHULTE, 2020). The event-related spatial information including low and high altitudes of flood evidence and the simulation of composite sea level pressure maps give a deeper insight in flood dynamics and forcing.
Take-Home Messages
Reconstructions of paleoflood occurrence (and magnitude) are possible from sediment deposits in lakes and floodplains where sediments record floods, which together with sediment geochemistry and grain-size distributions, provide indications of flood magnitude and timing.
Paleoflood reconstructions for shorter time periods can also be achieved by dendrochronology and lichenometry, which record a range of flood damages in the tree rings of riparian species and heights of flood levels by lichen colonization.
Such paleoflood reconstructions are useful to fill gaps in instrumental records, extend time series of floods, and provide envelopes on extremes.
Data show a connection between long-term climate variability and floods at a regional scale, where evidence of large-scale shifts in weather pattern and long- term climatic oscillations lead to the clustering of floods into flood-rich and flood- poor periods. The analysis of the paleoflood records provides insights into how future climatic variations might influence flood magnitude and frequency.
Centennial to millennial-scale fluctuations in flood activity are governed by periodicities in climatic mechanisms and forcing factors. Variations in solar activity are an important factor in climate variability as well. For example, high flood activity correlates to low solar activity, Holocene cold events, and to global/Alpine glacier advances.
Human activities such as deforestation and agriculture, especially in the northern part of the Alps, could have resulted in the increasing trend in flood activity during the past 2-2.5 kyr on top of climate forcing. River regulation and reservoirs mask the climate signal of floods since the 19th century.
A new integrative approach developed and tested in the Bernese Alps provides a comprehensive 4-D picture of paleofloods which facilitates an in-depth understanding of floods and flood forcing in mountain catchments.
Page 22/89
3. Historical floods: changes in floods since the 13th Century
Wetter, O.1, Schmocker-Fackel, P.2, Pfister, C.1, Schulte, L.3, Mudelsee, M.4, Rössler, O.5, Peña, J.C.6, Ruiz-Villanueva, V.7
1 OCCR, University of Bern, oliver.wetter@hist.unibe.ch, christian.pfister@hist.unibe.ch
2 BAFU, petra.schmocker-fackel@bafu.admin.ch
3 University of Barcelona, schulte@ub.edu
4 Climate Risk Analysis, mudelsee@climate-risk-analysis.com
5 Formerly at University of Bern, currently at BFG, Koblenz, roessler@bafg.de
6 Servei Meteorològic de Catalunya, jpena@meteo.cat
7 University of Lausanne, virginia.ruiz-villanueva@unil.ch
3.1. Introduction
Historical hydrology is based on data derived from historical written, pictorial and epigraphic documentary evidence (e.g. BRÁZDIL et al. 2006a, PFISTER et al. 2006). It is situated at the interface between hydrology and environmental history, using methodologies from both disciplines (BRÁZDIL et al. 2006b, 2012; BENITO et al. 2015) to significantly extend the measurement period (WETTER 2017) with flood experience from the pre-measurement past, especially within the period of human activity in the landscape affecting rivers. Quantitative hydrological, meteorological and climatological information is paramount for the analysis of possible changes in the magnitude and frequency of floods. Such information can support not only flood hazard assessment, but also enables the identification of interconnections between flood frequency and severity with climate, land use and river morphology (MACDONALD and BLACK 2010; BENITO et al. 2015). For example, the EXAR project attempted to acquire data on analogues to the 103 to 107 years flood in the catchment area of the Aare River. Such extreme events cannot be adequately assessed by using standard statistical methods as the extrapolation from short reference series causes high level of uncertainties. In this section, we present how the inclusion of documentary flood information significantly expands the assessment of flood changes in Switzerland from instrumental records in the recent past (Box 3.1).
Box 3.1: Documentary evidence on floods in Switzerland
Documentary evidence on floods, droughts and other extreme events are found in chronicles, annals, memorial books, memoirs, diaries, travel reports, newspapers, journals, early scientific expert reports, municipal accounts, accountings, paintings, photographs, maps, flood marks, hunger stones or river profiles (WETTER 2017).
According to PFISTER (1999), historical documentary evidence can be “direct” (DD) and
“indirect” (ID). DD describe the course of events per se, while ID refer to (bio)physically based phenomena associated with such events. DD in continuous chronologies often contain sufficient information for identifying and characterizing floods (BARRIENDOS AND RODRIGO 2006), as they usually provide flood date, magnitude and socio- economic impacts (BRÁZDIL et al. 2006b; 2012; GLASER et al. 2010; BENITO et al.
2015). With respect to the generation of historical documentary evidence, PFISTER (2018) differentiates between individual (IS) and institutional sources (IN). IS are shaped by the social background, motivations and preferences of their authors (BENITO et al.
2015), and their temporal scope is limited. IN on the other hand are produced by institutions (i.e., bodies in charge of performing official functions including taxation, law, etc.). IN generally involve a good level of standardization, which is a good prerequisite for creating long-term homogeneous series of climate and flood parameters. Swiss IN,
Page 23/89
for example like the books of weekly expenditures of the city of Basel, do have a very good potential for hydrological and climatological analysis, as shown by SPYCHER (2017), who found 70 high water and flood episodes for the river Rhine and 218 events for the brook Birsig which is a local tributary of the Rhine for the period between 1600 to 1650, while chroniclers only reported 3 Rhine and 5 Birsig floods. The significantly
“sharper observation skills” towards minor events by IN is explained by the fact that infrastructure may already be endangered by relatively small events, whereas IS (e.g.
chroniclers) only focus on spectacular extreme events. IN like the weekly expenditures are at hand for almost every other Swiss town.
3.2. High Rhine River flood occurrences since the 13
thCentury
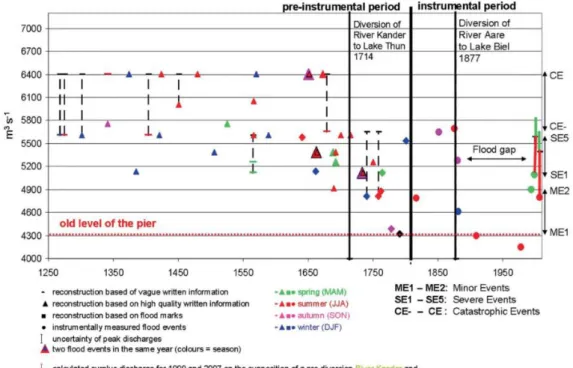
The River Rhine at Basel drains two thirds of the Swiss territory (approximately 36’000 km2), and as such reflects the major flood occurrences in Switzerland (e.g., BELZ et al. 2007). The drainage area of the main tributary, the Aare River (17 779 km2) is entirely situated in Switzerland. Its runoff was affected by an artificial diversion of one of its tributaries, the Kander River, to Lake Thun in 1714, and since 1868 and 1891 it is controlled by the First Jura-Waters Corrections (FJWC), which diverted the Aare into Lake Biel in 1878. These regulations considerably reduced the peak discharges of the River Aare and, thus, those of the Rhine at Basel (see Figure 3.1).
Figure 3.1: Rhine River discharges between 1250 and 2010 based on documentary and instrumental evidence assessed by reconstructed peak water levels based on IS and unsteady 1D flood routing modelling (WETTER et al. 2011).
All severe events except two floods (1999 and 2007) occurred before 1877, with no single severe event documented between 1877 and 1998 (Figure 3.1). This intermediate 121-year-long “flood disaster gap” is unique in the period from 1268.
Chroniclers repeatedly mentioned that the Lakes of Neuchâtel, Biel and Murten including their adjacent shore and swamp areas merged into a huge lake for several days, suggesting that the peak floods on the lower course of the Aare were considerably dampened. However, the above-mentioned river engineering measures (Kander and FJWC) may not be the only reason for the observed peak discharge reductions but additional climatological explanations should be considered as well (WETTER et al.
Page 24/89
2011). Some of the pre-instrumental flood events were described in such detail, that the triggering meteorological conditions could be reconstructed in sufficient detail. For example, the flood event of 1480 was described in great detail by the Bernese chronicler Diebold Schilling the Older (1446-c 1486) as the “Deluge of the Rhine”. He writes: “On Maria Magdalena Day it began to pour down in the form of driving rain persisting three days and nights without cessation.” The preceding days were very hot, melting the snow at higher altitudes. Indeed, due to a cold spring and early summer the snowmelt was delayed. Assuming an average rainfall intensity of 10 mm/h for the 72 hours between 29th and 31th July we get an estimated precipitation amount of 720 mm for this storm.
3.3. Low and high flood frequency periods since the 16
thcentury in Swiss river basins
Documentary sources are also key to reconstruct flood frequencies over longer periods of time and to identify cycles of high and low flood activity. One recent period without significant floods was identified by the flood reconstruction for the High Rhine River in Basel. However, it would be interesting to know if the same low flood frequency period affected other river basins in Switzerland and Europe or if other periods of high or low flood frequencies can be identified and explained.
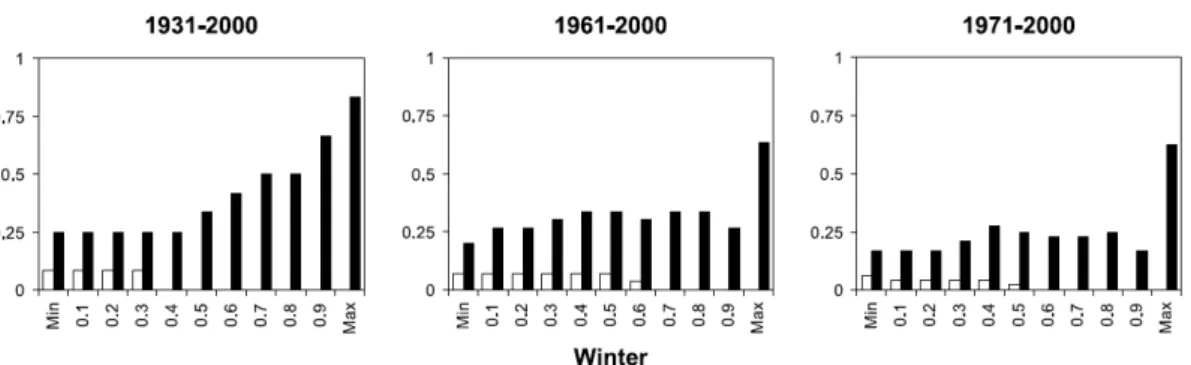
To answer these questions SCHMOCKER-FACKEL et al. (2010a) collected historical flood data for 14 Swiss catchments dating back to 1500 AC (Figure 3.2). These catchments were all situated in northern Switzerland, either in the Alps or in the Swiss Plateau. The largest catchment is the Rhine River catchment up to Basel and the smallest is the Renggbach in central Switzerland (12 km2). In this study, a flood event was counted if the name of a river and flood damage caused by the river were mentioned explicitly in documentary records. The use of different catchments, sources and definitions of flood events lead to differences in the final reconstruction, and this should be taken into account when comparing different historical flood series.
The obtained data series resulted in 400 historical flood events in the 14 catchments. More than 100 events affected more than one catchment and 48 events were classified as large-scale flood events (i.e., a flood occurred in more than three catchments at the same time and caused extensive damage). Flood-rich periods alternate with lower flood frequency periods in all catchments, independently of catchment size. The recent increase in flood frequencies, starting in the 1970s is still in the range of observed natural variability. In a further step, SCHMOCKER-FACKEL et al.
(2010a) tried to explain the changes in flood frequencies using generalized parameters like climate periods, solar activity, the north Atlantic oscillation (NAO) index, mean air temperatures, or length variations of glaciers.
The results in Figure 3.2 show that the periods characterized with reduced flooding correspond to the end of the Spörer Minima (1420–1550), the Maunder Minima (1645–1715) and the Dalton Minima (1790–1820) of solar activity. However, solar activity alone does not explain flood frequency, as in the 20th century period characterized with low flood frequency, solar activity was high (see following and previous chapters). The authors did not find a clear relation between the flood data and the reconstructed summer and winter NAO indices, meaning that the forcing of the NAO in the Alpine region might be weak and NAO phases do not correlate well with Alpine precipitation. No clear relationships could be identified between mean air temperatures (winter or summer) and flood frequency. However, high flood frequency periods correspond to periods of rapid climatic change in the Alpine region. According to these observations, it was not possible to explain the detected flood frequency changes with single generalized climatic parameters, as the reasons for these changes are likely due to a combination of several factors.
Page 25/89 Figure 3.2: (A) Frequency of flood events in 14 Swiss catchments and catastrophic events throughout Switzerland. P1-P4 are periods with many floods and L1-L4 with few floods in northern Switzerland. (B) Spörer, Maunder and Dalton periods of low solar activity and the total solar irradiance TSI. (C) Annual summer NAO values (black) and the 30-year moving average (red).
(D) Reconstructed Swiss summer temperatures. (E) Advances and retreats of the Lower Grindelwald and the Great Aletsch glacier (from SCHMOCKER-FACKEL et al., 2010a).
Other authors also found that flood frequencies in Europe have changed at intervals of 30-100 years during the last 500 years (e.g. BÖHM and WETZEL 2006;
BRÁZDIL et al. 2006b; GLASER 1998; HALL et al. 2014) or even within the past millennium (GLASER and STANGL 2004). A comparison with the flood patterns of other European rivers suggests that flood frequencies are not in-phase over Europe but reoccurring spatial patterns of flood frequency do seem to occur (SCHMOCKER- FACKEL et al. 2010a). This seems to be the case also on a global scale (e.g.
BERGHUIJS et al. 2017). The flood frequencies in northern Switzerland are often in phase with those of rivers in Spain, Italy and the Czech Republic, but less with those in Germany. Although it seems likely that changes in atmospheric circulation patterns on decadal time scales may be responsible for these spatially heterogeneous changes in flood frequency (JACOBEIT et al. 2003, MUDELSEE et al. 2004; WANNER et al. 2004), there are also other factors at play.
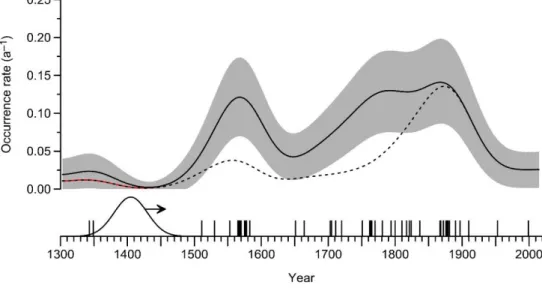
Similar patterns can be observed at the Limmat river in Zurich (Figure 3.3) for the interval from 1300 to 2015. A local increase in flooding occurred at around 1567 (0.12 events per year). The subsequent 17th and early 18th centuries saw significantly reduced flood risk, in agreement with findings for other regions in central Europe
Page 26/89
(LUTERBACHER et al. 2001; MUDELSEE et al. 2003; 2006). A second peak in flood occurrence was reached at around 1867 (0.14 events per year), from this time on the flood occurrence rate steadily decreased. Such a downward trend during the recent decades has also been observed for the rivers Elbe and Oder during winter (MUDELSEE et al. 2003).
Figure 3.3: Estimated flood occurrence rate (number of floods per year, solid line; 90% confidence band, grey) analysed using a Gaussian kernel function (shown with an arrow in the bottom part) for the river Limmat in Zurich for the interval 1300-2015. The estimation is performed on all m = 47 historical events (shown as bar chart in the bottom part). Omission of the uncertain event in AD 1349 (m = 46) leads to an indistinguishable estimation (red line). Utilization of only the historically critically examined events (m = 26) leads to a lower occurrence rate (dashed line).
See MUDELSEE et al. (2003), (2004) and (2014) for further methodological details.
An important limitation of historical flood data series analysis is that man-made or natural morphological changes in the river channel geomorphology, river flow capacity, or the anthropogenic construction of dams and channelization works over centuries (Box 3.2), may lead to homogeneity problems (CAMUFFO and ENZI, 1996;
SCHULTE et al. 2009; SCHMOCKER-FACKEL et al. 2010, HALL et al. 2014a). Methods have been developed to quantify the changes due to anthropogenic river engineering measures on the overall in- and outflow runoff conditions of a location of interest (e.g.
WETTER and SPECKER 2014; WETTER et al. 2016; NÄF-HUBER et al., 2016;
WETTER 2017). Once the relevant anthropogenic changes to the overall runoff conditions are known and quantified, two things become possible. First is the identification of hot spots, i.e. locations where failure in river engineering measures could dramatically change floods, and second is that correction can be applied to flood events that took place in the pre-anthropogenic conditions, to homogenise them to the contemporary runoff conditions.
For example, at the Limmat River, five periods were identified as having homogenous runoff conditions and then homogenised to the current runoff conditions.
According to the homogenised flood series we are now able to see that in the last 718 years there were at least three flood events (1876, 1817 and 1720) that most probably would have been more extreme than the 1999 flood event if they had taken place under current runoff conditions in Zürich. Flood risk analysis may thus now be based on long term homogenised flood evidence which simulates the risk under current runoff conditions (see Fig. 3.3.).
Page 27/89
Box 3.2: Floods and anthropogenic changes
Rivers are dynamic systems, which adjust their geometry, morphology, grain size to the dominant discharges and sediment supply, thereby affecting flooding. All of these processes may have experienced important variations due to environmental and anthropogenic changes during the last centuries. The human action produced not only land cover and land use changes, but includes also direct alterations due to river regulation, deviation and the construction of embankments. The identification of such long-term spatial changes requires a complex approach (e.g. SCHULTE et al. 2009;
2015) that integrates multiple archives and methods (e.g., geomorphological mapping, systematic coring of floodplain sediments, location of historical buildings and archaeological sites, the study of historical maps, sources and aerial photographs. This spatial integration contributes to the understanding of current as well as historic flooding, channel shifts and aggradation of sediments which effected settlements and local communities. For example, the repeated flooding of the Lütschine fan delta and the changes of drainage to Lake Brienz and/or the Bödeli-Aare River are shown by the reconstruction of the paleo drainage systems in 2003 (see Figure; SCHULTE et al. 2009) which were reactivated during the 2005 flood.
Figure: Morphological map of the historical evolution of the fluvial channels on the Lütschine fan delta (from SCHULTE et al. 2009).