BANKABLE PAPER
EVALUATION OF WULKAPRODERSDORF-SOPRON LINE (WP 6.4.1)
MARCH 31st, 2014
Authors:
Alexander Schnabl (IHS), Gerhard Platzer (TMC), Martha Ecker (IHS), Hans Fritzsche (TMC), Brigitte Hochmuth (IHS), Sebastian Koch (IHS), Sarah Lappöhn (IHS), Alina Pohl (IHS)
2 / 49
Table of contents
1 Introduction ...6
2 Context analysis and project objectives ...7
2.1 Socio – economic context ...7
2.2 Definition of project objectives ...8
2.3 Consistency with EU and national frameworks ...9
3 Project identification ... 10
4 Technical Study and Feasibility study ... 11
4.1 Technical Study ... 11
4.1.1 Calculation of investment costs ... 12
4.1.2 Calculation of infrastructure maintenance costs ... 14
4.1.3 Calculation of network operation costs ... 15
4.2 Railway operational program ... 16
4.3 Feasibility Study ... 19
4.3.1 Calculation of transport demand ... 19
4.3.2 Development of regional traffic ... 20
4.3.3 Transportation demand by means of transport ... 22
4.3.4 Development 2013 - 2020 ... 24
4.3.5 Impact of project measures on choice of transport mode ... 24
4.3.6 Tariff revenues ... 26
4.3.7 Reduction of road traffic ... 27
5 Financial Analysis ... 29
5.1 Methodology ... 29
5.2 Necessary data ... 29
5.3 Calculations ... 29
5.4 Results of the financial analysis ... 30
6 Savings in travel time ... 31
6.1 Methodology ... 31
6.2 Results ... 31
7 Short-term economic effects ... 33
7.1 Methodology ... 33
7.2 Results ... 33
8 Long-term economic effects ... 36
8.1 Methodology ... 36
8.2 Results ... 36
9 Environmental and social analysis ... 39
3 / 49
9.1 Methodology ... 39
9.2 Results ... 39
10 Risk Assessment ... 42
11 Consolidated economic analysis ... 43
11.1 Financial Analysis ... 44
11.2 Savings in travel time ... 44
11.3 Short-term economic effects ... 44
11.4 Long-term economic effects ... 45
11.5 Environmental and social analysis ... 45
11.6 Consolidated economic analysis ... 45
11.7 Conclusions ... 47
12 References ... 49
4 / 49
List of tables
Table 1: Investment costs: Sopron – Wulkaprodersdorf - Ebenfurth ... 14
Table 2: Infrastructural and maintenance costs ... 15
Table 3: Network operation costs ... 16
Table 4: Operation costs of rail operation and infrastructure revenues ... 18
Table 5: Population development and development of commuting 2013 – 2020 ... 21
Table 6: Calculation of daily trips to the main centres by means of transport 2013 for the whole project area and the “Core Area”) ... 22
Table 7: Calculation of daily trips to the main centres by means of transport 2010/0 for the whole project area and the “Core Area”) ... 24
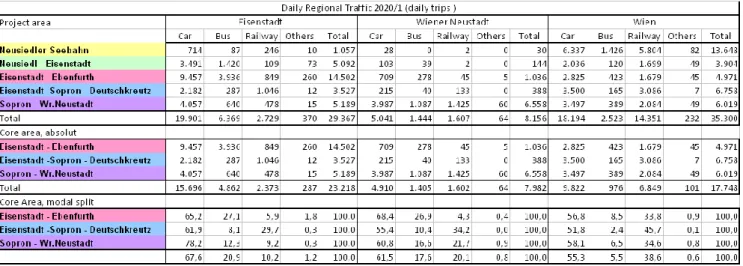
Table 8: Calculation of daily trips to the main centres by means of transport 2020/1 for the whole project area and the “Core Area”) ... 25
Table 9: Daily passenger trips: difference 2013 -2020/0 – 2020/1 by means of transport (Source: TMC 2014) ... 26
Table 10: Calculation of tariff revenues ... 27
Table 11: Calculation of road traffic reductions (TMC, 2013) ... 28
Table 12: Results of dynamic investment analysis, financial base scenario, in Mio. € ... 30
Table 13: Assumptions for monetization of travel time savings ... 31
Table 14: Economic effects on value added in countries and regions, in million EUR (base year 2012, present value) ... 33
Table 15: Economic effects on employment in person-years and in full-time equivalent employees on a country and regional basis ... 34
Table 16: Fiscal effects at national level for the three alternatives, in million EUR ... 35
Table 17: Overall economic effects due to measures, present values (only countries with large effects shown) ... 36
Table 18: Overall regional economic effects for Austria and Hungary due to measures, present values ... 37
Table 19: Average additional employment during operational phase (only countries with effects > 1 shown) ... 37
Table 20: Additional tax revenue (only countries with effects shown) ... 38
Table 21: Overview of emissions reduced by measures ... 39
Table 22: Present value of total positive effects of emission reductions in EUR ... 40
Table 23: Aggregation of results, View 1 (CBA Guide), in million EUR ... 46
Table 24: Aggregation of results, the perspective of the involved countries (variant A), in million EUR ... 46 Table 25: Aggregation of results, the perspective of the EU28 (variant B), in million EUR . 47
5 / 49
List of figures
Figure 1: project area and railway sections ...8
Figure 2: The project: Alignment of a new railway track Wulkaprodersdorf – Sopron (15.5 km) ... 12
Figure 3: Alignment of the new railway track Wulkaprodersdorf - Sopron (EWESO, 2000) . 13 Figure 4: Measures to be considered within the operational program ... 17
Figure 5: operational program 2020; railway connections/ hour (morning) ... 17
Figure 6: recommended organisational measures for Sopron railway station ... 18
Figure 7: Railway passenger traffic 2013 ... 23
Figure 8: Public transport (railway and busses) 2013 ... 23
Figure 9: Cumulated, discounted cash flows ... 30
Figure 10: Sum of minutes saved per day. Data source: TMC. ... 31
Figure 11: Discounted Environmental Effects in EUR over time ... 40
Figure 12: Shares of monetised emissions by emission types (before discounting) ... 41
6 / 49
1 Introduction
The project Sopron-Wulkaprodersdorf essentially consists of the straightening of the current route of the railway in this section, with a focus on avoiding very tight curve radii that prevent a qualitative and in terms of capacity better and faster rail link from Sopron to Eisenstadt and Vienna.
The pilot project „bankable paper“ for the upgrading of the line Sopron-Wulkaprodersdorf outlines the process necessary to implement a railway project in accordance with the requirements of the lending institutions (especially EU Funds, EIB).
Accordingly, this project contains:
the procurement and delivery of all data bases necessary for the evaluation
the results of a technical investigation to determine the investment costs
the results and methods for calculating the passenger potentials, as well as the traffic impact of the project (modal split) as part of a feasibility study
the methods and results of the evaluation
recommendations for the present project following the CBA guidelines (WP 6.4.2).
7 / 49
2 Context analysis and project objectives
2.1 Socio – economic context
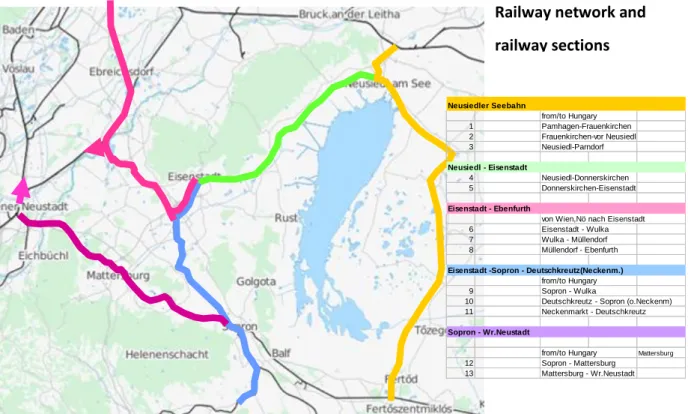
The study area covers the entire northern Burgenland region and was structured according to the rail sections mentioned below, for which the influence of measures on the Sopron- Wulkaprodersdorf section cannot be excluded. Consequently the sections are:
Eisenstadt –Sopron-Deutschkreuz (blue)
Eisenstadt-Ebenfurth/Wulkaprodersdorf-Wien (pink)
Sopron-Wr. Neustadt
were designated as the „core area“ of the study.
In 2013 the „core area” had a total population of around 75.000 people (total area:
150.000 inhabitants). With a growth rate of 11.3% from 2011 (the time of the last census) to 2013 the area of Eisenstadt-Ebenfurth has seen the highest population growth in the entire Burgenland region in this time frame. With approximately 8% the population increase in the area Sopron-Wulkaprodersdorf was only slightly smaller. Even the forecasted population growth rates (6% and 5.8%) will be significantly reduced from 2013 to 2020, the area of the two sections remains a very dynamic growth area. With the population growth the mobility needs of the population and the need for good public transport connections also increase, and commuting (professionals and students) plays a very important role in northern Burgenland. These commuters can be separated into:
Commuters from the municipalities of Burgenland (2013: 22.500 commuters from the communities of the „core area“)
Other Austrian commuters to major destinations in Burgenland (2013: 1.400 commuters to Eisenstadt)
The preliminary results of border cross survey (WU, TU Wien; KTI: EMAH Eco-mobility in the Austro-Hungarian border region, 2014) shows:
Commuters in traffic across the border at Klingenbach (cross-border commuters 2013: 14.400).. The cross-border traffic is expected to have approximately doubled in the last 7 years; the share of public transport is relatively low (around 15%). The most important centre of commuting in the „core area” is Eisenstadt (20.000 trips), Vienna (17.000 trips) and Wr.
Neustadt (7.500 trips).
All these people carry out around 60.000 trips per day
Given the situation of a continuing increase in commuting, especially high growth in cross- border traffic, the goals of the present project and of the transport policy of Burgenland are:
to improve the situation of public transport significantly through a sustainable improvement in transport services for railway transport
8 / 49
to raise the transport share of public transport significantly, particular for the fast growing cross-border traffic
to reduce the transport share of car traffic and thus traffic emissions in favour of public transport significantly
Figure 1: project area and railway sections
Source: TMC, 2014.
2.2 Definition of project objectives
The objectives of the project are primarily focused on the development of the railway, adjusted to regional traffic demand. In particular, the rapidly increasing border crossing traffic should be developed as a competitive alternative to private individual transport.
The objectives of the project can be summarised as follows:
Improvement of railways for regional passenger traffic
Development of railway as a competitive alternative to private individual transport for trans-border trips
Contribution to an integrated transport system
Improvement of regional accessibility
Improvement of effectivity of railway operation
Railway network and railway sections
Neusiedler Seebahn
from/to Hungary
1 Pamhagen-Frauenkirchen
2 Frauenkirchen-vor Neusiedl
3 Neusiedl-Parndorf
Neusiedl - Eisenstadt
4 Neusiedl-Donnerskirchen
5 Donnerskirchen-Eisenstadt
Eisenstadt - Ebenfurth
von Wien,Nö nach Eisenstadt
6 Eisenstadt - Wulka
7 Wulka - Müllendorf
8 Müllendorf - Ebenfurth
Eisenstadt -Sopron - Deutschkreutz(Neckenm.) from/to Hungary
9 Sopron - Wulka
10 Deutschkreutz - Sopron (o.Neckenm)
11 Neckenmarkt - Deutschkreutz
Sopron - Wr.Neustadt
from/to Hungary Mattersburg
12 Sopron - Mattersburg
13 Mattersburg - Wr.Neustadt
9 / 49
2.3 Consistency with EU and national frameworks
The following objectives are mentioned by the European Union in relation to regional transport (White Paper 2011):
Promotion of accessible, environmentally friendly transport services
The recognition and organisation of public transport
A change of modal shift towards public transport (art.31)
The Burgenland transport concept 2002 sets the following objectives for transport in Burgenland:
sustainable improvement of the international accessibility of Burgenland by road, rail and air traffic
ensure and improve the quality of life in Burgenland through sufficient environmentally and cost-efficient mobility of population and economy
securing the use of regional development opportunities that arise from expected changes in general conditions by site-specific, adequate transport services for freight and passenger transport
creation of the necessary transport infrastructure to enable optimum transport service for the implementation of regional and economic development programs in Burgenland
targeted mobility service in public transport, which is tailored to user groups and operationally optimised
The objectives of the project are consistent both with those of the EU as well as with the national transport planning. The objectives correspond to the definition of the project.
10 / 49
3 Project identification
The project should show specific properties in relation to the above mentioned objectives:
rail operations and the implementation of the transport policy objectives of the country. It should
allow a shortening of travel time, which makes it possible not only to implement the proposed symmetrical rail hub Eisenstadt, but also to install a symmetrical rail hub in Sopron
to enable an non existing transfer-free connection between Eisenstadt and Sopron
Accordingly it will be necessary
to improve the existing railway infrastructure (extension of existing railway infrastructure)
to significantly increase the capacity and allowable maximum line speed (increase railway capacity)
Functional type of investment
To identify accompanying measures for the realisation of optimal
connections between bus and train in order to take advantages of faster rail link through coordinated railway connections in the area (improved use of existing network(railway nodes)) and maximise the impact of accessibility improvement in regional traffic (improving accessibility for public transport)
The measures of the project should also help to reduce the operating costs of rail transport and the operating costs of infrastructure (decrease railway operation costs)
11 / 49
4 Technical Study and Feasibility study
For determining the capital cost of the project, one did fall back to the study EWESO which was adjusted accordingly. For the feasibility study one could fall back to the counts and forecasts of Statistics Austria, as well as to traffic counts (EMAH) which for the first time contain comprehensive information on the cross-border traffic
4.1 Technical Study
The EWESO study (RoeEE AG+HL AG: High-level rail link Wampersdorf-Eisenstadt-Sopron, Vienna 2000) was the basis of the estimation of investment costs. The object of investigation was the straightening of the route of the railway section Sopron- Wulkaprodersdorf.
Reference case (alternative 2020/0):
The situation (2020/0) in the section Sopron - Wulkaprodersdorf –(Ebenfurth) is considered as a reference case, according to the 2020 planned program of measures of Raaberbahn (situation of railway network according to the national planned measures) and the Austrian Federal Railways. Further it is assumed that the loop Eisenstadt is completed and Eisenstadt has been established as a symmetrical rail hub.
An explicit reference to measures of the international project SETA is not required, because the project is limited to regional passenger traffic only.
The identified, existing international passenger and freight services in SETA will be adopted.
12 / 49
4.1.1 Calculation of investment costs
Figure 2: The project: Alignment of a new railway track Wulkaprodersdorf – Sopron (15.5 km)
Source: TMC, 2014.
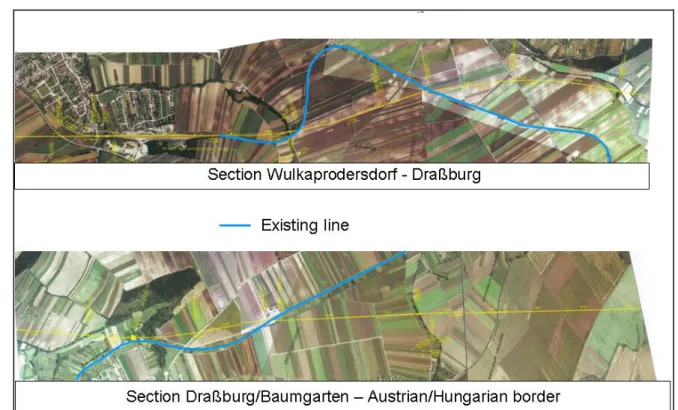
For the calculation it was possible to use maps in scale 1:25.000, as well as detailed descriptions of the site and the measures. From 5 possible routes alternatives the relatively close to existing route was used as the basis of assessment of the investment costs. In a first step it was necessary to reduce the cost parameters of a high-level rail link of the EWESO study to the appropriate extent of a railway with 120-160 km/h.
Subsequently the necessary path corrections as well as the length sections of the individual
„stages of construction“ and the labour costs necessary for the creation of these phases of construction were calculated in terms of costs according to unit values. The conditions applied for the individual sections are:
1. Section Wulkaprodersdorf-Sopron Deli (km 15,800-29,401) without Wulkaprodersdorf station
Single track section design, layout according to EWESO variant 5
Stop Drassburg/Baumgarten, single track Prerequisite:
Today´s system is maintained, intersections/nodes in Wulka (for maintenance of 2 platform edges, with a 3 edge or by means of signal protection solution, trains are handled from/to Eisenstadt)
Loop Eisenstadt is implemented in today´s planning
Route 195 Wulkaprodersdorf-Eisenstadt remains existing
13 / 49
Construction of new safety technology on the Raaberbahn, especially Wulkaprodersdorf under 7.MIP/8.MIP, services advertised and awarded in option
Extension of station Wulkaprodersdorf (2 tracks) for freight train crossings (scheduled for 8. MIP)
Construction of new platforms in Wulkaprodersdorf (scheduled for 8.MIP) 2. Rebuilding of railway station Wulkaprodersdorf
Measures required by SETA (extension platform at 400m, pedestrian tunnel, adaptation of safety technology
3. Section Neufeld-Müllendorf
Evasive track Steinbrunn + additional route block at km 112.0 4. Other conditions
V-increase between Wulkaprodersdorf and Müllendorf should be realised in 7th MIP (with construction of loop Müllendorf)
V-increase on the existing line Neufeld-Müllndorf should be realised in 7th MIP (with track renewal 2013/14)
Installation of protection signals in station Müllendorf for doubling(trains of Raaberbahn with trains from Eisenstadt)possible with new security technology
Track between Wulkaprodersdorf-Müllendorf-Neufeld remains existing, except evasive track Steinbrunn
Figure 3: Alignment of the new railway track Wulkaprodersdorf - Sopron (EWESO, 2000)
Source: TMC, 2014.
As a result of the cost estimate the following monetary expenses were calculated:
14 / 49 Table 1: Investment costs: Sopron – Wulkaprodersdorf - Ebenfurth
Source: TMC, 2014.
4.1.2 Calculation of infrastructure maintenance costs
In the area of the new line, state border – Wulkaprodersdorf, the unit rates of maintenance costs are expected to increase by 20%, as increased spending in maintenance will be expected due to a higher proportion of structural engineering /dams/cuts. The higher part of ETCS components and structural engineering will cause in an increase of renovation costs by 10%. In these increases the higher train density was taken into account. In the area of the existing line Wulkaprodersdorf-Neufeld/Leitha growing of of maintenance costs by 10% is expected, due to 3 tracks at evasion Steinbrunn. Renovation costs in this section was increased by 5% (ETCS components at evasion Steinbrunn). These increases also take into account the higher train density of alternative 2020/1.
SECTIONS Costs EUR
Section Neufeld- Müllendorf 26.385.000
Section Bahnhof Wulkaprodersdorf 8.200.000
Section Wulkaprodersdorf- Hst. Drassburg/Baumgarten 32.279.865
Section Hst. Drassburg/Baumgarten 640.000
Section Hst. Drassburg/Baumgarten- Staatsgrenze 22.758.965
ZWISCHENSUMME Abschnitt Sopron- Wulkaprodersdorf Übergreifend 16.904.200
Section Staatsgrenze- Sopron Deli 17.761.170
Section Sopron Deli 200.000
Section Sopron Deli- Bf. Sopron 200.000
Total 125.329.200
Investment costs: route straightening Sopron -
Wulkaprodersdorf - Ebenfurth
15 / 49 Table 2: Infrastructural and maintenance costs
Source: TMC, 2014.
4.1.3 Calculation of network operation costs
In the area of network operating between Neufeld/Leitha and the state border (Austria) the Raaberbahn‘s total costs of network operation were determined based on the known number of dispatchers and overhead personnel in Wulkaprodersdorf. Restructuring in the field of dispatchment in Wulkaprodersdorf resulting out of the merger of the dispatchments of NSB+Roee as well as the automatisation (ARAMIS etc.) and the resulting estimated savings equalling 600.000 EUR by 2025 have been considered. In the area of network operating between Sopron Deli and the state border, the dispatch administration that provides service in Sopron is therefore responsible for the entire route Sopron- Neufeld/Leitha was considered.
16 / 49 Table 3: Network operation costs
Source: TMC, 2014.
Network operation costs for the new line are calculated to be 33% cheaper than for the
„old“ line.
4.2 Railway operational program
The current transport service for rail transport is dominated by the system of symmetrical hub nodes in Neusiedl and Wulkaprodersdorf, which means that a change at this node is possible in both directions by the simultaneous arrival of all trains. As Eisenstadt is currently not a hub node, no continuous change-free connections between Sopron and Eisenstadt are possible, which – given the short distance (appr. 17km) - already represents a significant disadvantage for users. The infrastructural measures in this field will cause a significant improvement in this area as well. In a future operating program the following pints need to be considered:
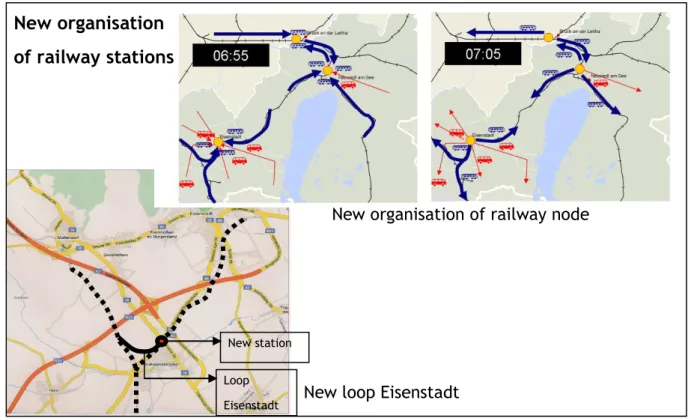
the planned start of loop Eisenstadt in 2015
the then planned implementation of a symmetrical hub node in Eisenstadt and the orientation of the urban and regional bus traffic to the hub node (the impact of the measure on the use of the railway was not included in the calculation)
17 / 49 Figure 4: Measures to be considered within the operational program
Source: TMC, 2014.
As a main organizational measure a change in the operating program is to be provided, which schedules direct connections between Sopron and Eisenstadt. This program was technically rated as feasible. The concept schedules a ½ hour hub at weekday morning peak hour to Eisenstadt, Vienna and on the track Sopron-Wr. Neustadt also a ½ hour hub to Wr. Neustadt
Figure 5: operational program 2020; railway connections/ hour (morning)
Deutschkreutz
Wulkaproders dorf
Sopron
Eisenstadt
Matters- Wr.Neustadt burg
Müllendorf Ebenfurth
Wien
Neusiedl Donnersk.
Frauenk.
Bruck/Ll
Pamhagen.
Symmetric railway node
Deutschkreutz
Wulkaproders dorf
Sopron
Eisenstadt
Matters- Wr.Neustadt burg
Müllendorf Ebenfurth
Wien
Neusiedl Donnersk.
Frauenk.
Bruck/Ll
Pamhagen.
Symmetric railway node
Source: TMC, 2014.
New station Wulkaproder dorf Loop
Eisenstadt New loop Eisenstadt (2015)
New organisation of railway node Eisenstadt
New organisation of railway stations EISENSTADT
18 / 49
In addition to these organizational measures a significant improvement of the access road to Sopron station should be envisaged. The reduction in travel time between Eisenstadt and Sopron should allow to set up the train station as an important public transport centre and to establish a link with the urban and regional bus services not only in Eisenstadt but also in Sopron. Also the installation of a P+R car park at Szombathely railway station shall be provided (currently there are only limited parking zones). Under these conditions modal split in rail transport can be achieved which are substantially higher than those that were calculated in the traffic forecast (where such measures were not considered).
Figure 6: recommended organisational measures for Sopron railway station
Source: TMC, 2014.
As a result of the calculations from the operating program the numbers of required passenger trains were used as the basis for determining the operation costs for rail traffic, as well as the calculation of the revenue from the infrastructure access fee.
Table 4: Operation costs of rail operation and infrastructure revenues
Operation costs of rail operations
Infrastructure revenues (access charge)/year (EUR)
Number of trains (additive to 2013)
operation costs/year (EUR)
Alternative 2020/0 4 947.000 374.665
Alternative 2020/1 10 2.108.000 936.663
Source: TMC, 2014.
Sopron railway station stationstation
Organisation of direct trains HU-AT without changing the train New organisation of railway stations: SOPRON
Urban and regional bus node Park-and Ride
Ride
19 / 49
4.3 Feasibility Study
The aim of the feasibility study is to estimate on the one hand the transport potential and its future development, and on the other hand to provide all data bases for the evaluation of the measures (quantity structure). Accordingly, as part of the feasibility study, the following steps were carried out:
Calculation of transportation demand (existing, transportation forecast)
Calculation of impact of measures on modal shift (reduction of no. of cars)
Operation program (number of trains, schedule density) additional organisational measures and calculation of operational costs of railway operation
Calculation of infrastructure revenues (access charges)
Calculation of revenues from passenger tariffs 4.3.1 Calculation of transport demand
First of all, the project will bring benefits to regional traffic. Based on the available data it is not possible to detect all weekday traffic purposes in regional traffic. During rush-hour traffic and school transport sufficient data bases are available for transport purposes, but there is almost a complete lack of information concerning weekday traffic purposes such as:
leisure traffic
shopping transport
business trips
purchases
visitor traffic
This is disadvantageous as around 50% of traffic concerns private transport trips and trips for extracurricular purposes. In public transport these trips play a subordinate role, not more than 20% of public transport journeys are be undertaken outside profession or education. (Amt der oö.Landesregierung: Oö. Verkehrserhebung 2001, Linz 2004; BMVIT:
Verkehrsprognose Österreich 2025+; Wien 2009))
It can therefore be assumed for calculation purposes that the restriction to work and school traffic is able to reproduce the general capacity requirements of trains and buses in regional weekday traffic.
A further restriction was made regarding the objectives. Rail services do not usually operate mostly short distance traffic, transport over medium and large distances are the
„principal market“ for trains in regional passenger traffic. This is also confirmed by the analysis of target traffic at rush hours 2011 (WU, TU Wien; KTI: EMAH Eco-mobility in the Austro-Huangarian border region, 2014)
for the 32% of the entire rush-hour traffic of the study area (northern Burgenland) the destination is Vienna, in rail transport however 87%
Eisenstadt was the destination for 19% of commuters , in railway traffic only for 2%
20 / 49
Wr. Neustadt was the destination for 8.7% of commuters from the northern Burgenland, in railway traffic only for 2.5%
The Hungarian centres Sopron and Mosonmagyarovar are destinations of Burgenland commuters. However, reliable figures are not available.
In total the three centres of Vienna, Eisenstadt and Wr. Neustadt represent the main destinations for around 60% of all trips of Burgenland commuters, but for 91.5%! of the railway trips: To capture almost all train journeys it is sufficient to restrict the commuter destinations within the origin-destination-matrix of journeys in rush-hour traffic and student traffic on the following three destinations:
Vienna
Eisenstadt
Wr. Neustadt
Cross-border weekday passenger traffic is of great importance for the traffic volume in northern Burgenland. There are first preliminary results from the ETZ-project EMAH:
project for eco-mobility in the Austrian-Hungarian border region (2012-2015) on cross- border passenger transport. At the border crossing Klingenbach in 2013 approximately 30.000 daily trips were conducted, of which:
53% had the destination Vienna
29% Wr.Neustadt and Vienna-surrounding areas
22% Eisenstadt
This traffic has increased rapidly for Hungarian workers with the opening of the labour market in Austria 2011. Continuing traffic growth – although not to the same extent as in the past 7 years (in this time the cross-border traffic is expected to have approximately doubled) can be expected by 2020.
The cross-border traffic flows are handled mainly by car. Railway accounts for only around 15% of cross-border traffic. This is due to the given relatively long distance to Vienna and basically well-developed rail traffic destinations Wr. Neustadt and (to a lesser extent) Eisenstadt, an surprisingly low value.
In comparable relations (Seewinkel-Vienna), the traffic split of rail is around 45%.
4.3.2 Development of regional traffic
The development of traffic in regional transport is dominated by the development of commuting. It is based on
The development of the resident population, in particular the labour force (or employment) based on the population forecast ÖROK (Austrian
Conference on Spatial Planning: Small area population forecast for Austria from 2010 to 2030, Vienna 2010)
in the entire study area, the population will increase by 3.5% from 2010- 2030
the number of workers on the other hand increases only by 2.3%
21 / 49
due to the fact that the community of commuters make up an ever increasing share of the labour force, the number of commuters will increase by approximately 4.9%
The development in cross-border traffic is hard to assess - it was therefore assumed that the growth is in line with the average development rates of Austrian commuting. This is a very conservative estimate in relation to developments so far.
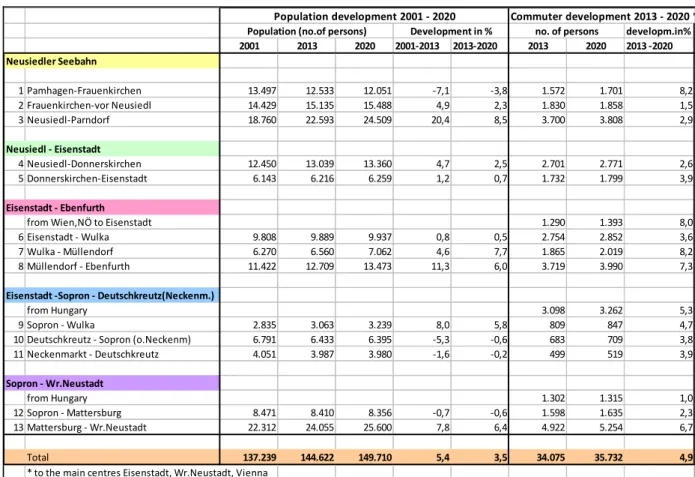
Table 5: Population development and development of commuting 2013 – 2020
Commuter development 2013 - 2020 * developm.in%
2001 2013 2020 2001-2013 2013-2020 2013 2020 2013 -2020
Neusiedler Seebahn
1 Pamhagen-Frauenkirchen 13.497 12.533 12.051 -7,1 -3,8 1.572 1.701 8,2
2 Frauenkirchen-vor Neusiedl 14.429 15.135 15.488 4,9 2,3 1.830 1.858 1,5
3 Neusiedl-Parndorf 18.760 22.593 24.509 20,4 8,5 3.700 3.808 2,9
Neusiedl - Eisenstadt
4 Neusiedl-Donnerskirchen 12.450 13.039 13.360 4,7 2,5 2.701 2.771 2,6
5 Donnerskirchen-Eisenstadt 6.143 6.216 6.259 1,2 0,7 1.732 1.799 3,9
Eisenstadt - Ebenfurth
from Wien,NÖ to Eisenstadt 1.290 1.393 8,0
6 Eisenstadt - Wulka 9.808 9.889 9.937 0,8 0,5 2.754 2.852 3,6
7 Wulka - Müllendorf 6.270 6.560 7.062 4,6 7,7 1.865 2.019 8,2
8 Müllendorf - Ebenfurth 11.422 12.709 13.473 11,3 6,0 3.719 3.990 7,3
Eisenstadt -Sopron - Deutschkreutz(Neckenm.)
from Hungary 3.098 3.262 5,3
9 Sopron - Wulka 2.835 3.063 3.239 8,0 5,8 809 847 4,7
10 Deutschkreutz - Sopron (o.Neckenm) 6.791 6.433 6.395 -5,3 -0,6 683 709 3,8
11 Neckenmarkt - Deutschkreutz 4.051 3.987 3.980 -1,6 -0,2 499 519 3,9
Sopron - Wr.Neustadt
from Hungary 1.302 1.315 1,0
12 Sopron - Mattersburg 8.471 8.410 8.356 -0,7 -0,6 1.598 1.635 2,3
13 Mattersburg - Wr.Neustadt 22.312 24.055 25.600 7,8 6,4 4.922 5.254 6,7
Total 137.239 144.622 149.710 5,4 3,5 34.075 35.732 4,9
* to the main centres Eisenstadt, Wr.Neustadt, Vienna
Population development 2001 - 2020
Population (no.of persons) Development in % no. of persons
Source: Statistik Austria, TMC, 2014.
22 / 49
4.3.3 Transportation demand by means of transport
Based on statistical surveys and forecasts the modal choice for the most important centres by mode of transport for the „core area” and the entire study area were calculated:
Recent situation (2013)
Table 6: Calculation of daily trips to the main centres by means of transport 2013 for the whole project area and the
“Core Area”)
Source: TMC, 2014.
If we restrict ourselves to the results of the core area it can be seen that the main destination for commuters and students is the capital of Burgenland – Eisenstadt. Only second is the dominant commuter destination for northern Burgenland, Vienna. The dominant transportation is by car. Currently the train only plays an important role with respect to driving to Vienna. For trips to Eisenstadt the railway in total plays only a minor role (see Table 6). This is an indication that the rail links to Eisenstadt are not particularly attractive. The traffic load of trains in both regional passenger rail lines shows the relatively high importance of the line Sopron-Ebenfurth in the execution of trips to Vienna.
The entire public transport load also makes it quite clear, that the bus has a very high importance in the daily traffic of Burgenland. However, cross-border bus services do not exist. Thus, the railway remains the only efficient means of public transport.
23 / 49 Figure 7: Railway passenger traffic 2013
Railway passenger traffic 2013
(trips per day and direction)
Border crossing passenger traffic 2013
Total : 3.262 Motocar 2.431 (75%) Railway 831 (25%)
Total : 1.302 Motocar 930 (71%) Railway 372 (29%)
Railway passenger traffic 2013
(trips per day and direction)
Border crossing passenger traffic 2013
Total : 3.262 Motocar 2.431 (75%) Railway 831 (25%)
Total : 1.302 Motocar 930 (71%) Railway 372 (29%)
Source: TMC, 2014.
Figure 8: Public transport (railway and busses) 2013
Public transport (railway, busses) passengers 2013
(trips per direction; shown on road network)
Public transport (railway, busses) passengers 2013
(trips per direction; shown on road network)
Source: TMC, 2014.
24 / 49
4.3.4 Development 2013 - 2020
The development of traffic is closely linked with the development of commuting. For 2020 the alternative 0 is also the reference case, which only includes those measures provided for in the existing development plans up to 2020, and thus no major infrastructure projects. Between 2013 and 2020 the traffic in the area of the „core zone” to the selected centres will grow at different heights:
Journeys to Eisenstadt will increase by about 1.300 trips, an increase of 6.2%
Increase of journeys to Vienna will be lower, 900 additional trips means an increase of 4.9%
The highest increase of journeys is expected to Wr. Neustadt, 530 additional trips represent an increase of 7%
In the choice of transport mode, trips in private transport may increase at a total of about 1800; in modal split little will change however.
Table 7: Calculation of daily trips to the main centres by means of transport 2010/0 for the whole project area and the
“Core Area”)
Source: TMC, 2014.
4.3.5 Impact of project measures on choice of transport mode
The traffic model VISA calculates the impact of measures on the choice of transport and on the rides induced by the measures. Key measures that have been taken into account in the calculation were (alternative 2020/1):
The reduced travel time by the measures in the railway traffic. For all ongoing rail connections on the line Sopron-Wulkaprodersdorf the travel time improved by about 10 minutes.
The introduction of a direct connection Sopron-Eisenstadt and better transport links in the feeder traffic to the Sopron train station. With the loop Ebenfurth (2020) the travel time will be reduced by a further 7 minutes, which is particularly important for trips to Vienna. To this extent
25 / 49
the calculated rides reflect a minimum of the effects of the measures.
Induced trips were calculated in the first place to Eisenstadt at around 1.200 additional trips. Clear is the increase in rail traffic:
for the „core area an increase of 3.500 daily trips in rail traffic was calculated as a result of the above measures, which would mean an increase of rail transport in the „core area“ by 44% (!)
the main part of this increase can be expected in the traffic to/from Eisenstadt. The travel time savings of around 10 minutes and 2 through train connections per peak hour would increase the train rides to
Eisenstadt by about three times, train rides to Vienna would increase by 27%, those to Wr. Neustadt by 14%. Accordingly a reduction of car traffic would be expected by around 6%. Small losses would also be expected in bus traffic.
Table 8: Calculation of daily trips to the main centres by means of transport 2020/1 for the whole project area and the
“Core Area”)
Source: TMC, 2014.
26 / 49 Table 9: Daily passenger trips: difference 2013 -2020/0 – 2020/1 by means of transport (Source: TMC 2014)
-1.500 -1.000 -500 0 500 1.000 1.500 2.000 2.500
2013-2020/0 2020/0-2020/1
car bus railway other car bus railway other car bus railway other
E I S E N S T A DT W R . N E U S T A D T W I E N
DIFFERENCIES OF DAILY PASSENGER TRIPS FOR MAIN DESTINATIONS 2013 - 2020/0 - 2020/1 BY MEANS OF TRANSPORT
Source: TMC, 2014.
4.3.6 Tariff revenues
As a result of changes in the modal choice and the expected increase in rail traffic the tariff revenues that are generated by these additional rides can be roughly calculated.
Subsidies and tariff subsidies were not considered. Basis of calculation was the zone classification of the tariff group Eastern Region (VOR). As different time cards are offered for the weekday traffic, an allocation of these time cards had to be the basis for calculation, namely:
45% of all travellers in regional transport use yearly network cards
30% a monthly pass
20% a weekly ticket
5% pay the full price
27 / 49 Table 10: Calculation of tariff revenues
Source: TMC, 2014.
From this calculation result additional annual tariff revenues of around EUR 3 million 4.3.7 Reduction of road traffic
The calculation of reduction in road transport (reduction of traffic performance) by private car traffic is based on a simple formula:
The calculated reduction in the mileage is around 18 million vehicle kilometres/year
28 / 49 Table 11: Calculation of road traffic reductions (TMC, 2013)
car capacity (km*nr.of cars)/year
2013 2020/0 2020/1
Neusiedler Seebahn
from/to Hungary
1 Pamhagen-Frauenkirchen 16.541.857 17.885.534 17.885.534
2 Frauenkirchen-vor Neusiedl 15.870.897 16.096.420 16.096.420
3 Neusiedl-Parndorf 25.949.766 26.617.683 26.617.683
Neusiedl - Eisenstadt
4 Neusiedl-Donnerskirchen 21.580.667 22.137.707 22.137.707
5 Donnerskirchen-Eisenstadt 8.393.375 8.704.027 8.704.027
Eisenstadt - Ebenfurth
von Wien,Nö nach Eisenstadt 21.212.550 22.909.554 20.506.389
6 Eisenstadt - Wulka 11.626.333 12.028.868 10.850.653
7 Wulka - Müllendorf 7.727.230 8.272.956 7.673.405
8 Müllendorf - Ebenfurth 14.973.028 15.902.547 15.179.057
Eisenstadt -Sopron - Deutschkreutz(Neckenm.)
from/to Hungary 32.803.750 34.534.788 26.075.568
9 Sopron - Wulka 5.408.355 5.644.607 5.195.438
10 Deutschkreutz - Sopron (o.Neckenm) 6.550.987 6.819.049 5.926.407
11 Neckenmarkt - Deutschkreutz 6.878.811 7.124.692 6.759.654
Sopron - Wr.Neustadt
from/to Hungary Mattersburg 17.427.630 18.585.525 17.512.950
12 Sopron - Mattersburg 11.512.819 11.736.779 10.974.118
13 Mattersburg - Wr.Neustadt 32.252.940 34.071.808 32.388.957
256.710.995 269.072.543 250.483.967
Difference 18.588.576
Calculation of road capacity (passenger traffic)
Source: TMC, 2014.
29 / 49
5 Financial Analysis
5.1 Methodology
An important part of the evaluation is the financial analysis. This analysis is explained in detail in the methodological section in Work Package 5.3 (Evaluation of SETA measures) of this project. The financial analysis follows the recommendations contained in the “Guide to cost benefit analysis of investment projects”.
The main output of the financial analysis is
the FNPV (financial net present value) and
the FIRR (financial rate of return).
5.2 Necessary data
Following data are necessary for evaluation:
1. Estimation of investment costs (alternative 2020/1)
2. Estimation of infrastructure maintenance costs for the Business as Usual (BAU) scenario (without the project under evaluation – alternative 2020/0) and for the project scenario (with the project under evaluation – alternative 2020/1)
3. Estimation of network operation costs for the alternatives 2020/0 and 2020/1
4. Estimation of operation costs of rail operations for the alternatives 2020/0 and 2020/1
5. Estimation of tariff revenues for the alternatives 2020/0 and 2020/1 6. Real discount rate: 5%1
These data are presented in this chapter, parts 4.1 to 4.3.
5.3 Calculations
In order to analyse the effects of the investment (only in alternative 2020/1), the differences between the scenarios of 0 and 1 are of main importance. Thus, the differences in the costs and revenues are taken in account. The financial analysis includes a sensitivity analysis, which checks the stability of results when distinctive input parameters are changed. A sensitivity analysis was performed for the “critical” inputs, namely O&M and infrastructure fees. Like in the report for Work Package 5.3 (Evaluation of SETA measures) in the first sensitivity analysis scenario (SeAn A) a reduction of infrastructure maintenance costs, network operation costs and operation costs of rail operations by 20% is assumed; in the second sensitivity analysis scenario (SeAn B) an increase in infrastructure usage fees and tariff revenues is assumed additionally.
1 In the “Guide to Cost Benefit Analysis of Investment Projects” from EU DG Regional Policy (2008), a real financial discount rate of 5% is recommended.
30 / 49 Figure 9: Cumulated, discounted cash flows
Source: TMC & IHS, 2014.
None of the scenarios, the base financial scenario (base FiAn), the first (SeAn A) and second sensitivity analysis scenario (SeAn B), succeed in reaching a positive FNPV. The results are as follows:
Table 12: Results of dynamic investment analysis, financial base scenario, in Mio. €
FNPV FIRR
Financial Anaylsis -52,7 -3,9%
Sensitivity Analysis A -50,2 -3,7%
Sensitivity Analysis B -36,6 -2,6%
Source: TMC & IHS, 2014.
5.4 Results of the financial analysis
The results of the financial analysis are only one aspect of the decision on the realisation of the suggested measures. The results of the economic and environmental evaluations are an equally important factor in the recommendations. From an isolated financial-analysis perspective, the realisation of the suggested measures can not be recommended.
31 / 49
6 Savings in travel time 6.1 Methodology
The calculations presented in this chapter are in line with the EU Guideline on Cost-Benefit Analysis2, which outlines the process of monetising travel-time savings. Table 13 summarises the necessary assumptions made.
Table 13: Assumptions for monetization of travel time savings
Assumption Explanation
Composition of travellers 70% short-distance commuters
20% other non-work short distance
10% business trips
Total hourly rate As cross-border commuters, the average of Austrian and Hungarian hourly values was taken:
EUR 10.72 (in 2012, adjusted for inflation, based on assumption of composition of travellers. Values based on HEATCO 3).
(working) days per year 300 days (i.e. excluding Sundays)
Social Discount Rate 4%, as trans-border personal transport between Austria (CBA suggestion 3.5%) and Hungary (5.5%)
Source: IHS – Institute for Advanced Studies, 2014.
6.2 Results
Figure 10: Sum of minutes saved per day. Data source: TMC.
Figure 10 gives an overview over total daily travel time savings in minutes by origin/destination. Given the here presented reductions in travel time and the above
2 Commission 2008
3 Source for rates: HEATCO (Bickel et al. 2006)
32 / 49
described assumptions, the total present value in 2012 (in 2012 prices) of monetised travel time savings for the period 2020-2049 amounts to EUR 14.945 million.
33 / 49
7 Short-term economic effects 7.1 Methodology
An input-output analysis, among other methods, was used as an instrument to quantify the short- and medium-term economic effects. This analysis and the necessary input-output tables are explained in detail in the methodological section in Work Package 5.3 (Evaluation of SETA measures) of this project. Since this method should be applied not only at the national level but also at the regional level, a (multi-)regionalisation of the existing national input-output tables – provided by the national statistics offices – was required.
7.2 Results
The results of the multi-regional input-output model analysis will be presented for the two countries involved – Austria and Hungary. The resulting economic effects - divided into value added, employment (in person years and full-time equivalents) and taxes - are included for each country. These results include both one-time effects (such as investments) and durable effects (such as maintenance and operating costs). In each case, the impact on the economies of the individual regions and the country itself is reported.
In the following subsection the short-term effects of the investment expenses as well as the effects of the induced changes in maintenance and operating expenses are reported explicitly for each country and their respective regions.
Caution is required in the interpretation of the effects on labour, since the time range of the investment stretches over several years. Thus, “person-years” are calculated as the number of employed persons multiplied by the duration of employment in 2015 to 2049.
The effects occur mainly in the investment phase.
Table 14 to Table 16 illustrate the results of the economic input-output analysis.
Table 14: Economic effects on value added in countries and regions, in million EUR (base year 2012, present value)
Burgenland 49.91
other regions 31.19
Austria 81.10
Nyugat-Dunántúl 11.12 other regions 5.51
Hungary 16.63
"EU26" 43.14
EU28 140.87
Rest of the world 15.31
World 156.18
Value added in million EUR
Source: IHS – Institute for Advanced Studies, 2014.
Table 14 shows the value added effects for the three quantified alternatives for all involved countries and their regions as well as for the “EU26” countries (EU Member States