Essays on Informational Efficiency in Real Estate Markets
Dissertation zur Erlangung des Grades eines Doktors der Wirtschaftswissenschaft
eingereicht an der Fakultät für Wirtschaftswissenschaften der Universität Regensburg
vorgelegt von: Johannes Braun
Berichterstatter: Prof. Dr. Wolfgang Schäfers Prof. Dr. Stephan Bone-Winkel
Tag der Disputation: 11.11.2020
Essays on
Informational Efficiency
in Real Estate Markets
Table of Contents
List of Tables ... VII List of Figures ... IX
1 Introduction ... 1
1.1 Background and Motivation ... 1
1.2 Research Questions ... 3
1.3 Co-Authors, Submissions and Conference Presentations ... 5
1.4 References ... 7
2 On the Predictive Potential of Investor Sentiment: A Deep-Learning Approach 9 2.1 Abstract ... 9
2.2 Introduction ... 11
2.3 Literature Review ... 13
2.3.1 Text-Based Sentiment Analysis in Finance ... 13
2.3.2 Sentiment Analysis in the Realm of Real Estate ... 14
2.4 Data ... 16
2.4.1 Seeking Alpha ... 17
2.4.2 S&P News Database ... 17
2.4.3 Direct Market Return and Macroeconomic Controls ... 18
2.5 Methodology ... 19
2.5.1 Artificial Neural Network ... 19
2.5.1.1 Text Pre-Processing ... 21
2.5.1.2 ANN Training and Validation ... 22
2.5.2 Econometric Approaches ... 25
2.5.2.1 Vector Autoregression ... 26
2.5.2.2 Markov-Switching ... 27
2.5.2.3 Logit Model ... 28
2.5.2.4 Forecast Evaluation ... 30
2.6 Results ... 30
2.6.1 Linking Sentiment to Market Returns ... 31
2.6.2 Accounting for Market Regimes ... 35
2.6.3 Binary Return Forecasts ... 40
2.6.4 Synopsis ... 44
2.7 Conclusion ... 45
2.8 References ... 47
3 Artificial Intelligence, News Sentiment, and Property Market Liquidity ... 53
3.1 Abstract ... 53
3.2 Introduction ... 55
3.3 Literature and Motivation ... 57
3.4 Data and Methodology ... 60
3.4.1 Sentiment Index ... 61
3.4.2 Liquidity Proxies ... 65
3.4.3 Control Variables ... 66
3.5 Regression Analysis ... 67
3.6 Results ... 69
3.7 Conclusion ... 73
3.8 Appendix ... 75
3.9 References ... 77
4 REIT Property Development and Stock Price Crash Risk ... 81
4.1 Abstract ... 81
4.2 Introduction ... 83
4.3 Literature Review and Research Motivation ... 85
4.4 Data Sources and Variable Construction ... 89
4.4.1 Sample Selection ... 89
4.4.2 Development Activity ... 90
4.4.3 Crash Risk Measures ... 91
4.4.4 Control Variables ... 92
4.4.5 Summary Statistics and Correlations ... 93
4.5 REIT Property Development and Crash Risk: Empirical Analysis ... 95
4.5.1 Research Design and Results ... 95
4.5.2 Robustness Tests ... 99
4.6 REIT Development Activity: Relationship to Managerial Myopia ... 103
4.7 Conclusion ... 108
4.8 References ... 110
5 Conclusion ... 115
5.1 Executive Summary ... 115
5.2 Final Remarks and Opportunities for Further Research ... 119
5.3 References ... 121
List of Tables
Table 2.1: Descriptive Statistics ... 19
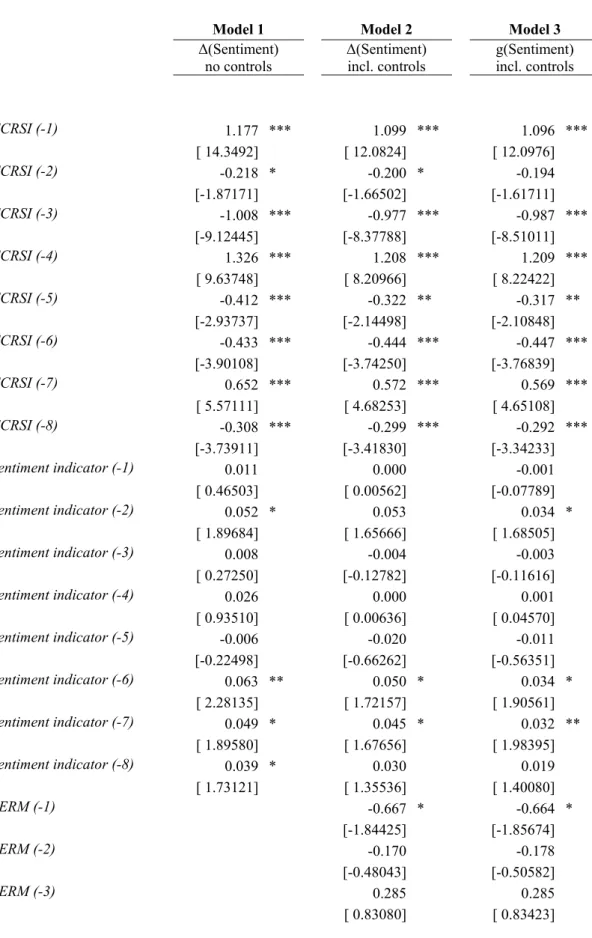
Table 2.2: VAR Estimation Results ... 32
Table 2.3: Markov-Switching Model Estimations ... 35
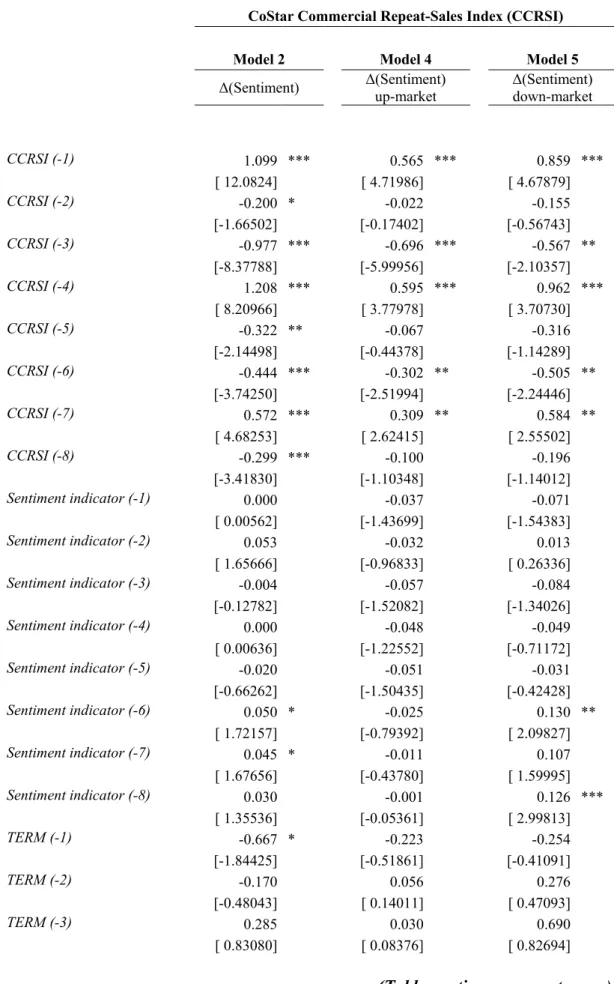
Table 2.4: VAR Estimation Results in Up- and Down-Market Periods ... 38
Table 2.5: Logit Estimation Results ... 41
Table 2.6: Forecast Performance ... 43
Table 3.1: Descriptive Statistics ... 67
Table 3.2: Liquidity - Sentiment: Autoregressive Distributed Lag Models ... 69
Table 3.3: Liquidity - Sentiment: ARDL Models with Alternative Liquidity Measures ... 75
Table 4.1: Summary Statistics and Correlation Matrix ... 94
Table 4.2: REIT Stock Price Crash Risk - Development Activity (Main Model) ... 97
Table 4.3: Robustness Tests, REIT Stock Price Crash Risk - Development Activity 99 Table 4.4: REIT Earnings Management - Development Activity ... 107
List of Figures
Figure 2.1: S&P News Distribution over Study Period ... 18
Figure 2.2: Basic Structure of an Artificial Neural Network ... 21
Figure 2.3: Temporal Progression of the SI ... 25
Figure 2.4: Markov-Switching - Filtered Probabilities ... 36
Figure 2.5: In-Sample Probability Forecast for Market Return Directions ... 42
Figure 2.6: Out-of-Sample Forecasting Performance ... 44
Figure 3.1: ANN Layout ... 63
1 Introduction
1.1 Background and Motivation
At the latest since the global financial crisis of 2007-08, the informational efficiency of real estate markets has received a remarkably high level of public attention. The bursting of the US housing bubble as the trigger of the crisis and the temporary downward pressure on all forms of real estate investments in the aftermath, raised various questions as to the degree of susceptibility to agency problems and the extent of sentiment-driven transactions in the markets. This thesis therefore seeks to shed light on two contrasting aspects related to informational efficiency in real estate markets: The first part deals with an example of the role played by noise in the market, the second part with an example of the withholding of information from the market.
With regard to the impact of noise on market efficiency, direct real estate markets represent a particularly interesting and important research field. Many shortcomings that prevail in the comparatively efficient stock market are likely to be aggravated in the context of physical properties. Short-sales required for arbitrage in phases of market exuberance are not feasible in practice, due to the diversity of the traded assets and the lack of exchanges. Transaction- and information costs in distinct, highly segmented property markets are furthermore significantly higher than those in stock markets, thereby further limiting the potential for arbitrage.
Over the course of the last decades, several studies analyzing the effects of noise- traders and their sentiment-driven transaction activity on direct property markets have been published. A crucial element of such studies lies in the definition of market sentiment. While traditional proxies mainly relied on surveys (see e.g. Clayton, Ling and Naranjo, 2009; or Das, Freybote and Marcato, 2015), sentiment analysis has shifted towards the use of text-based indicators in more recent years. The advantages compared to traditional sentiment measures include the high frequency of available data, the low data collection cost and -effort compared to survey-based measures, and the relative directness of the news-based measures, possible through a preselection of suitable news sources. Several more recent studies in the real estate field thus make use of news-based sentiment measures (see e.g. Walker, 2014; or Ruscheinsky, Lang and Schäfers, 2018). These studies have in common the application of predefined sentiment dictionaries, i.e. psychology-based wordlists, indicating sentiment-polarity
on a word-to-word basis for the text in question. Despite their advantage of easy applicability, dictionaries inevitably rely on a set of predefined rules and thus lack the ability to identify complex linguistic patterns in texts. Hausler, Ruscheinsky and Lang (2018) take this limitation into account by applying a support-vector-machine (SVM) framework for the classification of news headlines. To train the SVM, Hausler, Ruscheinsky and Lang manually classify a training data set. This practice is common for machine-learning-applications, but is once again time-consuming and subjective with respect to the assignment of news to different sentiment classes.
The central objective of the first two papers of this thesis is therefore to develop a sentiment measure for the real estate market which overcomes the fundamental limitations of existing ones. The approach utilizes an artificial neural network to classify news articles on the US real estate market. The classification process however, refrains from any manual classification, but instead makes use of a large sample of texts with distinct sentiment-polarity, so as to train the network via distant supervision.
The constructed sentiment index is employed to make predictions regarding the US direct commercial property market in terms of returns (Paper 1) as well in terms of trading liquidity (Paper 2). The chosen approach contributes to the literature in two ways. First, sentiment research gains from the development of a sentiment measure which fully capitalizes on the benefits of deep-learning, through the complete elimination of human intervention in the classification process. Furthermore, the approach provides new insights into several aspects of the efficiency of property markets by analyzing their susceptibility to noise trading and sentiment.
The second component of the thesis deals with the somewhat converse problem of information which is not available publicly. Possibly inspired by several high-profile accounting scandals at the beginning of the century, Jin and Myers (2006) presented a theory on the mechanisms behind such firm crises and the subsequent crashes in stock price. According to Jin and Myers, firm managers are able to absorb some of the negative information on the firm due to an information asymmetry between management and shareholders. The reasons for such bad news hoarding can be manifold, most obvious are perhaps attempts to secure the own job. However, when the accumulated bad news reaches a certain threshold, Jin and Myers argue that the incentives to continue the hoarding disappear, leading to a sudden release of a bulk of negative information into the market. The effect can be a crash in the firm’s stock price.
Listed real estate firms provide several peculiarities worth subjecting to an empirical test of Jin and Myers’ theory. This thesis selects one of them, namely the opportunity for equity REITs to develop their own properties, and analyzes the relationship to stock price crash risk. The particular relevance of this aspect stems from the fact that property developments are one of only a few opportunities for REITs to circumvent the current lows in capitalization rates and thereby to maintain growth. To the best of the author’s knowledge, the analysis is the first to examine the REIT business model with regard to its effect on the company’s stock price crash risk. The analysis thus contributes to a better understanding of the risk structure of real estate development in the context of equity REITs, and by doing so, to answering the question of whether REIT property-development activity is desirable from an investor perspective.
1.2 Research Questions
The following section provides a short overview of the research questions relevant for each of the papers. While all three papers circle around the central topic of informational efficiency in real estate markets, each addresses several distinct aspects of the general problem field.
Research Questions, Paper 1:
“On the Predictive Potential of Investor Sentiment: A Deep-Learning Approach”
• Are direct property market transaction prices influenced by sentiment-driven (‘noise’) traders?
• Can deep-learning algorithms contribute to the estimation of real estate market sentiment?
• Can distant supervision replace the manual classification of news-documents necessary for the construction of the deep-learning-based indicator?
• Can the deep-learning-based sentiment indicator explain direct property- market index movements?
• Does news-based sentiment exert a distinct impact on property index returns in up- and down-markets?
Research Questions, Paper 2:
“Artificial Intelligence, News Sentiment, and Property Market Liquidity”
• Do sentiment-driven (‘noise’) traders exercise a significant influence on direct property market liquidity?
• Can a news-based sentiment indicator predict movements in direct property market liquidity?
• Does a potential relationship hold for different dimensions of market liquidity (i.e. for market depth, -resilience and -breadth)?
• Does the slow nature of property transactions require a lagged model setup to adequately represent the relationship between sentiment and direct property market liquidity?
Research Questions, Paper 3:
“REIT Property Development and Stock Price Crash Risk”
• Are property-developing equity REITs more crash-prone than non-developing equity REITs?
• Do managers of equity REITs exploit the increase in information asymmetry due to property development for self-interested, myopic behavior?
• Can property development of equity REITs serve as a proxy for long-termism of management?
• Should regulators restrict equity REITs in their possibilities to develop own properties?
1.3 Co-Authors, Submissions and Conference Presentations
In the following, information on co-authors, journal submissions, publication status and conference presentations for each of the three papers is provided.
Publication Information, Paper 1:
“On the Predictive Potential of Investor Sentiment: A Deep-Learning Approach”
Authors:
Jochen Hausler, Johannes Braun, Wolfgang Schäfers Submission Details:
Journal: Journal of Real Estate Research Submission date: 08/08/2019
Current status: Under review, temporarily declined to revise by authors Conference Presentations:
This paper was presented at the 35th Annual Conference of the American Real Estate Society (ARES) in Paradise Valley, USA (2019), as well as the 24th Asian Real Estate Society (AsRES) International Conference in Shenzhen, China (2019).
Publication Information, Paper 2:
“Artificial Intelligence, News Sentiment, and Property Market Liquidity”
Authors:
Johannes Braun, Jochen Hausler, Wolfgang Schäfers Submission Details:
Journal: Journal of Property Investment & Finance Submission date: 08/01/2019
Current status: Accepted (11/06/2019)
Publication Information, Paper 3:
“REIT Property Development and Stock Price Crash Risk”
Author:
Johannes Braun Submission Details:
Journal: Journal of Real Estate Portfolio Management Submission date: 07/07/2020
Current status: Under review Conference Presentations:
An early version of this paper was presented at the 34th Annual Conference of the American Real Estate Society (ARES) in Bonita Springs, USA (2018) under the preliminary title “The Effect of Liquidity on Stock Price Crash Risk: Evidence from the U.S. REIT Market”.
1.4 References
Clayton, J., D. C. Ling and A. Naranjo, Commercial real estate valuation:
Fundamentals versus investor sentiment, The Journal of Real Estate Finance and Economics, 2009, 38:1, 5–37.
Das, P. K., J. Freybote and G. Marcato, An investigation into sentiment-induced institutional trading behavior and asset pricing in the REIT market, The Journal of Real Estate Finance and Economics, 2015, 51:2, 160–89.
Hausler, J., J. Ruscheinsky and M. Lang, News-based sentiment analysis in real estate:
A machine learning approach, Journal of Property Research, 2018, 35:4, 344–71.
Jin, L. and S. C. Myers, R2 around the world: New theory and new tests, Journal of Financial Economics, 2006, 79:2, 257–92.
Ruscheinsky, J., M. Lang and W. Schäfers, Real estate media sentiment through textual analysis, Journal of Property Investment & Finance, 2018, 36:5, 410–28.
Walker, C. B., Housing booms and media coverage, Applied Economics, 2014, 46:32, 3954–67.
2 On the Predictive Potential of Investor Sentiment:
A Deep-Learning Approach
2.1 Abstract
This paper employs a deep-learning approach to text-based sentiment analysis with regard to the direct commercial real estate market in the United States. By means of an artificial neural network and distant supervision-labeled training data, a market sentiment indicator is derived from news articles and related to market returns, as well as to up- and down-market periods. The created monthly indicator Granger-causes market returns in a vector autoregressive framework during the study period from January 2006 to December 2018. Estimated Markov-switching models reveal a varying influence of the sentiment indicator on market returns in up- and down-market periods. Logit regressions furthermore indicate some forecasting potential in a binary return prediction framework. However, while large market swings are captured well, the indicator struggles with short-term return fluctuations. Through the discussion of the extraction procedure, the potential and also the shortcomings of the sentiment- measuring approach, this paper lays the foundations for further applications of the constructed sentiment indicator.
Keywords: Artificial Neural Network, Deep Learning, Text-based Sentiment, Commercial Real Estate
2.2 Introduction
Compared to other areas of research, artificial intelligence (AI) has not so far gained much attention in the field of real estate. Only a few scholars (e.g. Din, Hoesli and Bender, 2001; and Peterson and Flanagan, 2009) address in their studies the potential of “intelligent agents” such as artificial neural networks (ANNs). Arguably, in particular the sparse data availability compared to other industries, has contributed to the fact that artificial intelligence research for real estate has not yet been able to extend beyond the fledging stage.
However, three rather recent developments have changed the setting and should be able to assist AI in becoming a powerful research instrument: The broad availability of vast amounts of online data through social networks or crowd-sourced information platforms has laid the basis for the data-hungry concepts of machine- and in particular deep-learning. This is aided by a drastic increase in computational power available to researchers through GPU (Graphics Processing Unit) and IaaS (Infrastructure as a Service) computing. Additionally, AI research has overcome several theoretical bottlenecks by developing new and better algorithms.
Due to this evolution, a new field of sentiment analysis, which surpasses the more traditional concepts of survey-based estimates and market proxies such as mortgage fund flows, has become accessible. For the first time, machines can be trained to assess and extract not only the content, but also opinions from textual documents via what is referred to as opinion mining. The research in this context started with sentiment dictionaries and proceeded to sentiment engines, such as Thomson Reuters News Scope (see e.g. Groß-Klußmann and Hautsch, 2011) and more recently, machine- learning approaches. However, to the best of the authors’ knowledge, no research in real estate so far has addressed the most recent subfield of sentiment analysis, namely ANN-based deep-learning. Through better scalability and the possibility of real-time analysis, which consequentially leads to an advantage in ‘big data’ applications, and the ability to identify more complex relationships by analyzing a richer data structure compared to other machine-learning approaches, artificial neural networks may have the potential to surpass other sentiment indicators when a large quantity of good quality training data is available. The bottleneck of traditional deep-learning-based textual sentiment analysis lies in the provision of a sufficient amount of manually
sentiment-labeled text documents.1 This paper is therefore not only the first to test a deep-learning framework for text-based sentiment analysis in real estate, but also seeks to overcome the aforementioned labeled data shortage by utilizing a new source of distant-labeled sentimental text data, namely Seeking Alpha long and short idea sections. Because of the slow pace of real estate transactions, the heterogeneity of real assets, as well as non-transparent regional markets, assessing the potential of a scalable sentiment indicator, which is also adaptable to local circumstances through the use of regionally published news articles as training data, seems especially worthwhile.2 After looking into the sentiment extraction procedure, the qualities of the resulting sentiment indicator are subject to critical scrutiny in a vector autoregression (VAR), a Markov-switching (MS) and a logit framework. The vector autoregression serves as a starting point, in order to shed light on the question of whether the indicator is able to explain direct real estate market returns. Beyond that, the VAR model can help to clarify the pressing question of causality.3 Despite the advantages of VAR models, they imply the possibility of ignoring a potential non-linear relationship between the variables in question. In particular for the REIT market, past research has provided resilient evidence that in order to reflect bull and bear markets, the use of Markov- switching models is preferable (see e.g. Lizieri, Satchell, Worzala and Dacco, 1998;
Bianchi and Guidolin, 2014). The cyclical nature of direct real estate markets suggests the need to control for the possibility of differing regimes likewise in their specific context. Freybote and Seagraves (2018) suggest a Markov-switching model in their paper on the relationship between sentiment and direct real estate market liquidity, and find strong differences in the relationship for both up- and down-markets. In order to evaluate the possibility of a non-linear relationship between sentiment and returns, this paper applies a Markov-switching model as the second component of its econometric analysis section. In the final econometric section, the paper considers aspects with relevance for the real estate industry. Within a logit framework, the ability of the sentiment measure to forecast up- and down-market periods is investigated. In- and out-of-sample forecasts are performed for this purpose. Besides being required in
1 To gradually improve a deep-learning algorithm’s capabilities, permanent human intervention is required.
2 A publication assessing a potential link of the constructed sentiment indicator to direct real estate market liquidity is intended by the authors.
3 Both a case for a causal relationship of sentiment explaining returns, as well as a converse relationship can be made. By the use of Granger-causality tests within a VAR model, this potential issue can be untangled.
terms of econometric diligence, this threefold approach is expected to help identify possible room for improvement in the construction procedure of the sentiment measure, which might allow for the creation for more comprehensive measures in future research.
The paper proceeds as follows: In Section 2.3, research with respect to text-based sentiment in finance and real estate is re-considered as an introduction to the more theory-driven Sections 2.4 and 2.5. These sections depict the structure of the news corpus from the S&P Global Market Intelligence database, as well as the training data from Seeking Alpha, before showing the sentiment extraction process via ANN and the econometric approaches. Subsequently, Section 2.6 presents the results of the VAR, Markov-switching and logit procedure. Section 2.7 discusses implications and provides concluding remarks.
2.3 Literature Review
2.3.1 Text-Based Sentiment Analysis in Finance
As demonstrated by Loughran and McDonald (2016), textual analysis and parsing in various forms has a history spanning several centuries. Likewise, analyzing the influence of news on stocks or entire markets in the finance literature is by no means a recent development. Starting more than 30 years ago, Roll (1988) made use of news from the Wall Street Journal and the Dow-Jones Newswire to explain stock price changes in his seminal R² paper. Other early studies such as Cutler, Poterba and Summers (1989) and French and Roll (1986) treated news as a mere measure of incoming information, without explicitly analyzing the content of the documents themselves. More recently, with the increase of computational power and driven by the requirements of internet search engines, as well as the rapid growth of social media, natural language processing and especially the subcategories of sentiment analysis and opinion mining have become an increasingly active research area, extending from computer science to the social and management sciences (Liu, 2012). Accordingly, the finance literature has recently been accommodating an ever-growing body of textual sentiment studies.
Kearney and Liu (2014) provide a comprehensive survey on how textual sentiment impacts on firm- and market level performance, sorted by methods and information sources. Most studies in that context focus on the sentiment analysis of news articles
and seek to link the constructed sentiment proxies to stock market returns, market prices, trading volumes, volatility, bid-ask spreads as well as firm earnings (see e.g.
Groß-Klußmann and Hautsch, 2011; Ozik and Sadka, 2012; Engelberg, Reed and Ringgenberg, 2012; García, 2013; Boudoukh, Feldman, Kogan and Richardson, 2013;
Ferguson, Philip, Lam and Guo, 2015; Heston and Sinha, 2016; Sinha, 2016; Sun, Najand and Shen, 2016; Hanna, Turner and Walker, 2017; as well as the seminal articles by Tetlock, 2007; and Tetlock, Saar-Tsechansky and Macskassy, 2008).
Another stream of literature addresses the influence of earnings press releases on a broad variety of performance measures (see e.g. Henry, 2008; Davis, Piger and Sedor, 2012; Davis and Tama-Sweet, 2012; Huang, Teoh and Zhang, 2014; Henry and Leone, 2016) and annual reports (see e.g. Kothari, Li and Short, 2009; Li, 2010; Feldman, Govindaraj, Livnat and Segal, 2010; Loughran and McDonald, 2011, 2015; Jegadeesh and Wu, 2013).
The vast majority of those studies either uses a sentiment dictionary such as the General Inquirer (GI)/Harvard IV-4 for classification purposes or an adapted finance- specific word list. Only a small fraction of papers facilitates text analysis programs (see e.g. Davis, Piger and Sedor, 2012; Davis and Tama-Sweet, 2012; Henry and Leone, 2016; for an application of the program DICTION). Basic machine-learning techniques and classification algorithms such as Naïve Bayes and support-vector machines are seldom applied, and more common in literature referring to the inherent sentiment expressed in stock message boards (see e.g. Antweiler and Frank, 2004; and Das and Chen, 2007). However, there are some initial attempts at more advanced deep- learning methods such as artificial neural networks (ANN) in the recent literature. For example Smales (2014), as well as Borovkova and Dijkstra (2018), rely on ANNs as well as news analytics from Thomson Reuters and its respective newswire, to investigate the relationship with gold future returns as well as to provide intraday forecasts on the EUROSTOXX 50.
2.3.2 Sentiment Analysis in the Realm of Real Estate
Sentiment analysis in real estate research relies predominantly on other, non-text- based, sentiment indicators, although being well established and drawing on an extensive range of resources. Sentiment gauges extend from market-related sentiment proxies such as NAV discounts (see e.g. Barkham and Ward, 1999, for an early study of NAV discounts of property companies in the UK, as well as Lin, Rahman and Yung,
2009, for an analysis of the influence on investor sentiment and REIT returns) to mortgage fund flows, properties sold from the NCREIF Property Index (NPI), the ratio of transaction-based (TBI) and constant-liquidity-based versions of the NPI value index, as well as past NPI and TBI total returns (Clayton, Ling and Naranjo, 2009).
Freybote and Seagraves (2017) adopt buy-sell imbalances when examining whether multi-asset institutional investors rely on the sentiment of real-estate-specific investors for investment decision making. In addition to such so-called “indirect” measures, surveys – especially the Real Estate Research Corporation (RERC) survey – are frequently used as a direct indicator, when linking investor sentiment to commercial real estate valuation (Clayton, Ling and Naranjo, 2009), private market returns (Ling, Naranjo and Scheick, 2014), trading behavior (Das, Freybote and Marcato, 2015) and REIT bond pricing (Freybote, 2016). For residential real estate sentiment, Marcato and Nanda (2016) use the National Association of Home Builders (NAHB) and Wells Fargo index and evaluate their ability to forecast demand and supply activities.
Furthermore, following a pioneering article by Ginsberg, Mohebbi, Patel, Brammer, Smolinski and Brilliant (2009), several scholars drew on Google search query data to analyze various aspects of the real estate market in the United States. Hohenstatt, Käsbauer and Schäfers (2011) provide evidence that Google Trends4 enables inferences on the housing market in the near future, as well as on financing decisions.
Similarly, there is evidence that abnormal search activity in US cities can help to predict future abnormal house price changes (Beracha and Wintoki, 2013) and Google Trends can serve as an indicator for housing market turning points (Dietzel, 2016).
With respect to the commercial real estate market, the results were likewise promising.
Dietzel, Braun and Schäfers (2014), Rochdi and Dietzel (2015) as well as Braun (2016) demonstrate the ability of Google Trends data to forecast commercial real estate transaction and price indices, REIT market volatility, as well as to serve as a successful application in trading strategies.
Besides such indirect proxies, surveys and search query data, some text-based indicators have found their way into real estate research in more recent years.
Facilitating news articles, Soo (2015) uses sentiment expressed in local newspapers to predict house prices in 34 US cities. Walker (2014, 2016) makes use of the
4 Google Trends provides search volume indices of search queries that can be filtered by various different categories, according to the topic of interest.
aforementioned DICTION software to investigate the relationship between the UK housing market boom from 1993 to 2008, and media coverage as well as stock returns of firms engaging in the housing market. Analyzing news headlines from Bloomberg, The Financial Times and The Wall Street Journal, Ruscheinsky, Lang and Schäfers (2018) reveal a leading relationship of media-expressed sentiment to the FTSE/NAREIT All Equity Total Return Index. With respect to machine-learning and deep-learning, so far, the only available research is apparently provided by Hausler, Ruscheinsky and Lang (2018), in which the authors show that sentiment indicators extracted by means of machine-learning lead the direct as well as the securitized real estate market in the United States. It seems that no research is published exploring the power of deep-learning in general, and artificial neural networks (ANN) in particular in a real estate market context.
Considering the drawbacks of alternative sentiment indicators (i.e. a long reaction time and, in the case of market surveys, a restricted availability), this research gap provides a unique opportunity to explore the potential of a deep-learning approach with respect to text-based sentiment analysis in real estate. Simultaneously, the disadvantages of abstract, theory-loaded proxies are avoided, as deep-learning frameworks do not rely on pre-defined theoretical rules, but independently “master” potential relationships from provided training data. Accordingly, with the help of distant supervision-labeled training documents from Seeking Alpha, as well as news articles from the S&P Market Intelligence Database, the application of an ANN sentiment classifier for predicting returns and turning points in the CoStar Commercial Repeat-Sale Index is assessed.
Hence, the present paper is the first to combine text-based sentiment analysis, a deep- learning approach and distant supervision labeling in real estate research.
2.4 Data
The outlined study utilizes four types of data: Seeking Alpha5 (SA) long and short idea sections (as explained below) serve as the training data set for the artificial neural network, and S&P Global Market Intelligence (S&P) real estate news articles on the US market constitute the text corpus of the constructed sentiment index. The CoStar
5 Seeking Alpha is a crowd-sourced website providing investment content delivered by independent contributing authors. The required long and short ideas are subsections of the SA website, containing opinions on either single financial assets or asset markets in general. In each long idea, an author outlines why he expects the asset or market in question to be a favourable buying opportunity, and conversely for short ideas. Since 2014, long and short idea articles have started with a summary section that delivers the quintessence of the buy or sell recommendation in several short bullet points.
Commercial Repeat-Sale Index (CCRSI) is used as a measure of development of the direct real estate market in the United States. Furthermore, a set of control variables will be added to the regression equations. The time series limiting factor is the S&P news database, which only provides articles back to November 2005. The empirical models thus incorporate data from January 2006 to December 2018.
2.4.1 Seeking Alpha
For the construction of the sentiment index, a two-part process is proposed. As this paper refrains from manually labeling training data for the ANN, a data set of distant supervision-labeled text documents6 is required. Summary sections of Seeking Alpha long and short ideas are collected for this objective. The following example from the data set illustrates the structure of those summary sections for a short idea:
“Consumer complaints are everywhere. Particularly concerning are those surrounding false billing and unwillingness to share work invoices. […]”
The summary sections of those investment ideas either contain a distilled version of negative sentiment (short ideas) or positive sentiment (long ideas) towards the equity or market in question. It thus can be argued that SA long and short ideas represent an almost ideal data set for training an ANN on the distinction between positive and negative sentiment.
In total 69,773 investment ideas were collected from SA. With only 8,911 of the summaries being short ideas, the ratio is heavily skewed. In order to receive a symmetric training procedure, a random sample of 8,911 long ideas is drawn and joined with the short ideas to constitute the ANN’s training data set. The final training data set consists of a balanced sample of 17,822 SA texts provided by 3,107 different authors and containing an average of 381 characters.
2.4.2 S&P News Database
For the second step in the process of constructing the sentiment index, real estate market news articles are required. Due to their widespread availability among real estate professionals, articles from the Standard & Poor’s Global Market Intelligence news database with respect to the US real estate market are collected. These articles serve as the basis for estimating of the level of the monthly sentiment index. The total
6 Distant supervision labeling is defined as the absence of an annotator providing the classification of the training data manually.
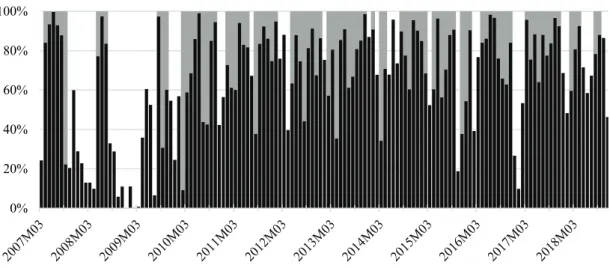
number of news articles for the study period between January 2006 and December 2018 is 66,070, with a monthly mean of 424 articles, a minimum number of 224 articles per month and an average of 1,125 characters per article (see Figure 2.1).
Figure 2.1: S&P News Distribution over Study Period
Notes: Figure 2.1 plots the monthly distribution of the 66,070 news articles serving as the basis for constructing of the sentiment index in this study. The articles in the sample were collected from the S&P Global Market Intelligence news archive, covering the US real estate market between 2006:M1 and 2018:M12. The monthly mean of news articles per month is 424, and the minimum, 224 articles per month.
2.4.3 Direct Market Return and Macroeconomic Controls
The dependent variable of the regression analysis is the CoStar Commercial Repeat- Sale Index (CCRSI) which represents the development of commercial real estate prices in the United States. For this study, monthly percentage changes in the value-weighted US composite price index are used. When running regression analyses for real estate returns, other influencing factors such as the general economy as well as capital markets, have to be taken into account. All control variables are selected in accordance with previous research, mainly Clayton, Ling and Naranjo (2009), Ling, Naranjo and Scheick (2014) and Hausler, Ruscheinsky and Lang (2018). At the capital market level, this study includes credit spread, term structure and general stock market return variables. This allows controlling for the state of debt, as well as equity markets and financing conditions (see e.g. Freybote and Seagraves, 2017). More specifically, future expectations of overall economic development are controlled for by incorporating a term structure variable (TERM, i.e. the spread between 10-year Treasury bonds and 3- month Treasury bill yields). Furthermore, the spread between Moody’s seasoned Baa- and Aaa-rated corporate bond yields is added to the regression equations (SPREAD) in order to control for general economic default risk (see e.g. Clayton, Ling and
0 100 200 300 400 500 600 700 800
Monthly news coverage
Naranjo, 2009). Following Das, Freybote and Marcato (2015), the performance of the general stock market is accounted for by including monthly returns on the S&P500 composite index (S&P500). To additionally allow for the fact that direct real estate is considered as an inflation hedge (Hoesli, Lizieri and MacGregor, 2008), consumer price index growth is used to control for inflation (INFLATION). Altogether, those variables should also capture the overall demand for real assets. The current state of the supply side however, is reflected by adding percentage changes in seasonally adjusted total construction spending (CONSTRUCTION) on a monthly basis.
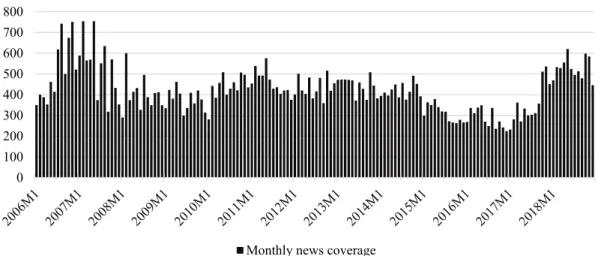
Summary statistics of the described variables can be obtained from Table 2.1.
Table 2.1: Descriptive Statistics
Statistic Mean Median St. Dev. Min Max
CCRSI (%) 0.26 0.46 1.53 -6.82 3.05
TERM (pp) 1.83 1.95 1.05 -0.52 3.69
SPREAD (pp) 1.10 0.94 0.50 0.55 3.38
S&P500 (%) 0.71 1.29 4.10 -16.80 10.93
INFLATION (%) 0.16 0.17 0.39 -1.92 1.01
CONSTRUCTION 86,536 88,709 14,038 62,893 110,362 Notes: This table reports summary statistics of the monthly real estate return data and macroeconomic time series. CCRSI is the total return of the CoStar Commercial Repeat-Sale Index. TERM is the difference between the 10-year US Treasury bond and the 3-month Treasury bill yields in percentage points (pp). SPREAD is the difference between Baa- and Aaa-rated corporate bond yields. S&P500 is the total return of the S&P 500 composite index. INFLATION is the percentage change of the consumer price index. CONSTRUCTION is the amount of seasonal adjusted construction spending in millions of dollars. The sample period is 2006:M1–2018:M12.
2.5 Methodology
2.5.1 Artificial Neural Network
Artificial neural network research, often falsely perceived as a young field, actually emerged as early as the 1950s, with Rosenblatt (1958) often being considered the inventor of the first “real” ANN. Due to the extensive computational requirements and lack of mathematical algorithms to back the concepts, research effort in the field stagnated soon after. With the introduction of the backpropagation algorithm in the context of ANNs, Werbos (1974) drastically increased the possibilities for training complex models efficiently. The newly-wakened research interest was however, again retarded by the breakthroughs in the related machine-learning field of support vector machines (SVMs) in the early 1990s (see Cortes and Vapnik, 1995). As “shallow”
learning methods however, SVMs require the application of feature engineering, which regularly renders them inferior to ANNs in solving perceptual problems.
Furthermore, in comparison to ANNs, practical applications of SVM approaches turned out to be less scalable in conjunction with large data sets. The widespread availability of massive amounts of data accompanying the rise of the internet, new algorithms as well as a drastic increase in computational power on hand, have all contributed to a resurgence of ANN research and applications in recent years. Hence, a recent milestone in ANN development is commonly seen in the development of
“AlexNet” (Krizhevsky, Sutskever and Hinton, 2012), which won the widely recognized ImageNet picture classification task in 2012 and heralded a period of dominance of ANN methods in the ImageNet and similar competitions since then.
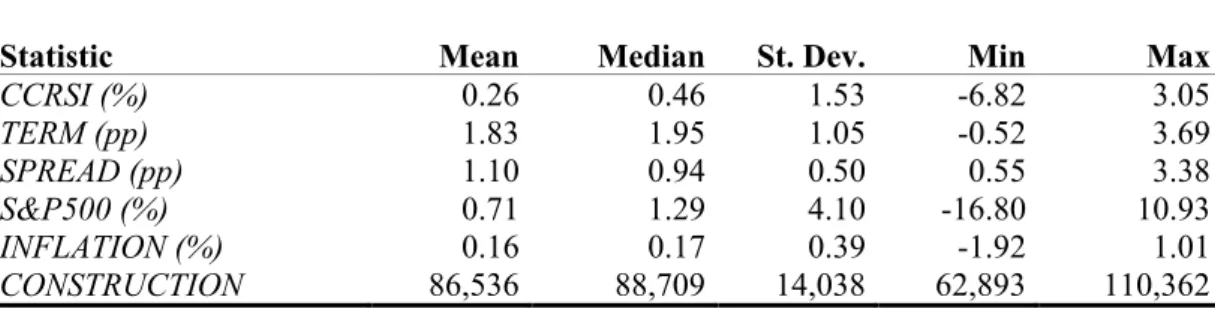
Despite developments in the theoretical foundations of ANN research, the field rests on relatively little mathematical theory. ANN development can thus rather be seen as an engineering than a statistical discipline; models are regularly justified empirically instead of theoretically. The intuitive but simplistic analogy to human brains lending artificial neural networks their name, results from their shape, which combines consecutive layers of interconnected “neurons” (or nodes). Comparable to the human brain, the involved neurons require a certain signal threshold to fire and deliver a transformed signal to the subsequent layer. By directing an input signal through the layers, stepwise transformations of the input signal are performed.7 The goal of the transformation process executed by the network layers is the minimization of prediction errors, i.e. the “distance” between the network’s predictions and the assigned labels defined by the network’s loss function. Error reduction is achieved by the gradual alteration of the weight parameters defining the functions of each layer’s nodes. Simultaneous optimization of the parameter values is achieved through the application of a backpropagation algorithm. By using backpropagation, the gradient function of the chained derivatives for all network nodes is calculated and thereby also the direction in which the parameter values have to be changed in order to reduce the overall prediction error. The general structure of an ANN is shown in Figure 2.2.
7 In the context of text sentiment analysis, the input data consists of vectorized text data assigned with sentiment labels.
Figure 2.2: Basic Structure of an Artificial Neural Network
Notes: Figure 2.2 shows the basic circular structure of an artificial neural network (ANN). Training data is channeled through a sequence of transformations. A loss function evaluates the predictions by comparing them to true data labels. Subsequently the predictions are optimized by performing updates of the weight parameters in each layer. Then the process is repeated with the updated weight parameters.
2.5.1.1 Text Pre-Processing
To obtain vectorized, machine-readable text data, several pre-processing steps on the raw Seeking Alpha and Standard & Poor’s text data have to be undertaken. Firstly, Unicode categories P, S, Z and C, as well as separate numbers are removed, and upper case replaced by lower case letters.8 Intra-word contractions and hyphens are split up into the respective single words, possessive forms of words converted into their regular equivalents (e.g.: “company’s” is transformed into “company”). Additionally, the texts are compared to a stopword list to remove words with presumably no or very low sentiment polarity. For this paper, written forms of numbers and any form of calendar terminology are included in the stopword list. These additions to the standard list are performed to remove uninformative patterns related to expressions of time in the SA text data, as these patterns might otherwise be incorporated into the ANN’s learning algorithm in the upcoming steps.
Furthermore, an analysis of the structure of both text sources exhibits a considerable number of company names, executive names and similar terms. These terms
8 Unicode categories P, S, Z and C contain punctuation, symbols, separators and control characters respectively.
presumably do not carry any sentiment polarity themselves. However, due to the structure of SA’s long and short ideas, an unintentional influence of such terms on the sentiment prediction of the ANN has to be considered.9 For this reason, both S&P and SA text data has to be aligned to a dictionary containing a complete set of English vocabulary used in written language. Thus, each text is compared to the broadly used Hunspell spell checking dictionary.10 By doing so, words that are not part of the general English language corpus (i.e. most company names or names) are removed from the text documents. As a final pre-processing step, all words contained in the SA and S&P texts are reduced to their word stem form.
2.5.1.2 ANN Training and Validation
Next, each SA long and short idea is annotated with the distant supervision label (i.e.
long ideas are annotated with 1, short ideas with 0). To reduce noise in the ANN’s learning process and limit computational requirements, the word universe for all SA texts is restricted to the 1,000 most frequent words.
For the validation of the network after the training process, 20 percent of the SA data is selected at random and excluded from training. The remaining 80 percent of the pre- processed SA data (i.e. 14,258 texts) is supplied to the ANN. This is done with the use of a document feature matrix.11
The ANN is set up as a multilayer perceptron with the following structure: 4 fully connected layers with ReLU (Rectified Linear Unit) activation functions and declining node amounts (64, 48, 32, and 16) are used to gradually reduce the feature space. The ReLU layers are defined by the transformation:12
0, , ) + ) . (2.1)
9 Suppose, for example, a high amount of SA long ideas on Equinix REIT. The ANN will inevitably connect the term “Equinix” to positive sentiment, if this issue remains unaccounted for.
10 Hunspell word lists are available under http://app.aspell.net/create for downloading. For this paper, a list containing the common spelling of the Hunspell default number of words, including American and British English spelling, is used. Variants with and without diacritic marks of respective words are included.
11 A document feature matrix, also referred to as a sparse matrix, contains a column for each word in the respective data set and a row for each text document in the data set. Each cell of the matrix is filled with 1, if the text document in question contains the respective word, and 0 otherwise. Note that several specifications containing the use of embedding layers, together with an integer matrix, were tested.
However, as the classification results did not change drastically, the more intuitive concept of a document feature matrix was given the preference in this paper.
12 For clarity, the subscripts of the weight parameters W and b are not included in the equations describing the layout of the ANN.
Input constitutes the input matrix resulting from the vectorized text documents for the first ReLU layer and the output of the preceding layer for layers 2 to 4. W and b are the weight parameters.
A final layer of the ANN is constituted by a sigmoid squashing function, so as to obtain a one-dimensional output parameter between 0 and 1:
1
1 + ℎ = , ) + . (2.2)
Here, Input denotes the output of the last ReLU layer, W and b are again weight parameters. During the training process, the pre-processed SA data is fed into the ANN (starting initially with random weight parameters) in batches of 500 articles with a gradient update following each new batch. In total, 6 epochs, each containing all batches, are performed.13 The optimization process thus contains a total of 174 gradient updates.14
The loss score after each batch is calculated by applying a binary cross-entropy loss function:
1 −1 ∗ !∗ " # !) + 1 − !) ∗ " # 1 − !)$
%
!&'
. (2.3)
yk is a binary variable taking the value 1 if Seeking Alpha text k is labeled as a long idea, and 0 if Seeking Alpha text k is labeled as a short idea. pk is the probability value resulting from the sigmoid function for text k.
The optimization of the ANN is executed by using the Root Mean Square Propagation (RMSprop) algorithm (Tieleman and Hinton, 2012).15 The updates for all parameters W and b are calculated with the following equations:
()*+ = , ∗ ()*+-. + 1 − ,) ∗ / ()0+ = , ∗ ()0+-. + 1 − ,) ∗ /
(2.4)
13 Other specifications were tried, but a lower number of texts per batch did not increase the predictive power. A higher number of epochs lead to a gradual overtraining of the ANN.
14 Updates per epoch: 29 (≈14,258/500); Updates over all epochs: 174 (=29*6).
15 RMSprop, first suggested by Geoffrey Hinton during a Coursera online class in 2012, developed into one of the most frequently used ANN optimization algorithms. However, it was never formally published.
1'= − 2 3()*++ 4∗
1'= − 2
3()0++ 4∗ .
and are the gradients of the weight parameters at time t, ()*+-. is the moving average of the squared gradient for weight parameter W at time t-1, ()0+-. the equivalent for weight parameter b at time t-1. β is a hyperparameter constituting the computation of the gradients’ moving average. For β, Hinton’s (for details see Tieleman and Hinton, 2012) initially suggested value of 0.9 is used. η defines the learning rate of the optimizer, for this paper η is set to 0.001. The hyperparameter ε constitutes a fuzz factor to avoid division by zero, in this paper the value of e-7 is chosen.
The training process described above is used to train 10 ANN models, in order to increase the robustness of the predictions. The average prediction value for each S&P news article is used to calculate its sentiment score. The monthly sentiment index value is then computed as the average sentiment score of all S&P news articles of the respective month. Due to the application of the sigmoid function in the last ANN layer, the sentiment index (SI) ranges between 0 and 1 in the spectrum and can thus be interpreted as a probability value. In the regression analyses, first differences of the monthly sentiment index score are used.
SI yields a mean value of 0.63 and a standard deviation of 0.05. This matches the average positive market performance of the CCRSI of 0.26% during the sample period.
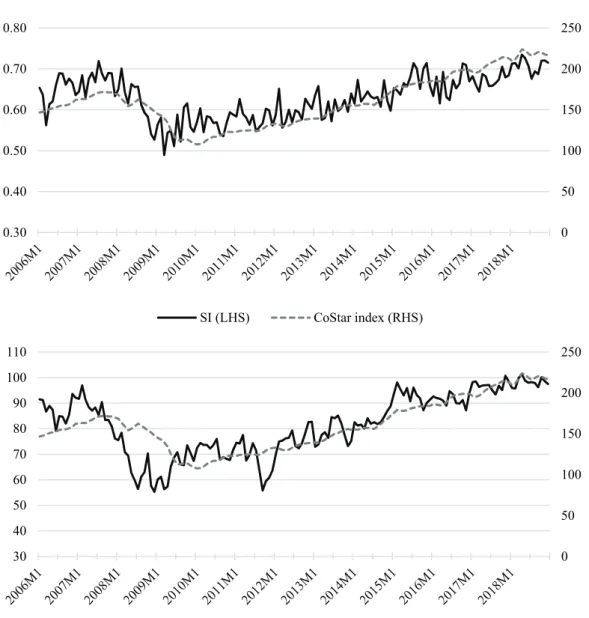
To provide some initial visual results, Figure 2.3 contrasts the SI with the CCRSI, as well as the University of Michigan Consumer Sentiment Index (MCSI). To justify the general concept of the sentiment index suggested in this paper, the SI should not differ vastly from existing sentiment measures over the study period. Indeed, MCSI and SI exhibit an index correlation of 73.00%. The index correlations with the direct market are 78.23% and 79.80% for the MCSI and the SI, respectively. Those findings are encouraging with respect to possible results of more in-depth econometric analyses in the future.
Figure 2.3: Temporal Progression of the SI
Notes: The top chart in Figure 2.3 contrasts the temporal progress of the created ANN-based textual sentiment indicator (SI) with the progress of the CoStar Commercial Repeat Sales value-weighted index. For a comparison, the bottom picture in Figure 2.3 repeats the same lineup for the University of Michigan Consumer Sentiment Index (MCSI). The sample period is always 2006:M1 to 2018:M12.
2.5.2 Econometric Approaches
To examine the full potential of the ANN-based sentiment indicator, three different econometric models are tested. This extensive econometric framework aims to shed light on the indicator’s capability to predict both turning points, as well as market returns. With respect to a potential relationship between the proposed sentiment indicator and returns on the direct real estate market in the United States, a vector autoregression as well as a Markov-switching model are implemented. A logit approach further explores the indicator’s predictive potential for up- and down-market phases within a binary response model framework. Additionally, in-sample and one-
0 50 100 150 200 250
0.30 0.40 0.50 0.60 0.70 0.80
SI (LHS) CoStar index (RHS)
0 50 100 150 200 250
30 40 50 60 70 80 90 100 110
University of Michigan Consumer Sentiment Index (LHS) CoStar index (RHS)
![Table 2.2: VAR Estimation Results (cont.) SPREAD (-1) 0.731 0.761 [ 1.03711] [ 1.08951] SPREAD (-2) -0.615 -0.614 [-0.82511] [-0.83098] SPREAD (-3) 0.895 0.949 [ 1.33723] [ 1.42116] INFLATION (](https://thumb-eu.123doks.com/thumbv2/1library_info/3725911.1508235/43.892.158.772.148.963/table-var-estimation-results-spread-spread-spread-inflation.webp)

![Table 2.4: VAR Estimation Results in Up- and Down-Market Periods (cont.) SPREAD (-1) 0.731 0.813 0.025 [ 1.03711] [ 0.74043] [ 0.02761] SPREAD (-2) -0.615 0.331 -1.366 [-0.82511] [ 0.30833] [-1.57395] SPREAD (-](https://thumb-eu.123doks.com/thumbv2/1library_info/3725911.1508235/49.892.169.781.145.966/table-estimation-results-market-periods-spread-spread-spread.webp)