zu Immobilienökonomie und Immobilienrecht
Herausgeber:
IRE
I
BS International Real Estate Business SchoolProf. Dr. Sven Bienert
Prof. Dr. Stephan Bone-Winkel Prof. Dr. Kristof Dascher Prof. Dr. Dr. Herbert Grziwotz Prof. Dr. Tobias Just
Prof. Dr. Kurt Klein
Prof. Dr. Jürgen Kühling, LL.M.
Prof. Gabriel Lee, Ph. D.
Prof. Dr. Gerit Mannsen
Prof. Dr. Dr. h.c. Joachim Möller Prof. Dr. Wolfgang Schäfers
Prof. Dr. Karl-Werner Schulte HonRICS Prof. Dr. Steffen Sebastian
Prof. Dr. Wolfgang Servatius Prof. Dr. Frank Stellmann Prof. Dr. Martin Wentz
Alexander Schätz
Dynamics on Real Estate
and Emerging
Markets
Alexander Schätz
Dynamics on
Real Estate and Emerging Markets
Schätz, Alexander
Dynamics on Real Estate and Emerging Markets Alexander Schätz
Regensburg: Universitätsbibliothek Regensburg 2014
(Schriften zu Immobilienökonomie und Immobilienrecht; Bd. 67) Zugl.: Regensburg, Univ. Regensburg, Diss., 2009
ISBN 978-3-88246-340-8
ISBN 978-3-88246-340-8
© IRE|BS International Real Estate Business School, Universität Regensburg Verlag: Universitätsbibliothek Regensburg, Regensburg 2014
Zugleich: Dissertation zur Erlangung des Grades eines Doktors der Wirtschaftswissenschaften, eingereicht an der Fakultät für Wirtschaftswissenschaften der Universität Regensburg
Tag der mündlichen Prüfung: 06. Juli 2009 Berichterstatter: Prof. Dr. Steffen Sebastian
Prof. Dr. Dr. h.c. Joachim Möller
Summary of Contents
1 Introduction ...1
2 Macroeconomic Effects on Emerging Market Sector Indices ...8
Abstract ...9
2.1 Introduction ...10
2.2 Review of Literature ...12
2.3 Data Selection, Methodology and Hypotheses ...14
2.4 Empirical Results ...21
2.5 Conclusion ...35
2.6 Appendix ...38
3 The Link between Property and Economy ...49
Abstract ...50
3.1 Introduction ...51
3.2 Review of Literature: Real Estate and Macroeconomics...53
3.3 Data Selection and Methodology ...58
3.4 Empirical Results ...67
3.5 Conclusion ...75
3.6 Appendix ...78
4 Real Estate Equities – Real Estate or Equities? ...80
Abstract ...81
4.1 Introduction ...82
4.2 Literature Review ...86
4.3 Data Selection...91
4.4 Methodology ...99
4.5 Empirical Results ...103
4.6 Conclusion ...113
4.7 Appendix ...116
References ...123
Eidesstattliche Versicherung...135
Table of Contents
List of Figures ... VI List of Tables... VII List of Abbreviations ... IX List of Symbols ... XIII
1 Introduction ...1
2 Macroeconomic Effects on Emerging Market Sector Indices ...8
Abstract ...9
2.1 Introduction ...10
2.2 Review of Literature ...12
2.3 Data Selection, Methodology and Hypotheses ...14
2.3.1 Data ...14
2.3.2 Cointegration and VECM...17
2.3.3 Hypotheses ...19
2.4 Empirical Results ...21
2.4.1 Cointegration Analysis...21
2.4.1.1 Structural Change ...21
2.4.1.2 Unit Root Tests...23
2.4.1.3 Cointegration Tests ...24
2.4.2 VECM Results...25
2.4.2.1 Evaluation Principles ...25
2.4.2.2 Consumer Prices...28
2.4.2.3 Federal Funds Rate...29
2.4.2.4 Commodity Prices ...30
2.4.2.5 Adjustment Process ...31
2.4.3 Impulse Response Analysis and Variance Decomposition...33
2.5 Conclusion ...35
2.6 Appendix ...38
2.6.1 Sector Indices´ Progress (01/1995 – 03/2007)...38
2.6.2 Cointegration Tests ...40
2.6.3 Adjustment Processes...42
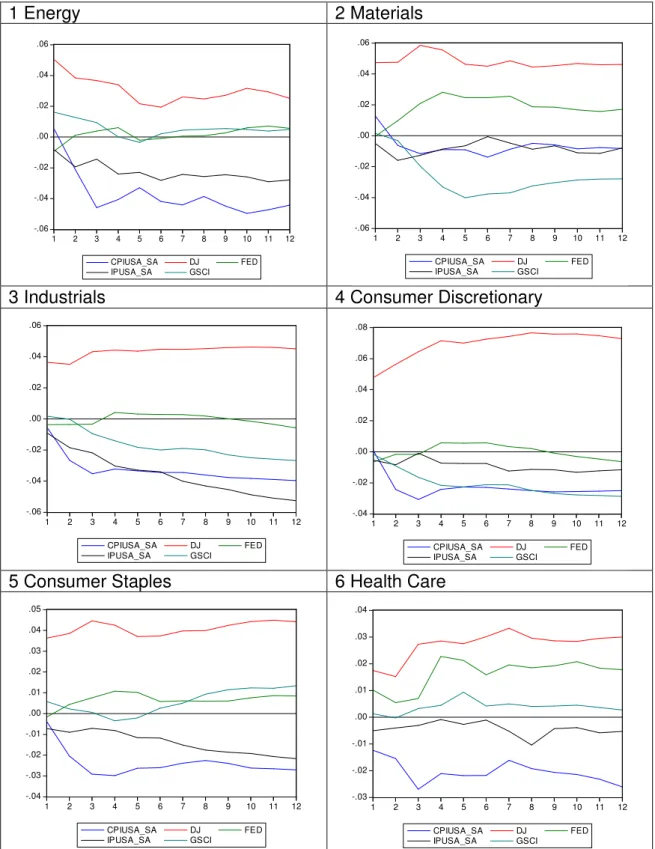
2.6.4 Impulse Response Analyses ...44
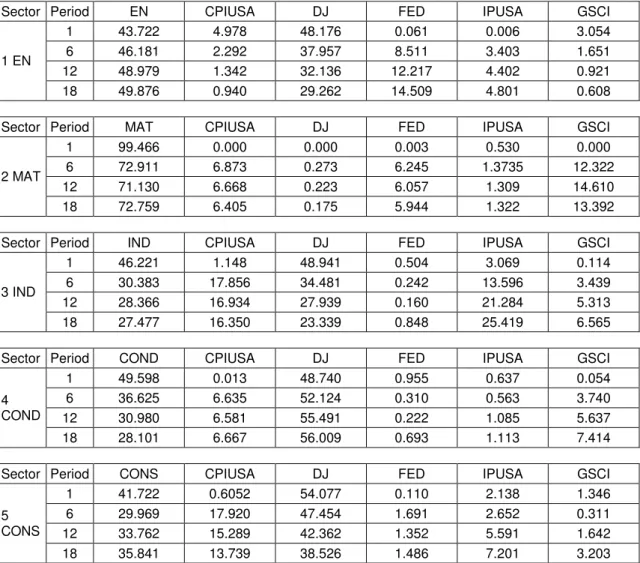
2.6.5 Variance Decompositions...46
3 The Link between Property and Economy ...49
Abstract ...50
3.1 Introduction ...51
3.2 Review of Literature: Real Estate and Macroeconomics...53
3.3 Data Selection and Methodology ...58
3.3.1 Real Estate Data ...58
3.3.2 Macroeconomic Data ...59
3.3.3 Hypotheses ...60
3.3.4 Preliminary Tests...62
3.3.5 Descriptive Statistics ...62
3.3.6 Methodology...65
3.4 Empirical Results ...67
3.4.1 Cointegration Analysis...67
3.4.2 Evaluation Principles ...69
3.4.3 VECM Results...70
3.5 Conclusion ...75
3.6 Appendix ...78
4 Real Estate Equities – Real Estate or Equities? ...80
Abstract ...81
4.1 Introduction ...82
4.1.1 Macroeconomic System ...84
4.1.2 Cointegration and VECM...85
4.2 Literature Review ...86
4.2.1 Nature of Real Estate Assets ...86
4.2.2 Real Estate and Macroeconomics...89
4.3 Data Selection...91
4.3.1 Real Estate and Stock Market Data ...91
4.3.2 Macroeconomic Data ...93
4.3.3 Different Nature of Selected Time Series ...94
4.3.4 Testing for Structural Breaks...95
4.3.5 Descriptive Statistics ...98
4.4 Methodology ...99
4.4.1 Cointegration Analysis...100
4.4.2 Evaluation Principles ...102
4.4.3 Variance Decomposition ...103
4.5 Empirical Results ...103
4.5.1 VECM Results – Technical Evaluation ...104
4.5.2 VECM Framework: Significance and Signs...105
4.5.3 Linkage to the Macroeconomy ...106
4.5.4 Features of Real Estate Equities...109
4.5.5 Variance Decomposition ...111
4.6 Conclusion ...113
4.7 Appendix ...116
4.7.1 Testing for Structural Breaks...116
4.7.2 Unit Root Tests ...118
4.7.3 Cointegration Graphs ...120
4.7.4 Variance Decomposition ...121
References ...123
Eidesstattliche Versicherung...135
List of Figures
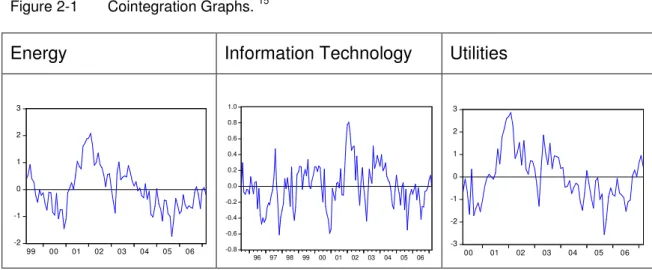
Figure 2-1 Cointegration Graphs. ...32
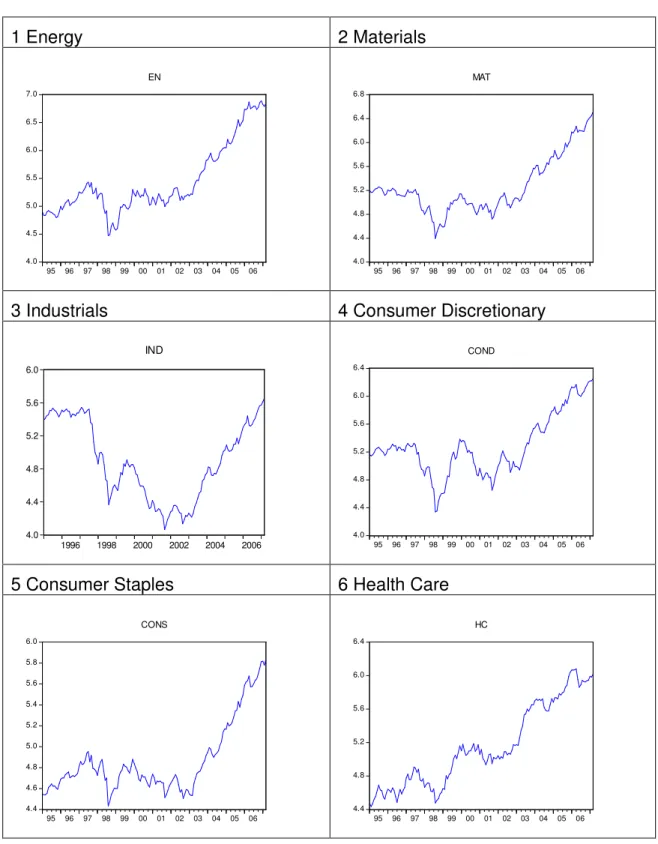
Figure 2-2 Progress of the Sector Indices (in logs). ...38
Figure 2-3 Results of the Impulse Response Analyses. ...44
Figure 3-1 Macroeconomic Environment in Germany and the UK. ...64
Figure 3-2 Cointegration Graphs (Germany). ...73
Figure 3-3 Cointegration Graphs (United Kingdom). ...73
Figure 4-1 Real GDP in the UK and the US. ...95
Figure 4-2 Key Interest Rates in the US and the UK. ...97
Figure 4-3 Variance Decompositions. ...112
Figure 4-4 Sample Split Chow Test for the United States. ...116
Figure 4-5 Sample split Chow Test for the United Kingdom ...117
Figure 4-6 Cointegration Graphs for the US and the UK Models...120
List of Tables
Table 2-1 Summary Statistics ...16
Table 2-2 Hypotheses ...21
Table 2-3 Results of the Chow Breakpoint Test ...23
Table 2-4 Long-term Equilibrium Relationships...27
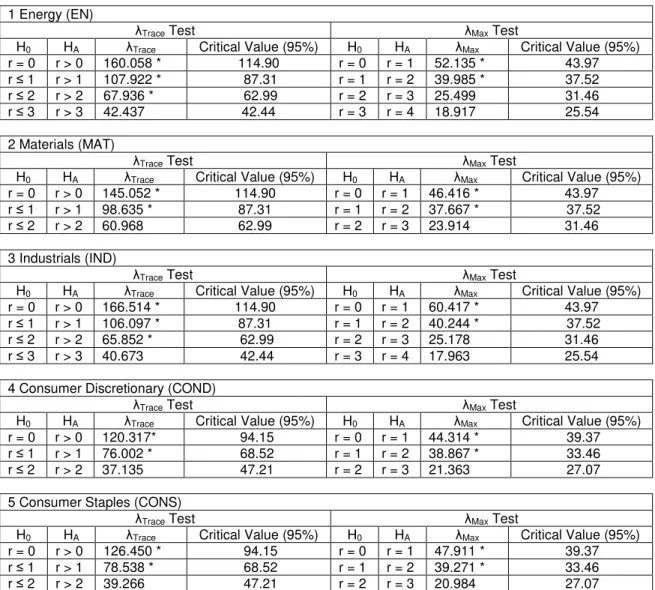
Table 2-5 Results of the Trace and Maximum Eigenvalue Tests ...40
Table 2-6 Adjustment Processes of the Sector Models...42
Table 2-7 Results of the Variance Decompositions...46
Table 3-1 Summary Statistics (1995:07 – 2007:07) ...63
Table 3-2 Results of the Trace and Maximum Eigenvalue Tests ...69
Table 3-3 Long-Term Equilibrium Relationships (β-vectors) ...71
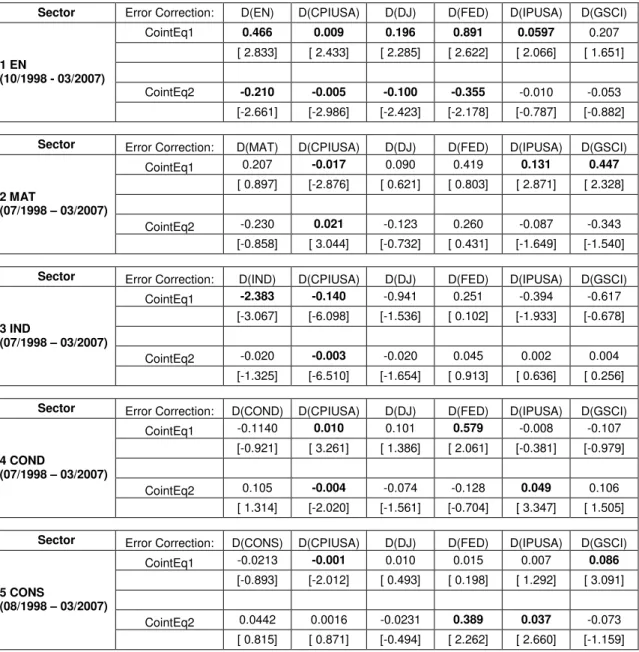
Table 3-4 Adjustment Processes (α-vectors) ...71
Table 3-5 Unit Root Tests (1995:07 – 2007:07) ...78
Table 4-1 Descriptive Statistics (1992:q1 to 2008:q2)...98
Table 4-2 Long-Term Equilibrium Relationships (β-vectors) ...105
Table 4-3 Adjustment Processes (α-vectors) ...107
Table 4-4 United States: Unit Root Tests (1992:q1 - 2008:q2)...118
Table 4-5 United Kingdom: Unit Root Tests (1992:q1 to 2008:q2)...119
Table 4-6 Variance Decompositions (United States)...121
Table 4-7 Variance Decompositions (United Kingdom)...121
List of Abbreviations
ADF Augmented Dickey-Fuller Test AIC Akaike Information Criterion ANN Artificial Neural Network
ARMA Autoregressive Moving Average
ASEAN Association of Southeast Asian Nations
BR Base Rate
COND Consumer Discretionary Sector CONS Consumer Staples Sector
CPI Consumer Price Index
CPIUSA Consumer Price Index of the United States CUSUM Cumulative Sum (Sequential Analysis Technique) CUSUMQ Cumulative Sum based on Squared Residuals
DF Dickey-Fuller
DJ Dow Jones Index
ECB European Central Bank
ECM Error Correction Model
EGARCH Exponential General Autoregressive Conditional Heteroskedastic
EM Emerging Markets
EN Energy Sector
ERM Exchange Rate Mechanism
FED Federal Funds Rate of the Federal Reserve Bank
FIN Financials Sector
FTSE Financial Times Stock Exchange GAR Generalised Autoregressive
GARCH Generalised Autoregressive Conditional Heteroskedasticity GDP Gross Domestic Product
GOV Long-Term Government Bond (10 years) GSCI Goldman Sachs Commodity Index
HC Health Care Sector
HQ Hannan-Quinn Information Criterion ICA Independent Components Analysis IMMEX German Appraisal-Based Property Index IND Industrials Sector
INF Information Technology Sector IP Industrial Production
IPD Investment Property Database
IPUSA Industrial Production Index of the United States INTER Interbank Rates
JB Jarque-Bera
LI Level of Integration
ln Natural Logarithm
LR Linear Restrictions
M1 Measure of the Money Supply MAP Multifactor Asset Pricing
MAT Materials Sector
MSCI Morgan Stanley Capital International
NAREIT National Association of Real Estate Investment Trusts NCREIF National Council of Real Estate Investment Fiduciaries
NPI Property Index of the National Council of Real Estate Investment Fiduciaries
OLS Ordinary Least Squares
PP Phillips-Perron
REIT Real Estate Investment Trust
REEI Financial Times Stock Exchange (FTSE) 350 Real Estate Index
SC Schwartz Information Criterion S&P Standard & Poor´s
SP500 Standard & Poor´s 500 Stock Index Std.Dev Standard Deviation
SUR Seemingly Unrelated Regression TAR Threshold Autoregressive
TEL Telecommunication Sector
UK United Kingdom
UR Unemployment Rate
US United States
USA United States of America USD United States Dollar
UT Utilities Sector
VAR Vector Autoregressive VEC Vector Error Correction
VECM Vector Error Correction Model
X12 Method for Seasonally Adjusting Data ZERP Centre of European Law and Politics
List of Symbols
α Matrix indicating the Error Correction Term ß Matrix indicating the Cointegrating Vectors
c Constant
Гi Matrix representing the Short-Term Dynamics
€ Euro
E(CFt) Discounted Future Value of the Expected Cash Flow
εt Error Term
H0 Null hypothesis
HA Alternative Hypothesis
k Order of Vector Autoregressive Process kt Required Rate of Return
λTrace Likelihood-Ratio Test Statistics of the Trace Test for
Cointegration
λMax Likelihood-Ratio Test Statistics of the Maximum Eigenvalue Test for Cointegration
n Number of Vectors (contained in the respective Matrix)
µ Vector of Constants
π Cointegration Matrix including the Cointegrating Vectors and the Error Correction Term
P0 Equity Price
£ British Pound
r Number of Cointegrating Vectors
R2 Goodness of Fit
Yt Vector Autoregressive Process
∆Yt Vector of the First Differences of Stochastic Variables Y
1 Introduction
Not just since the collapse of the US subprime market in summer 2007, much attention has given by policy-makers, scientists and the media to the linkage between financial markets and the real economy. In principle, the economic trend is an essential indicator for consumer confidence and growth prospects of companies, and in this way influences conditions and valuations on capital markets. In this function, the economic outlook particularly determines expectations with respect to operating profits and expansion measures of companies, costs of refinancing and ultimately to the required rate of return for potential investors.
Nevertheless, the huge dimension of the interdependency among economic forces is demonstrated by the current developments due to the worldwide financial crisis. Although this crisis derives its origin in a price collapse on US housing markets, its consequences affect both the world capital markets and the real economy. Via the channel of deteriorations of financial assets – particularly of stocks and asset backed securities (ABS) – the price collapse and a lack of transparency in the balances led to a loss of confidence within the banking sector. Due to a remarkable increase in the costs of refinancing on capital markets and the consequential tremendous liquidity problems across the worldwide banking sector, this progress caused tighter credit terms and higher refinancing costs even for the non-financial sectors. On the basis of a weakened order situation of the respective companies, the needs of labour forces considerably declined and required wide-ranging subsidy measures. In order to avoid an ongoing credit crunch and to prevent a collapse of constitutive parts of the financial system, both the international central banks and governments intervened in the financial markets by reducing key interest rates, injecting huge amounts of liquidity, providing guarantees and even executing partial nationalisations.
Apart from these crisis effects, current affairs signalise once again the complexity of economic interactions, which have been additionally enhanced by the ongoing globalisation on capital markets. Accordingly, demands on both scientists and implemented models tightened remarkably in order to gain reliable results and implications for decision makers. As a result, the conventional approach of using standardised models is no longer promising. On the basis of complex interdependencies and the well-known sensitivity of dynamic econometric models, it is necessary to employ a specified approach in order to be able to explain a small extract of economic interactions. For that reason, one main objective of this thesis is to use quantitative dynamic models which meet ambitious econometric requirements without neglecting the comparability of the respective countries or sectors under consideration. In the process, identical evaluation principles are chosen within each study in order to reduce possible deviations caused by divergent model specifications.
Objectives and Scientific Contributions
While much attention has focused on the modelling of the interdependencies between key aggregates and stock indices in industrialised countries, this thesis is focused on investments in emerging markets and real estate – two research branches that have up to now not been investigated to a comparable extent.
The analysis of individual scientific issues therefore contributes to improving the understanding of conditions and essential interrelationships in these markets and sectors.
Within the scope of the present thesis, the empirical results are mainly based on the Johansen (1988) procedure. The use of vector error correction models (VECM) guarantees that the dynamic character among the selected determinants is taken into account and furthermore allows the evaluation of both the long-term equilibrium relationships and the channels during the adjustment process after deviations from the long-term trend. In addition, the empirical results are verified by employing further analyses in order to gain deeper insights into the respective scientific issue.
In Chapter 2 the study examines “Macroeconomic Effects on Emerging Market Sector Indices”. As emerging countries continue to gain in importance for the world economy, it is worthwhile extending research into regions that have up to now been comparatively neglected. To the best of my knowledge, the common element of all existing papers on the interrelationships between emerging market investments and economic development is that country-specific interdependencies are analysed. The present study on the other hand departs from this viewpoint, which is limited to separate countries, and instead conducts a supranational analysis of the emerging market sector indices. This examination is therefore based on the assumption that constituents of each sector index are more closely linked to each other than to companies of other sectors contained in conventional national indices. This particularly applies to national stock indices of emerging countries which are largely dependent on one individual sector, as can often be observed in oil-exporting countries. In contrast, following the approach of employing a supranational sector analysis avoids possible distortions resulting from the index composition and allows the identification of sector-specific sensibilities to international economic development.
The empirical results indicate that the observed sectors are stimulated by the US Industrial Production Index and the Dow Jones Index in the long run. Via the channel of reduced purchasing power and consequently lower demand for US imports, the cross-sectoral comparison furthermore reveals adverse effects of growing US inflation on emerging market sectors.
However, contrary to the a priori defined hypotheses, the majority of the examined sectors benefited from increasing commodity prices during the examination sample. As a result, this finding provides empirical evidence on the suspicion that the ongoing catching-up process and the consequential growth in affluence in the emerging countries is largely driven by growing commodity prices and exports. According to that, not only those sectors which are closely linked to commodity trade activities benefit from rising prices. Instead, via the
channels of increasing consumption rates and growing domestic purchasing power within the emerging economies, the remaining sectors also benefit from the increase in export earnings.
In contrast to Chapter 2, which conducts a cross-sectoral comparison, the following chapters are focused on the real estate sector in particular. The scientific approach of Chapter 3 is similar to the first one and is focused on “The Link between Property and the Economy” in the German and British real estate markets. Taking account of the wide-ranging differences between both property markets with respect to market structure, conditions and performance, the findings contribute to improving the evaluation of long-term and short-term effects in two different financial regimes.
On a long-term basis, the results of the implemented VEC models indicate remarkable similarities between both examined real estate markets.
Accordingly, in spite of the outlined differences, the long-term equilibrium is determined by the same factors indicating the same signs and the same magnitude of coefficients. Consequently, the empirical results clarify that the fundamental role of property markets in an economy dominates country-specific characteristics in the long run. The distinctive features of the national property markets, however, are primarily relevant during the adjustment process after deviations from the long-term equilibrium. Despite the long-term similarities, the base rate in particular seems to be more important in the German than in the UK property market, where the financial system is known to be predominantly focused on funding by means of capital markets.
Although the economic environment is also considered in Chapter 4, this study is primarily aimed at the scientific issue of whether real estate stock indices in the United States and the United Kingdom are predominantly driven by the underlying property markets or by progress on general stock markets. Despite frequently mentioned benefits of real estate investments, such as high stability of value, comparatively low volatilities and opportunities to hedge against
inflation, investments in direct real estate nevertheless suffer from several disadvantages. Unlike stocks or bonds, neither the market volume nor the spectrum of the international real estate market has been developed to a sufficient extent up to now. In addition to issues of illiquidity, property investments are characterised by low information efficiency and insufficient market transparency. These drawbacks are noticeable in comparatively high information and transaction costs and therefore significantly reduce profit margins.
In the recent past, however, we have observed an ongoing expansion of securitised real estate. The listing on stock exchanges ensures that prices are calculated in real time and favours transparency on markets for real estate investments in this way. In addition, the division into shares reduces the minimum investment amounts and, by implication, the market entrance barriers for potential investors. A further consequence of listing on stock exchanges is that additional drivers – besides the development of the underlying properties – affect the performance and the risk/return structure of the listed asset to a significant extent. Consequently, the asset´s performance is dependent on current economic news, which implies that the company value is not spared from the general stock market risk, including incorrect analyst expectations and valuations. As the equity price is subject to supply and demand, it might therefore suffer from irrational behaviour on stock markets, for example due to exaggerations in phases of boom and bust, or caused by the well-known herding behaviour of investors.
For this reason, it is worthwhile considering whether real estate equities can still be characterised as real estate investments in their primary meaning and whether their distinctive features as an alternative investment still persist despite their listing on stock exchanges. For this purpose, an alternative approach is used. Instead of focussing only on the assets of real estate equities, direct real estate and stock indices – as was frequently done in previous studies – the macroeconomic environment is here explicitly taken into
account in each country. As real estate markets are known to be cyclical in nature (Lizieri et al., 1998), it is therefore supposed that the structure of market behaviour differs across phases of boom and bust. This might be recognisable by lower adjustment velocities after deviations from the equilibrium or by different volatilities of property values depending on the economic situation. For this reason, we presume a significant contribution of the macroeconomy to the explanation of developments on real estate markets in general and for analysing the features of real estate equities in particular.
On the basis of the outlined approach, the implemented methods indicate a significantly stronger linkage among the real estate assets compared to the equity assets in the long run. Therefore, this study clarifies that long-term investments in real estate equity indices still fulfil their function as an alternative investment in order to diversify an investor´s portfolio. This might be recognisable by low correlations to conventional assets and a more defensive risk/return structure compared to investments in general stocks.
2 Macroeconomic Effects on Emerging Market Sector Indices
First draft: December 2007 This version: November 2008
We would like to thank Marcel Marekwica, Barbara Richter and the seminar participants at the University of Regensburg for helpful comments and suggestions on previous drafts of this paper.
Abstract
This study supplies empirical evidence of the dynamic interactions between international macroeconomic determinants and ten emerging market sector indices. As so far empirical research follows the scientific approach of examining each country separately, this paper conducts a supranational sector analysis instead. Due to several economic and monetary crises we find structural breaks in nine of the ten sectors. Taking into account the consequential sub-periods, the sensibility of each sector index to macroeconomic influences is detected by the VECM findings which allows conclusions to be drawn about the sector-specific distinctions in the emerging markets. Contrary to theoretical expectations, the majority of the examined sectors benefited from increasing commodity prices during the examination sample. This finding therefore affirms that the ongoing catching-up process and the consequential growth in affluence in the emerging countries is largely driven by growing commodity prices and exports.
JEL Classification Code: G15
Key Words: Emerging markets, sector indices, macroeconomic variables, vector error correction models
2.1 Introduction
Particularly since the economic and monetary crises of the 1990s, emerging countries have continually been gaining importance for the world economy. In essence, this can primarily be recognised by intensified foreign trade relations with industrialised countries as well as by – particularly in recent times – growing trade activities among the emerging markets. This advancement is predominantly backed by huge commodity deposits which provide the basis for the occurred enlargement of export capacities. Consequently, increasing earnings due to these commodity trade activities lead to growing affluence, which in turn is recognisable by growing consumption rates and rising domestic purchasing power. This still ongoing catching-up process was additionally supported by increasing use of outsourcing measures by companies in industrialised countries. These companies have taken advantage of low wages, lower manufacturing costs and in the end higher profit margins. Furthermore, both the preparing and selling of commodities as well as the efficiency of the manufacturing process were additionally accelerated by the ongoing technological progress.
As companies in the emerging countries are likely to benefit in the course of the outlined catching-up process, international investors as well as scientific literature have focused on economic development and its impact on equity markets. To the best of our knowledge all existing studies concentrate on country-specific interdependencies between macroeconomic variables and the progress of the national stock market indices in the respective country. By using hitherto unconsidered data, this paper abandons the aforementioned scientific approach of examining each country separately and carries out a cross-national sector analysis instead.1 Within the scope of this study we therefore supply empirical evidence of the dynamic relationships between ten emerging market
1 As all examined sector indices and all macroeconomic factors are denominated in US dollars or refer to the US monetary zone, this examination is conducted from the viewpoint of a US investor.
sector indices and a set of international macroeconomic variables in the period from January 1995 to March 2007.
For this purpose, we examine whether cointegration exists in the VAR models.
The use of the error correction approach makes it possible to evaluate the long- term relationships as well as the short run dynamics separately. In addition, we employ the impulse response analysis and the variance decomposition in order to gain further insights into the dynamic interactions between sector indices and economic progress. Due to the fact that several economic and monetary crises occurred within the examination period, it is necessary to verify the stability of the regression coefficients over time. The identification of structural breaks and the analysis of consequential sector-specific subsamples make it possible to minimize potential crisis effects and thus to enhance the validity of the test results.
Based on the implemented procedures we find strong evidence of significant interactions between the US economy and emerging market sector indices.
Taking into account the distinctive features of each sector, the results are largely in line with the a priori defined hypotheses. However, as the vast majority benefited from increasing commodity prices during the examination sample, we conclude that the outlined catching-up process is predominantly backed by intensified commodity exports.
The remainder of this paper proceeds as follows. Section 2.2 reviews the related literature. Section 2.3 introduces the data and the model framework and hypothesises the theoretically expected relationships. Section 2.4 presents empirical evidence for the sector-specific subsamples after the occurred structural breaks. Section 2.5 concludes.
2.2 Review of Literature
Scientific literature has up to now concentrated on country-specific interdependencies. Numerous studies such as those by Fama (1981), Geske and Roll (1983) as well as Lee (1992) provide empirical evidence of significant influences of macroeconomic variables on the progress of stock markets.
According to Chen et al. (1986) these macroeconomic factors become risk factors in equity markets via the channels of future corporate cash flow, required rate of return and future dividends.
As emerging economies are becoming increasingly important for the world economy, various researchers have directed their attention to them in the recent past. Naka et al. (1998) use the VECM according to Johansen (1988)2 to examine the Indian stock exchange between 1960 and 1995. They conclude that the five examined variables are cointegrated, and that three long-term equilibrium relationships exist between the variables. The empirical results further indicate that industrial production represents the greatest positive and inflation the greatest negative determining factors that influence the Indian stock exchange. Wongbangpo and Sharma (2002) similarly provide evidence for the ASEAN-5 countries3 of significant influences of the selected macroeconomic risk factors. While the effects of the variables gross national product (positive) and consumer price index (negative) are uniform for all five countries during the examined period between 1985 and 1996, the algebraic signs of the variables money supply, interest rate and exchange rate vary depending on the country.
In the framework of his analysis of macroeconomic interdependencies in 21 emerging capital markets, Al-Khazali (2003) determines a long-term equilibrium between stock prices, consumer price index, and the real economic activity by
2 As several papers contribute to the development of the Johansen procedure as it is used within the scope of this study, the denoted year refers to the first paper of the VECM series by Johansen and Juselius.
3 The ASEAN-5 countries (= Association of Southeast Asian Nations) include Indonesia, Malaysia, Philippines, Singapore and Thailand.
using cointegration tests. Furthermore, this study supplies empirical evidence of a negative relationship between stock returns and inflation in the short-run. In their study of interdependencies on the Indian market between 1994 and 2003, Ray and Vani (2003) draw on a VAR model and an artificial neural network (ANN). The results reveal that the variables interest rate, industrial production, money supply, inflation rate and exchange rate have a significant influence on equity prices, while no significance is discovered for the variables of fiscal deficit and foreign investment. Furthermore, some separately examined sub- periods are dominated by individual variables such as money supply or the inflation rate.
Using the Johansen procedure in his study of the Jordanian stock exchange between March 1980 and December 2003, Al-Sharkas (2004) discovers the existence of a long-term equilibrium between stock price development and four selected macroeconomic factors. While inflation and interest rate exert a significantly negative influence on the markets, the author discovers a positive relationship between market trends and industrial production as well as between market trends and money supply. Erdem et al. (2005) make use of an EGARCH model to examine the spillover effects on the Turkish stock market between 1991 and 2004. Here they discover major effects of the variables of inflation and interest rates on all examined equity indices. Based on the variables of money supply (M1) and exchange rate, spillover effects can be seen on individual Turkish sector indices, while the industrial production variable on the other hand has no influence on the indices examined.
The common element in all of these papers is that country-specific interdependencies between macroeconomic variables and national index progress are analysed. This study on the other hand departs from this viewpoint, which is limited to separate countries, and instead conducts a supranational analysis of the emerging market sector indices. Our examination is therefore based on the assumption that constituents of each sector index are more closely linked to each other than to companies of other sectors contained
in conventional national stock indices. This particularly applies to national stock indices which are largely driven by one individual sector. One example in this context is represented by the MSCI Russia stock index, as the companies of the energy sector aggregate 64.8% of the entire index.4 Due to this index composition, effects of oil price variations would dominate effects in other sectors which implies that econometric analyses based on these indices would lead to unreliable economic implications. As a result, following the approach of employing a supranational sector analysis avoids these distortions and allows to identify the sector-specific sensibilities in the emerging countries to international economic development. In this way, we additionally gain findings whether these interdependencies correspond to those in industrialised countries.
2.3 Data Selection, Methodology and Hypotheses
2.3.1 Data
The econometric analysis is based on monthly data for the examination period between January 1995 and March 2007. The time series of the ten sector indices are provided by MSCI Barra, and the macroeconomic variables by Datastream.5 These variables are represented by the Dow Jones Index, the Federal Funds Rate, the US Industrial Production Index, the US Consumer Price Index as well as the Goldman Sachs Commodity Index.
The selection of the macroeconomic risk factors is based on theoretical assumptions and propositions of comparable empirical examinations. The reason for the preponderance of chosen macroeconomic US variables lies on the one hand in the fact that many of the emerging countries are closely linked
4 The denoted value refers to the morningstar database (as of December 2008).
5 The considered time series are available since 1995. The fact that MSCI carried out a reclassification of individual sectors in April 2000 and therefore during the examination period does not falsify the empirical results. Each of the sector indices was retroactively calculated on the basis of the specifications of the new classification method and is uniformly presented for the examination period according to the new calculation principles.
to the United States. This is noticeable, among other factors, through the linking of national currencies to the US dollar or through intensive foreign trade activity with the United States. On the other hand, due to their major importance for the global capital market, US fundamental data can be interpreted as essential determinants for the investment climate in international stock markets.
As emerging countries benefit from a wide range of commodities we use the Goldman Sachs Commodity Index (GSCI) in order to model the influences of the commodity and energy markets. This index represents a basket of commodity futures. By its special weighting of individual commodities the major significance of energy commodities is taken into account without neglecting agricultural and industrial commodities as well as precious metals. In this way, we prefer to examine the impact of a wide range of commodities to the conventional use of oil price time series as a proxy for the progress of energy prices.
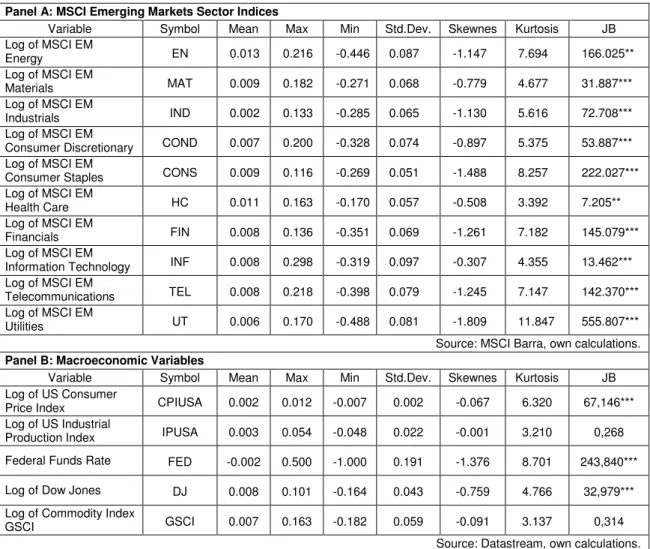
Table 2-1 outlines all time series used and presents the corresponding descriptive statistics for their first differences.6 Accordingly, Figure 2-2 (in Section 2.6.1) reveals the progress of each sector index during the period between January 1995 and March 2007. All time series are presented uniformly in US dollars and are transformed into natural logarithms. Due to its interest character the FED variable represents the only exception in this context and is therefore used without any transformation. Furthermore, the time series of the macroeconomic variables US Industrial Production Index and US Consumer Price Index are seasonally adjusted with the additive variant of the X12 procedure.
6 According to the definition of MSCI Barra, the following 27 countries are included in the emerging markets category: Korea, Taiwan, Brazil, South Africa, Russia, Mexico, China, India, Israel, Malaysia, Turkey, Thailand, Indonesia, Poland, Chile, Hungary, Czech Republic, Argentina, Egypt, Peru, Philippines, Colombia, Pakistan, Morocco, Jordan, Venezuela, Sri Lanka.
With the exception of the Federal Funds Rate, all variables display positive average growth rates during the examination period between January 1995 and March 2007. The results for the time series of all sector indices and for the macroeconomic variables US Consumer Price Index, Federal Funds Rate and Dow Jones Index uniformly display a bias to the left and leptocurtotic distributions. Furthermore, the Jarcque Bera test rejects the null hypothesis of normal distribution for these variables to the 99% level and for the sector index Health Care to the 95% level. The macroeconomic variables US Industrial Production Index and Goldman Sachs Commodity Index on the other hand are approximately normally distributed.
Table 2-1 Summary Statistics.
Panel A: MSCI Emerging Markets Sector Indices
Variable Symbol Mean Max Min Std.Dev. Skewnes Kurtosis JB
Log of MSCI EM
Energy EN 0.013 0.216 -0.446 0.087 -1.147 7.694 166.025**
Log of MSCI EM
Materials MAT 0.009 0.182 -0.271 0.068 -0.779 4.677 31.887***
Log of MSCI EM
Industrials IND 0.002 0.133 -0.285 0.065 -1.130 5.616 72.708***
Log of MSCI EM
Consumer Discretionary COND 0.007 0.200 -0.328 0.074 -0.897 5.375 53.887***
Log of MSCI EM
Consumer Staples CONS 0.009 0.116 -0.269 0.051 -1.488 8.257 222.027***
Log of MSCI EM
Health Care HC 0.011 0.163 -0.170 0.057 -0.508 3.392 7.205**
Log of MSCI EM
Financials FIN 0.008 0.136 -0.351 0.069 -1.261 7.182 145.079***
Log of MSCI EM
Information Technology INF 0.008 0.298 -0.319 0.097 -0.307 4.355 13.462***
Log of MSCI EM
Telecommunications TEL 0.008 0.218 -0.398 0.079 -1.245 7.147 142.370***
Log of MSCI EM
Utilities UT 0.006 0.170 -0.488 0.081 -1.809 11.847 555.807***
Source: MSCI Barra, own calculations.
Panel B: Macroeconomic Variables
Variable Symbol Mean Max Min Std.Dev. Skewnes Kurtosis JB
Log of US Consumer
Price Index CPIUSA 0.002 0.012 -0.007 0.002 -0.067 6.320 67,146***
Log of US Industrial
Production Index IPUSA 0.003 0.054 -0.048 0.022 -0.001 3.210 0,268
Federal Funds Rate FED -0.002 0.500 -1.000 0.191 -1.376 8.701 243,840***
Log of Dow Jones DJ 0.008 0.101 -0.164 0.043 -0.759 4.766 32,979***
Log of Commodity Index
GSCI GSCI 0.007 0.163 -0.182 0.059 -0.091 3.137 0,314
Source: Datastream, own calculations.
Notes: ***, **, * denote significance at 1%, 5%, and 10% confidence level, respectively.
JB = Jarque-Bera test on normality.
The evaluation of the standard deviations for the macroeconomic variables illustrates the exceptional position of the Federal Funds Rate, which is based on its function as an instrument of the Federal Reserve to intervene in the money market. Of all stock indices examined the time series of the Dow Jones displays the smallest standard deviation with a value of 0.043. In the sector comparison, the Consumer Staples (0.051) and Health Care (0.057) sectors have the lowest and the Information Technology (0.097) and Energy (0.087) sectors the highest values.
2.3.2 Cointegration and VECM
This paper is focused on the dynamic relationships between macroeconomic variables and sector indices of the emerging markets from the viewpoint of a US investor. For this purpose the cointegration concept is applied to vector autoregressive (VAR) models using the vector error correction framework (VECM) according to Johansen (1988).
The concept of cointegration is traced back to Granger (1981, 1986) and Engle and Granger (1987). It combines time-series analytical procedures with the concept of economic equilibrium, and facilitates the analysis of long-term equilibrium relationships between non-stationary variables. The cointegration analysis is based on the observation that economic variables often display common trend behaviour. This implies that linear combinations of these variables converge towards a common equilibrium in the long term, even though individual time series fluctuate over time. According to Engle and Granger (1987), time series are cointegrated if they display the same degree of integration and a linear combination of these variables is stationary.
Furthermore, the use of the time series in their levels guarantees that information losses due to the conventional use of first differences are avoided.
According to the Granger representation theorem, the dynamic adjustment process of cointegrated variables towards the long-term equilibrium relationship can be represented by an error correction model (ECM). In this way, long-term equilibrium relationships are combined with short-term dynamics.
Modelling of the non-stationary variables as a vector autoregressive (VAR) process Yt of finite order k forms the basis of the Johansen (1988) test procedure for cointegration. If at least two of the variables are cointegrated of the order of one, then the VAR(k) process can be reparametrised and written as a vector error correction model:
(2-1)
∆Yt is a (n x 1) vector of the first differences of stochastic variables Yt, and µ is a (n x 1) vector of the constants. The lagged variables are contained in vector Yt-1. The (n x n) matrices Гi represent the short-term dynamic. The coefficients of the cointegrating relationships (cointegration vectors) and of the error correction term are contained in the matrix π. In this way the long-term relationships between the variables are recorded (Nastansky, 2007).
π can be analysed as follows:
(2-2) ß represents a (n x r) matrix of the r cointegrating vectors. The (n x r) matrix α contains the so-called loading parameter, i.e. those coefficients that describe the contribution of the r long-term relationships in the individual equations. Here α and ß have full rank. It should be noted that the analysis of π is not definite. If in Equation (2-1) π is replaced by the Equation (2-2), then the error correction representation follows (vector error correction model, VECM).
(2-3)
2.3.3 Hypotheses
The expected equilibrium relations are formulated on the basis of the standard stock price valuation model:
(2-4)
Here P0 represents the equity price, E(CFt) the discounted future value of the expected cash flow, and kt the required rate of return. In accordance with Naka et al. (1998), the required rate of return kt consists of two fundamental components, namely the nominal, risk-free interest rate and the corresponding risk premium of each asset. According to Equation (2-4), macroeconomic developments have the effect of changing the expected cash flow and/or the required rate of return, and in this way influence equity prices.
Based on the standard valuation model, an increase in consumer prices implies an increase in nominal risk-free investment and in this way boosts the required rate of return kt (Maysami and Koh, 2000).As a result, rising inflation implicates rising energy costs, increasing wage claims as well as growing nominal capital expenditure. Since companies cannot adapt their nominally higher costs immediately, cash flows do not rise without delay to the same extent as inflation (De Fina, 1991). In the expected case of not being able to compensate for these inflation effects by enhancing companies´ productivity immediately, this functional chain ends in negative effects on equity prices. Thus, we do not assume that common stocks are an effective hedge against growing inflation.
Consequently, we expect a negative linkage between index performance and rising consumer prices.
Any type of output growth positively influences the expected future cash flow of companies (Naka et al., 1998). In a long-term view, economic growth implicates growing consumption rates and thus rising market potential. As a consequence
of this, the propensity to invest is increasing by implication. Finally, since US economic growth is an indicator of the global economy, the emerging markets are also likely to benefit from economic growth in the United States. In individual sectors, however, crowding-out effects by companies from industrialised countries could result. Assuming that companies expand their market share with increasing economic growth and by means of a decisive technological superiority at the expense of local companies, this can result in the opposite effect in emerging markets. Nevertheless, we assume that the first aspect prevails and therefore expect a positive linkage between growing industrial production in the United States and emerging market sector indices.
Evidence of the immense effect of changing the Federal Funds Rate on the global financial market is provided by Hamilton and Jordá (2002). Restrictive monetary measures by central banks burden the liquidity of market participants in the capital market. As increasing key interest rates implicate that credit terms tighten and thus negatively affect companies´ refinancing facilities, we expect negative effects of Federal Funds Rate hikes on equity prices.
As the Dow Jones Index is assumed to be the benchmark index of international stock markets we use this index within the scope of this paper as a determinant in the development of emerging market sector indices. According to the standard valuation model, the increase of the Dow Jones Index implicates rising cash flow expectations. Due to the evidence of existing contagion effects between international markets provided by King and Wadhwani (1990) it is therefore assumed that the performance of the emerging market sector indices is positively linked with the progress of the Dow Jones Index.
On the other hand, rising commodity prices put pressure on companies’
expected cash flows through higher operating costs. It is assumed that passing the higher costs on to consumers only occurs with a delay. Consequently, a negative relationship is expected between GSCI and the progress of the sector indices in principle. In this context an exceptional position is occupied by
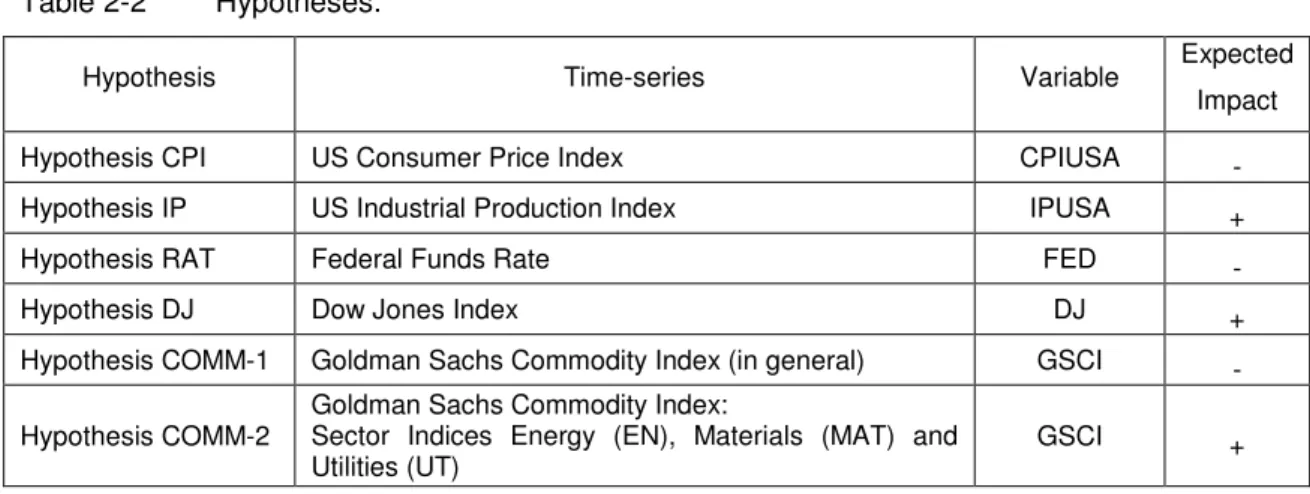
companies of the sectors Energy, Materials and Utilities. Due to their close linkage to commodity preparation and trading as well as in their capacity as energy suppliers, the companies of these sectors are particularly likely to be the first to profit from rising commodity prices. For that reason, we expect a positive linkage exclusively for constituents of the three mentioned sectors. Table 2-2 outlines the defined hypotheses.
Table 2-2 Hypotheses.
Hypothesis Time-series Variable Expected
Impact
Hypothesis CPI US Consumer Price Index CPIUSA -
Hypothesis IP US Industrial Production Index IPUSA +
Hypothesis RAT Federal Funds Rate FED -
Hypothesis DJ Dow Jones Index DJ +
Hypothesis COMM-1 Goldman Sachs Commodity Index (in general) GSCI - Hypothesis COMM-2
Goldman Sachs Commodity Index:
Sector Indices Energy (EN), Materials (MAT) and Utilities (UT)
GSCI +
2.4 Empirical Results
2.4.1 Cointegration Analysis
2.4.1.1 Structural Change
Due to the fact that numerous economic and currency crises occurred in emerging markets in the 1990s it can be assumed that the effects of these crises will influence the time series to a significant extent. The so-called Mexican tequila crisis of 1995, the Asian currency crisis of 1997, the Russian crisis of 1998 and the Brazilian economic and currency crisis of 1998/99 fall within the examination period, and may therefore be responsible for distortions within the time series. As a result, the elimination of crisis effects is necessary in order to improve the validity of the test results. Furthermore, taking into account possible structural breaks is of particular importance when applying cointegration techniques. Ignoring the existence of structural breaks in the deterministic trend leads to unreliable unit root test decisions and ultimately to the risk of misspecified estimation models (Perron, 1989).
Consequently, prior to the econometrical analysis, we apply a two-stage test procedure in order to verify the stability of the regression coefficients over time and to ensure the identification of structural breaks. Firstly, the time series are checked for the existence of structural breaks by means of CUSUM and CUSUMQ tests. Secondly, the Chow test verifies the dates which are determined by these test procedures. For that reason the Chow test is ultimately crucial in terms of the exact determination of the sub-periods.
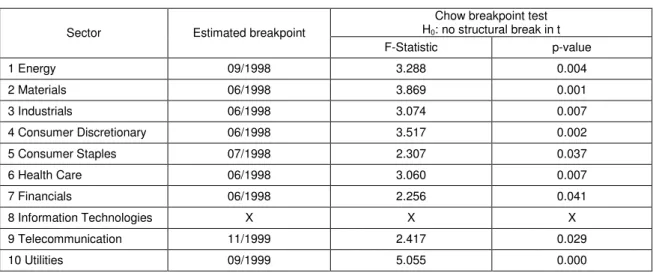
Table 2-3 presents the resulting dates of structural breaks for each sector model as well as the corresponding test statistics and p-values of the Chow test.
As transnational indices are analysed for the purposes of this study, it is also necessary to preclude possible distortions due to cluster risks. Accordingly, the progress of a sector index could be dominated by developments in overrepresented countries. With regard to the examined MSCI Emerging Market Sector Indices, constituents are widely spread over countries. Due to heavy foreign trade activities, as expected, companies of South Korea, Taiwan and companies of the BRIC countries, namely Brazil, Russia, India and China, cover the largest part of the sectors’ constituents. In this context, if anything, cluster risks could at most apply to the Energy and Health Care sectors, where Russian oil companies cover about 30% of the portfolio weighting and Israeli health care companies even more than 50% of the portfolio weighting.
Nevertheless, results are consistent over all sectors. This applies to both the tests for structural breaks and the ultimate VECM results. Therefore, we conclude that the implemented country composition of the individual sector indices does not lead to significant distortions or losses of information.
The test procedures discover structural breaks during the examination period for nine of the ten sector indices. The Information Technologies sector is the only exception here. The identified dates lie within the short period between June 1998 and November 1999. Against the background of numerous economic and currency crises in the emerging markets in the 1990s it is
presumed that there is a close connection between the crisis effects and dates of the structural breaks. Consequently, although we assume that there are individual countries which where relatively unaffected by the crises mentioned above, ignoring the detected structural breaks would lead to instable results and thus to unreliable economic implications. Therefore, we apply the cointegration framework and the Johansen (1988) procedure while taking into account of the consequential sector-specific sub-periods.
Table 2-3 Results of the Chow Breakpoint Test.
Chow breakpoint test H0: no structural break in t
Sector Estimated breakpoint
F-Statistic p-value
1 Energy 09/1998 3.288 0.004
2 Materials 06/1998 3.869 0.001
3 Industrials 06/1998 3.074 0.007
4 Consumer Discretionary 06/1998 3.517 0.002
5 Consumer Staples 07/1998 2.307 0.037
6 Health Care 06/1998 3.060 0.007
7 Financials 06/1998 2.256 0.041
8 Information Technologies X X X
9 Telecommunication 11/1999 2.417 0.029
10 Utilities 09/1999 5.055 0.000
Notes: X denotes that the implemented tests identify no structural breaks during the examination period. CUSUM and CUSUMQ tests as well as the Chow test are carried out on the basis of the ordinary least squares (OLS) method.
2.4.1.2 Unit Root Tests
Unit root tests facilitate the determination of the stationary nature of time series.
For the purposes of this examination the augmented Dickey-Fuller (ADF) test (Dickey and Fuller, 1979, 1981) and the Phillips-Perron (PP) test (Phillips, 1987, Phillips and Perron, 1988) are used. Here the null hypothesis of non-stationarity is tested against the alternative hypothesis of stationarity of the present time series.7 Within the scope of this paper we prefer the results of the PP test in case of deviating results. By virtue of the correction procedure according to
7 The test decisions are based on the critical values of MacKinnon (1991, 1996). The number of lags is determined in the framework of the ADF test with the aid of the Akaike information criterion (AIC), and the PP test is based on Newey-West (1994) bandwidth using Bartlett kernel.
Newey West (1994) as well as the Bartlett window, the PP test provides robust results both in the case of present autocorrelation and for time-independent heteroscedasticity (Perron, 1989).
By having regard to the sub-periods after the sector-specific structural breaks the ADF and PP tests come to the unanimous result that all time series are non- stationary in the levels and stationary in the first differences. All variables consequently display the same degree of integration.8 In this way, the cointegration analysis can be conducted on the basis of consistent time-series.
2.4.1.3 Cointegration Tests
In order to detect the existence of cointegrating relationships we employ the trace test and the maximum eigenvalue test. Determination of rank and estimation of the coefficients are performed as a maximum likelihood estimation. The corresponding likelihood-ratio test statistics are:
(2-5)
(2-6)
λ represents the estimated eigenvalues of the reduced rank of the matrix π. The sequential test strategy begins with r = 0 and is continued until the null hypothesis for a given significance level cannot be rejected for the first time.
The related value of r ultimately corresponds to the cointegration rank. In this way there are (n-r) stochastic trends in the system. In this study the corresponding critical values are used in accordance with Osterwald- Lenum (1992). Analogous to Nastansky (2007), due to the precisely formulated
8 The unit root test results of all examined sector models are available upon request.
alternative hypothesis, this examination prefers the results of the maximum eigenvalue test compared to those of the trace test.
Within the sector-specific examination periods at least one cointegrating relationship is detected by the applied cointegration tests.9 The choice of the underlying VAR models is based in the first stage on the recommendations of the Akaike information criterion (AIC), Schwarz information criterion (SC) and Hannan-Quinn information criterion (HQ). The recommended VAR models are examined by means of further diagnostic tests. Should autocorrelation and/or heteroscedasticity occur in the consequential VEC models, then we choose the next highest order. In all models examined, the use of this approach avoids misinterpretation of the test results due to occurring heteroscedasticity at the tolerable expense of losing a few monitoring points.10
2.4.2 VECM Results
2.4.2.1 Evaluation Principles
Our main objective is to detect the interrelationships between international macroeconomic factors and the progress of the emerging market sector indices with respect to significance and signs of coefficients. For that reason, we choose equal evaluation principles in order to allow for comparisons between all sector models.
Due to this approach the normalisation of the ß vectors depends on which factors are identified as significant.The identification of those individual factors which significantly contribute to explaining the sector-specific equilibrium is based on the results of the tests for linear restrictions (LR tests). By employing
9 To see the sector-specific results please refer to Chapter 2.6.2.
10 However, prior to this decision, it is necessary to conduct further analyses in order to preclude the possibility that other reasons, such as high values of correlation among the selected variables, are responsible for the significant deviations from the null hypothesis of the White test.
LR tests we verify whether individual coefficients could be restricted to zero without accepting significant information losses. In case of being significant the sector indices are normalised to one in order to be able to evaluate the sector- specific nexus to the macroeconomic determinants in the long run. If this does not apply to individual vectors we restrict the respective sector index to zero. In this instance information is only provided via the coefficients related to the adjustment process.
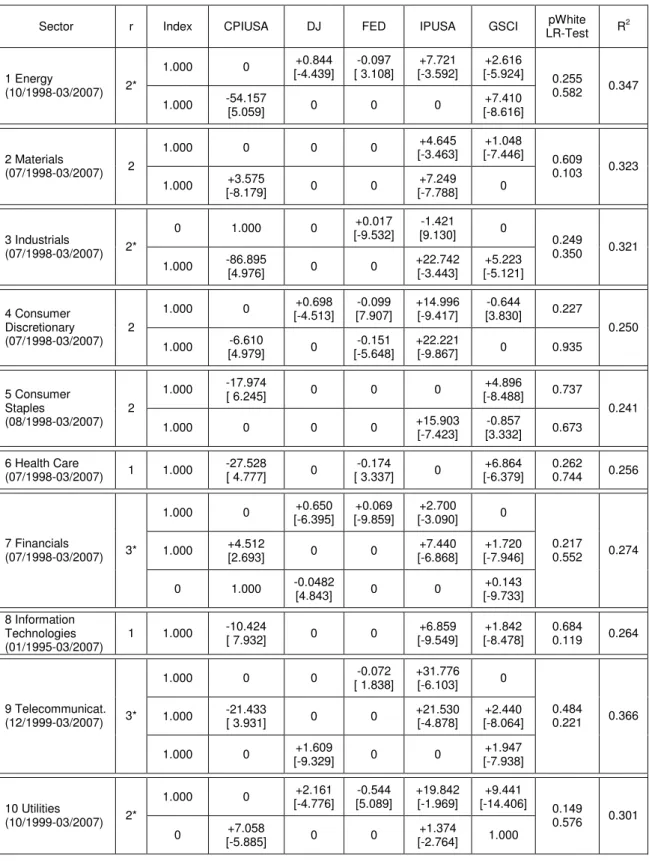
The long-term equilibrium relationships for the sector-specific subsamples after the structural breaks are outlined in Table 2-4.11 Coefficients within each vector are already converted so that relationships between the normalised variable and the risk factors can be identified directly as positive or negative.
As displayed, we take into account the case of multidimensional cointegrating relationships within the scope of our examination. The implemented restrictions are accepted by the LR tests indicating that these restrictions do not lead to significant losses of information. Furthermore, the p-values of the White tests consistently reveal that the risk of distorted VECM results due to heteroscedasticity is eliminated.12
11 For reasons of clarity we do not report the corresponding constant c and the ε as a proxy for the error term.
12 The estimated models are free of possible hazards caused by occuring autocorrelation occurring within the residuals, too, although this is not explicitly mentioned in Table 2-4.