https://doi.org/10.5194/bg-14-3603-2017
© Author(s) 2017. This work is distributed under the Creative Commons Attribution 3.0 License.
Impact of trace metal concentrations on coccolithophore growth and morphology: laboratory simulations of Cretaceous stress
Giulia Faucher1, Linn Hoffmann2, Lennart T. Bach3, Cinzia Bottini1, Elisabetta Erba1, and Ulf Riebesell3
1Earth Sciences Department “Ardito Desio”, Università degli Studi di Milano, Milan, Italy
2Department of Botany, University of Otago, Dunedin, New Zealand
3Biological Oceanography, GEOMAR Helmholtz Centre for Ocean Research Kiel, Kiel, Germany Correspondence to:Giulia Faucher (giulia.faucher@unimi.it)
Received: 12 April 2017 – Discussion started: 21 April 2017
Revised: 27 June 2017 – Accepted: 29 June 2017 – Published: 31 July 2017
Abstract.The Cretaceous ocean witnessed intervals of pro- found perturbations such as volcanic input of large amounts of CO2, anoxia, eutrophication and introduction of bio- logically relevant metals. Some of these extreme events were characterized by size reduction and/or morphological changes of a few calcareous nannofossil species. The cor- respondence between intervals of high trace metal concen- trations and coccolith dwarfism suggests a negative effect of these elements on nannoplankton biocalcification pro- cesses in past oceans. In order to test this hypothesis, we explored the potential effect of a mixture of trace metals on growth and morphology of four living coccolithophore species, namely Emiliania huxleyi, Gephyrocapsa ocean- ica, Pleurochrysis carterae andCoccolithus pelagicus. The phylogenetic history of coccolithophores shows that the se- lected living species are linked to Mesozoic species showing dwarfism under excess metal concentrations. The trace met- als tested were chosen to simulate the environmental stress identified in the geological record and upon known trace metal interactions with living coccolithophore algae.
Our laboratory experiments demonstrated that elevated trace metal concentrations, similarly to the fossil record, af- fect coccolithophore algae size and/or weight. Smaller coc- coliths were detected inE. huxleyiandC. pelagicus,while coccoliths ofG. oceanicashowed a decrease in size only at the highest trace metal concentrations. P. carterae coccol- ith size was unresponsive to changing trace metal concen- trations. These differences among species allow discriminat- ing the most- (P. carterae), intermediate- (E. huxleyiandG.
oceanica) and least-tolerant (C. pelagicus) taxa. The fossil
record and the experimental results converge on a selective response of coccolithophores to metal availability.
These species-specific differences must be considered be- fore morphological features of coccoliths are used to recon- struct paleo-chemical conditions.
1 Introduction
Trace metal concentrations influence the productivity and species composition of marine algae communities (Bruland et al., 1991; Sunda and Huntsman, 1998). A number of trace metals are important micronutrients (e.g., zinc, iron, copper, nickel), but some of them can become toxic and inhibit ma- rine algal productivity at elevated concentrations (Brand et al., 1986; Sunda and Huntsman, 1992). Others like lead and mercury have no known metabolic functions and can hamper marine phytoplankton growth already at low concentrations (Sunda, 1989; Sunda et al., 2005).
The geological record offers the opportunity to investi- gate past case histories marked by profound changes in the ocean, such as volcanic injection of large amounts of CO2, ocean anoxia, eutrophication and introduction of biologically relevant metals (e.g., Larson and Erba, 1999; Erba, 2004;
Jenkyns, 2010; Erba et al., 2015). These events can be seen as “natural experiments” useful to decrypt the ecosystem re- sponse to major perturbations at timescales longer than cur- rent modifications. Finding out how the changes in seawater composition affect marine biota requires the integration of a long-term and large-scale geological perspective that has been recognized as an essential ingredient for more coherent
predictions of how marine organisms might react to future environmental changes. Insights on ocean–atmosphere dy- namics under warmer-than-present-day conditions predicted for the end of this century can be obtained by including geo- logical data of past ecosystems, especially those derived from cases of extreme conditions. Well-known perturbations were the oceanic anoxic events (OAEs) which took place during the Mesozoic. These events were caused by intense volcan- ism that produced large igneous provinces (LIPs; Snow et al., 2005; Neal et al., 2008; Pearce et al., 2009; Erba et al., 2015) that released magmatic fluids delivering metals, mixed with warmed ambient seawater that had enough buoyancy to rise to the surface (Snow et al., 2005; Erba et al., 2015). During the latest Cenomanian OAE 2, for example, less volatile ele- ments, such as nickel and iron (released during the formation of the Caribbean LIP), increased by 8–20 times above sea- water background levels while more volatile elements like lead and cadmium (derived from water–rock exchange reac- tions) increased by about 4-8 times above background level (Orth et al., 1993; Snow et al., 2005). Entering the ocean environment, more and less volatile elements became bio- logically relevant as evidenced by changes and turnover in marine plankton communities (Leckie, 1985; Leckie et al., 1998; Erba, 2004; Erba et al., 2015).
Studies on calcareous nannofossils documented a size re- duction of some coccolithophore species (Biscutum con- stans,Zeugrhabdotus erectusandDiscorhabdus rotatorius) that are coeval with trace metal concentration peaks across both the early Aptian OAE 1a and latest Cenomanian OAE 2 (Erba et al., 2015; Faucher et al., 2017). The fossil record shows that, although most of the Mesozoic nannoplankton taxa did not survive the mass extinction event at the end of the Cretaceous, reconstructed phylogenetic trees (Bown et al., 2004), based on morphological observations of coc- colith (shape and ultrastructure), and molecular trees, mostly based on rDNA (de Vargas and Probert, 2004), indicate a link between selected Mesozoic groups and some living coccol- ithophores. The group to which the four species tested here belong to, namelyEmiliania huxleyi, Gephyrocapsa ocean- ica, Coccolithus pelagicusandPleurochrysis carterae, evo- lutionarily diverged from one another since the Late Cre- taceous, with the exception of E. huxleyi and G. ocean- ica that are separated since 250 000 years ago (De Vargas et al., 2007; Liu et al., 2010). Specifically, genera Emilia- niaandGephyrocapsabelong to the Cenozoic family Noe- laerhabdaceae derived from the extinct Prinsiaceae that, in turn, branched off the Mesozoic family Biscutaceae. Indeed, coccolith dwarfism was observed in genus Biscutumduring times of high CO2and metal concentrations in both OAE 1a and OAE 2 (Erba et al., 2010; Faucher et al., 2017). It is chal- lenging to unambiguously disentangle the cause(s) of such changes in the fossil record, but evidence of a correspon- dence between intervals of high trace metal concentrations and coccolith dwarfism suggests a negative effect of these elements on nannoplankton biocalcification processes.
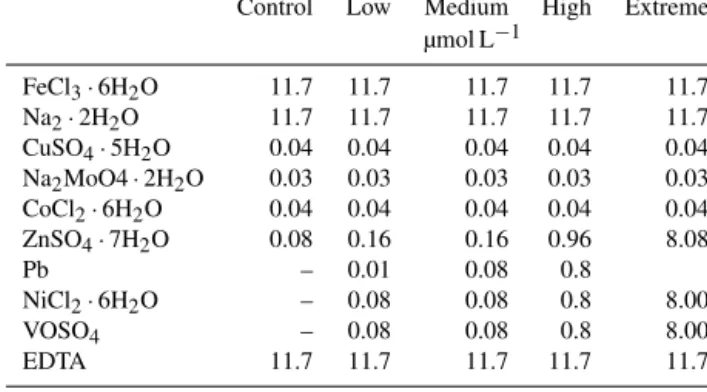
Table 1.Trace metal concentrations in the growth medium of the different treatments.
Control Low Medium High Extreme µmol L−1
FeCl3·6H2O 11.7 11.7 11.7 11.7 11.7 Na2·2H2O 11.7 11.7 11.7 11.7 11.7 CuSO4·5H2O 0.04 0.04 0.04 0.04 0.04 Na2MoO4·2H2O 0.03 0.03 0.03 0.03 0.03 CoCl2·6H2O 0.04 0.04 0.04 0.04 0.04 ZnSO4·7H2O 0.08 0.16 0.16 0.96 8.08
Pb – 0.01 0.08 0.8
NiCl2·6H2O – 0.08 0.08 0.8 8.00
VOSO4 – 0.08 0.08 0.8 8.00
EDTA 11.7 11.7 11.7 11.7 11.7
Previous work on the response of living coccolithophores to trace metal concentrations focused onEmiliania huxleyi, one of the most abundant species in the world ocean with a nearly global distribution (Westbroek et al., 1989; Winter et al., 2014). Experiments documented a decreasing growth rate under high trace metal concentrations (Vasconcelos et al., 2001; Hoffmann et al., 2012; Santomauro et al., 2016).
So far, no such studies have been performed on other coccol- ithophore species. Furthermore, to our knowledge, this is the first study investigating the effect of high trace metal concen- trations on coccolithophore and coccolith morphology and size. The trace metals tested (Zn, V, Ni, Pb) were chosen based on peaks identified in the geological record (Snow et al., 2005) and known trace metal interactions with living coc- colithophores to simulate the environmental conditions dur- ing OAEs. The main goal of this study is to understand if, similarly to the fossil record, anomalously high quantities of essential and/or toxic metal induce changes in coccol- ith shape and size and cause coccolith dwarfism in coccol- ithophore species.
More specifically, we address the following questions:
(i) does coccolithophore growth change in response to in- creasing trace metal concentrations? (ii) Does coccolith size and morphology, as well as coccolithophore size, change in response to high and anomalous trace metal concentrations?
(iii) Do trace metal combinations, which mimic OAE condi- tions, lead to a uniform response among species or to species- specific responses on morphological features? (iv) Do coc- colith morphometrical features have a potential to serve as a proxy to reconstruct paleo-ocean trace metal concentrations?
2 Materials and methods 2.1 Culture conditions
Monospecific cultures of the coccolithophores Emiliania huxleyi(strain RCC 1216),Gephyrocapsa oceanica (strain RCC 1303), Coccolithus pelagicus (strain PLY182G) and Pleurochrysis carterae (no known strain number) were
grown as batch cultures in artificial seawater produced as described by Kester et al. (1967). The artificial sea- water medium was enriched with 64 µmol kg−1 nitrate, 4 µmol kg−1 phosphate to avoid nutrient limitations, f/8 concentrations for vitamins (Guillard and Ryther, 1962), 10 nmol kg−1of SeO2and 2 mL kg−1of natural North Sea water (Bach et al., 2011). The carbonate chemistry was ad- justed by bubbling with CO2-enriched air overnight to rein- troduce inorganic carbon, thereby reaching atmospheric CO2 partial pressure (∼400 µatm). All culture bottles were manu- ally and carefully rotated three times a day, each time with 20 rotations in order to avoid cell settling. In the control treat- ment, the medium was enriched withf/8 concentrations for trace metals (Guillard and Ryther, 1962).
Pb, Zn, Ni and V concentrations were added in low (L), medium (M), high (H) and extreme treatments be- cause of their high concentrations identified in the Aptian OAE 1a (Erba et al., 2015) and Cenomanian–Turonian OAE 2 (Snow et al., 2005; Table 1). The trace metal chelator EDTA (ethylenediaminetetraacetic acid) was added to the trace metal stock solutions in order to guarantee a con- stant level of bioavailable trace metals for phytoplankton and prevent metal precipitation. The cultures were incu- bated in a thermo-constant climate chamber (Rubarth Ap- parate GmbH) at a constant temperature of 15◦C, a 16:8 (hour : hour) light–dark cycle and at a photon flux density of 150 µmol photons m−2s−1.
The cultures were pre-exposed to the different treatment conditions (acclimation period) for 7–10 generations, which varied between 6 and 10 days depending on the species- specific cell division rates. All cultures were incubated in autoclaved 500 mL square glass bottles (Schott Duran). The initial cell density was relatively low with ∼50 cells mL−1. Final samples were taken when cells were still in their ex- ponential growth phase and cell numbers were low enough to avoid a strong change in the chemical conditions of the growth medium. Therefore, the experimental duration dif- fered among species and among treatments (between 6 and 10 days) due to the different growth rates. Each treatment was replicated three times. Final cell densities in the ex- periment did not exceed 50 000 cells mL−1 in E. huxleyi, 20000 cells mL−1inG. oceanica,and 3000 cells mL−1inC.
pelagicusandP. carterae.
2.2 Cell abundance and growth rate
Samples for cell abundance were taken every 2nd day with the exception of the control treatment where samples were only taken at the end of the experiment. Incubation bottles were gently turned 10 times in order to obtain a homoge- nous suspension of the cells before sampling. Cell numbers were immediately measured three times without addition of preservatives using a Beckman Coulter Multisizer. Spe- cific daily growth rates (µ)were calculated from the least- squares regression of cell counts versus time during expo-
0 100 200 300 400
10 100 1000 10 000
V olume (μm )3
Counts
Normal sample Acidified sample
Figure 1.Example of Multisizer volume spectra. Black line: spec- tra ofC. pelagicuspopulation (coccolith spectrum and coccosphere spectrum); gray line:C. pelagicuscoccolith-free cell after treatment with HCl.
nential growth (Eq. 1):
µ=lnc1−lnc0
t1−t0 , (1)
wherec0 andc1 are the cell concentrations at the beginning (t0) and at the end of the incubation period (t1), respectively.
2.3 Coccosphere and cell sizes
Cell abundance samples were acidified with 0.1 mmol L−1 HCl to dissolve all free and attached coccoliths and subse- quently measured three times in order to obtain cell diame- ters and volumes (Müller et al., 2012). In this study, we define the coccosphere volume as the coccolith-bearing cell volume and the cell volume as the coccolith-free cell volume. There- fore, the volume of the calcitic portion of the coccosphere (VCP) was estimated as follows:
Volume of the calcitic portion of the coccosphere (VCP)
=coccosphere volume - cell volume.
Coccolith volume and free coccolith concentrations were also determined forC. pelagicus(Fig. 1).
2.4 Coccolith dimensions and malformations 2.4.1 Scanning electron microscopy (SEM)
Samples were taken from each of the 48 incubation bottles.
5–10 mL of sample were filtered by gravity on polycarbon- ate filters (0.2 µm pore size) and dried directly after filtration at 60◦C. Samples were sputtered with gold–palladium. SEM analysis was performed at the Earth Sciences department of the University of Milan with SEM Cambridge Stereoscan 360. For each sample, 50 specimens were digitally captured and subsequently analyzed with ImageJ software. All pic- tures were taken with the same magnification (5000x), and
Low Medium High Control
a
( ) (b) (c) (d)
)
(d (e) (f) (g)
(k) )
(j )
(i (h)
)
(l (m) (n) (o)
Plate 1. Example of the coccoliths of the four species tested un- der different trace metal concentrations.(a–d)E. huxleyi;(e–h)G.
oceanica;(i–l)C. pelagicus;(m–p)P. carterae.
the scale bar given on SEM pictures was used for calibration (Plate 1).
2.4.2 Coccolith dimensions andE. huxleyi malformation
We measured the length of the distal shield (DSL) and the width of the distal shield (DSW) manually using the public domain program Fiji distributed by ImageJ software (Schin- delin et al., 2012). The distal shield area (DSA) was calcu- lated, assuming an elliptical shape of the coccolith, as (Eq. 2) DSA=5DSL×DSW
4 . (2)
Assuming an elliptical shape has been shown to yield near- identical results to direct measurements of DSA inE. huxleyi (Bach et al., 2012).
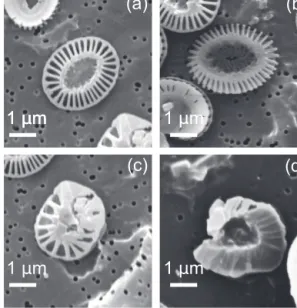
Malformations were determined forE. huxleyisince in the filters analyzed with SEM coccoliths were very abundant and allow a visual comparison of 100 individual coccoliths for every sample. We sorted the degree of malformation in sev- eral categories: our categories were used to describe the mor- phology of E. huxleyi as “normal”, “malformed”, “incom- plete”, and “incomplete and malformed” coccoliths (Langer et al., 2010; Langer and Bode, 2011; for reference images for the categories, see Fig. 2). We considered normalE. huxleyi coccolith with regular shape and well-formed distal shield elements forming a symmetric rim; malformed, malformed
1 μm
1 μm 1 μm
1 μm 1 μm 1 μm
(a) (b)
(c) (d)
Figure 2.SEM images ofEmiliania huxleyicoccoliths.(a)Nor- mal coccolith;(b)incomplete coccolith;(c)malformed coccolith;
(d)malformed and incomplete coccolith.
coccolith shape or malformed shape of individual elements;
incomplete, coccolith with variations in its degree of com- pletion; and malformed and incomplete, coccolith with mal- formed shape and variations in its degree of completion.
2.5 Statistics
Prior to statistical analyses, data were tested for normality and homogeneity of variances. To test the null hypothesis the average values of parameters from triplicate cultures were compared between treatments. Meanµvalues, coccosphere and cell diameters, VCP and coccolith sizes of each treat- ment were compared to the control and among each other.
A one-way analysis of variance was used to determine sta- tistical significance of the main effect of trace metals on the variables. A Tukey post-hoc test was used to identify the source of the main effect determined by ANOVA to as- sess whether differences inµand sizes between trace metal treatments were statistically significant. Statistical treatments of data were performed using R software. Statistical signifi- cance was accepted forp< 0.05.
3 Results 3.1 Growth rate
In the treatment with extreme trace metal concentrations up to 8 µmol L−1, none of the four species tested survived the acclimation phase. InL,MandH treatments, however,E.
huxleyi, G. oceanica, C. pelagicus andP. carterae all sur- vived. However, the addition of trace metals decreased the growth rate ofE. huxleyi,G. oceanicaandC. pelagicuscom-
Table 2.µis the growth rate, coccosphereD(µm) is the coccosphere diameter, cellDis the cell diameter (µm) and VCP is the volume of the calcitic portion (d−1) of the coccosphere (µm3). Significance was tested using an ANOVA and a Tukey post-hoc test (p< 0.05). Asterisks indicate significant difference from the control treatment.
E. huxleyi G. oceanica
Control Low Medium High Control Low Medium High
µ 1.22 1.12∗ 1.16 1.10∗ 0.66 0.58∗ 0.60∗ 0.58∗ Coccosphere D 4.88 4.45∗ 4.44∗ 4.48∗ 7.25 6.58∗ 6.60∗ 6.14∗
Cell D 4.22 4.04 4.08 4.05 5.45 5.18∗ 5.19∗ 4.74∗
VCP 20.98 11.78∗ 10.01∗ 12.83∗ 101.02 75.48∗ 77.41∗ 62.96∗
C. pelagicus P. carterae
Control Low Medium High Control Low Medium High
µ 0.56 0.42∗ 0.43∗ 0.43∗ 0.52 0.57∗ 0.56∗ 0.57∗ Coccosphere D 19.82 17.12∗ 17.05∗ 16.85∗ 11.70 12.11∗ 11.88 11.99∗
Cell D 15.65 10.10∗ 10.46∗ 10.38∗ 9.03 8.93 9.02 8.98
VCP 1760 2102∗ 2036∗ 1954∗ 463 570∗ 500 533∗
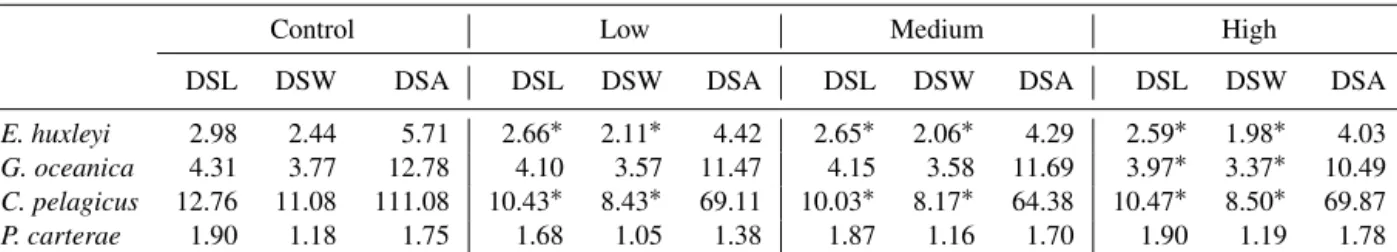
Table 3.Coccolith distal shield length (DSL, µm) and distal shield width (DSW, µm) average values and calculated distal shield area (DSA, µm2)for all experiments. Asterisks indicate significant difference from the control treatment. Significance of DSL and DSW was tested using an ANOVA and a Tukey post-hoc test (p< 0.05). Asterisks indicate significant difference from the control treatment.
Control Low Medium High
DSL DSW DSA DSL DSW DSA DSL DSW DSA DSL DSW DSA
E. huxleyi 2.98 2.44 5.71 2.66∗ 2.11∗ 4.42 2.65∗ 2.06∗ 4.29 2.59∗ 1.98∗ 4.03 G. oceanica 4.31 3.77 12.78 4.10 3.57 11.47 4.15 3.58 11.69 3.97∗ 3.37∗ 10.49 C. pelagicus 12.76 11.08 111.08 10.43∗ 8.43∗ 69.11 10.03∗ 8.17∗ 64.38 10.47∗ 8.50∗ 69.87
P. carterae 1.90 1.18 1.75 1.68 1.05 1.38 1.87 1.16 1.70 1.90 1.19 1.78
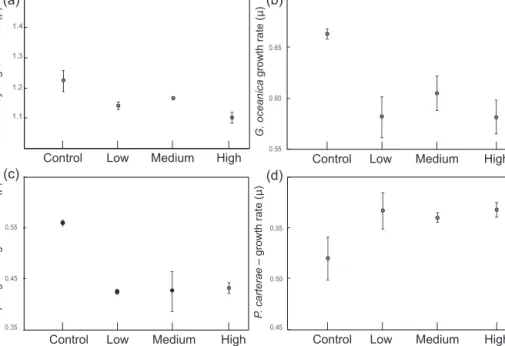
pared to the control treatment. E. huxleyi growth rate was 1.22 d−1 in the controls and 1.12, 1.16 and 1.10 d−1 inL, M andH trace metal concentration treatments respectively (Table 2; Fig. 3a).G. oceanicagrowth rate was 0.66 d−1in the controls. In L,M and H the growth rate was signifi- cantly lower compared to the control at values of 0.58 d−1 inL, 0.60 d−1inMand 0.58 d−1inH(Table 2; Fig. 3b).C.
pelagicus had an average growth rate in the control experi- ment of 0.56 d−1. The growth rate was significantly lower in L, M and H compared to the control with values of 0.42 d−1 and 0.43 d−1inMandH on average (Table 2; Fig. 3c). In contrast,P. carteraeshowed an increase in growth rate with trace metal addition compared to the control. In the control treatment, the growth rate was 0.52 d−1and is significantly lower compared toL,MandHtreatments with growth rates of 0.57, 0.56 and 0.57 d−1respectively (Table 2; Fig. 3d).
3.2 Coccosphere and cell sizes and volume of the calcitic part of the coccosphere
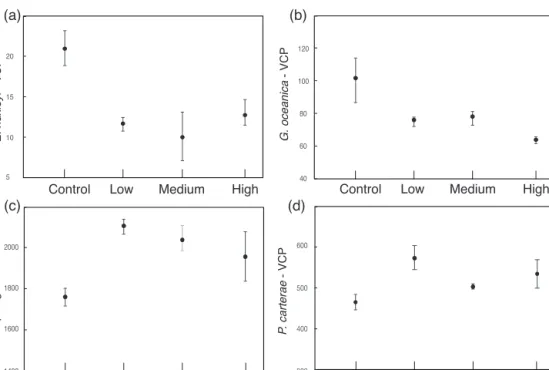
InE. huxleyi,the mean coccosphere diameters were signifi- cantly lower in theL,M, andHtreatments compared to the control (mean diameter 4.88 µm; Table 2, Fig. 4a). The VCP
was reduced under all increased trace metal treatments com- pared to the control conditions (Table 2; Fig. 5a), with the lowest VCP recorded in theMtreatment.
In G. oceanica, the coccosphere diameters were largest in the control treatment (mean diameter 7.25 µm; Table 2;
Fig. 4b).L,M andH coccosphere diameters were signifi- cantly smaller compared to the control. Specifically,L and M show similar values of 6.58 and 6.60 µm, respectively, whileH shows the lowest coccosphere diameter of 6.14 µm (Table 2). Similarly, cell diameters were significantly larger in the control treatment (5.45 µm), intermediate inLandM (L=5.18 µm; M=5.19 µm), and smaller in H (4.74 µm).
Furthermore, the coccosphere and cell diameters were sig- nificantly smaller inHcompared toLandM. The VCP was significantly reduced under increased trace metal concentra- tions compared to control conditions (Fig. 5b), with similar coccosphere VCPs recorded in bothL,MandH.
C. pelagicuscoccosphere and cell diameters were signif- icantly larger in the control (19.82 and 15.65 µm, respec- tively) compared to L (17.12 and 10.10 µm, respectively), M (17.05 and 10.46 µm, respectively) and H (16.85 and 10.38 µm, respectively; Table 2; Fig. 4c). However, a signif- icant increase in coccosphere VCP was observed from 1760
1.1 1.3 1.4
Control Low Medium High
E. huxleyi – growth rate (μ)(a) (b)
(c) (d) Control Low Medium High
0.65
0.60
0.55
G. oceanica growth rate (μ)
Control Low Medium High
0.55
0.45
C. pelagicus – growth rate (μ)0.35
Control Low Medium High
0.45 0.50 0.55
P. carterae – growth rate (μ)
1.2
Figure 3.Average growth rate; all measurements are done in triplicates; error bars denote standard deviation. If not visible, error bars are smaller than symbols.(a)E. huxleyi;(b)G. oceanica;(c)C. pelagicus;(d)P. carterae.Note the different scales on theyaxis.
in the control to 2102, 2036 and 1954 in the L,M andH treatments, respectively (Fig. 5c, Table 2).
P. carteraeshowed a smaller coccosphere diameter in the control compared to theL,MandHtreatments. The cocco- sphere diameter inLandH(L=12.11 µm;H=11.99 µm) is significantly bigger compared to the control (coccosphere diameter 11.70 µm). InM, the coccosphere has a mean diam- eter ofM=11.88 µm (Fig. 4d). On the other hand, the cell diameters were very similar among all treatments. The VCP was slightly lower in the control compared to the other three treatments (L,MandH; Table 2.; Fig. 5d).
3.3 Coccolith size andC. pelagicuscoccolith concentrations
E. huxleyi coccoliths were longer and wider in the control treatment compared to the other three treatments (Table 3).
Increasing trace metal content reduced coccolith length and width significantly (p< 0.05), and the high trace metal treat- ment showed the lowest distal shield length and distal shield width coccolith size. InG. oceanicacoccoliths were longer and wider in the controls compared to the other three treat- ments (Table 3). However, only inH, coccolith were signifi- cantly smaller (p< 0.05) compared to the control treatment.
Table 4.FreeC. pelagicuscoccolith concentration measured with the Beckman Coulter Multisizer;r=replicates.
Replicate Free Replicate Free
coccolith coccolith
number number
r1 2112 r1 9017
Control r2 2297 Medium r2 10 046
r3 2972 r3 12 325
r1 8876 r1 13 089
Low r2 7734 High r2 11 523
r3 8358 r3 11 350
C. pelagicuscoccoliths in the L,M andH trace metal treatments were significantly smaller compared to the con- trol replicates (Table 3). Furthermore, a higher number of free coccoliths was present in the trace metal treatments com- pared to the control replicates (Table 4), and free coccoliths progressively increased with increasing trace metal content.
P. carterae coccoliths showed very similar sizes in all the four treatments (Table 3).
3.4 Emiliania huxleyicoccolith malformation
Scanning electron microscope analyses ofE. huxleyicoccol- iths showed changes in the proportion of malformed and in- complete coccoliths. Specifically, malformations and incom- plete coccoliths of E. huxleyi increased in all trace metal treatments (L,M andH concentrations) by about 20–35 % compared to the control treatment (Fig. 6).
Control Low Medium High
6.50 7.00
6.00 5.50 5.00
G. oceanica - diameter (μm) 4.50
(a)
(c)
(b)
(d)
5.00
4.50
4.00
3.50 Control Low Medium High
E. huxleyi - diameter (μm)
Control Low Medium High
9.00 13.00 11.00 15.00 17.00 19.00
C. pelagicus - diameter (μm)
Control Low Medium High
12.00 11.00 10.00 9.00 8.00
P. carterae - diameter (μm)
Figure 4.Average values of the coccolithophore diameters (black dots) and cell diameters (gray dots). All measurements were done in triplicates; error bars denote standard deviation. If not visible, error bars are smaller than symbols.(a)E. huxleyi;(b)G. oceanica;(c)C.
pelagicus;(d)P. carterae.Note the different scales on theyaxis.
C. pelagius - VCP
(a)
(c)
(b)
(d)
Control Low Medium High
2000
1800
1600
1400 15 20
10
5 Control Low Medium High
E. huxleyi - VCP
Control Low Medium High
40 60 80 100 120
G. oceanica - VCP
300 400 500
Control Low Medium High
600
P. carterae - VCP
Figure 5.Average volume of the calcitic portion of the coccosphere (VCP). All measurements were done in triplicates; error bars denote standard deviation. If not visible, error bars are smaller than symbols measured for each replicate:(a)E. huxleyi;(b)G. oceanica;(c)C.
pelagicus;(d)P. carterae.Note the different scales on theyaxis.
0 % 20 % 40 % 60 % 80 % 100 %
Control Low Medium High
Normal Malformed Incomplete Incomplete and malformed
Figure 6. Malformation percentage. Percentages of normal, mal- formed, incomplete, and incomplete and malformed coccoliths of E. huxleyiversus trace metal concentrations.
cell
Control treatment
Coccosphere E.huxleyi
L - M - H
= Cell diameter R educed
coccosphere diameter
( a)
S mall coccolith
R educed cell diameter G. oceanica
L - M R educed
coccosphere diameter
= Coccolith size
( b )
R educed coccosphere
diameter
S mall coccolith G. oceanica
H
R educed cell diameter
( c)
R educed coccosphere
diameter
C. pelagicus L - M - H
S mall coccolith I ncreased number of coccolith per cell R educed cell
diameter
( d)
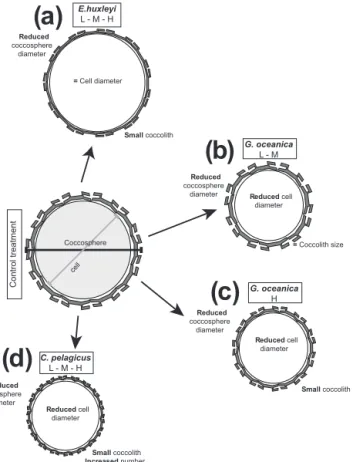
Figure 7.Species-specific responses to trace metal enrichment.
4 Discussion 4.1 Growth rate
Whereas in the extreme trace metal treatment none of the species survived the acclimation phase, revealing that the conditions were apparently poisonous, in the L,M andH treatments the four test species responded in different ways to trace metal additions. Previous studies on E. huxleyire- sponses to trace metal enrichment resulting from volcanic ash showed no significant effects on growth rate for most
ashes tested (Hoffmann et al., 2012). Only the addition of pumice, which released low concentration of trace metals, had a beneficial effect and increased E. huxleyi growth.
In one case, however, progressively increased ash content strongly suppressed the growth rate ofE. huxleyiin the vol- canic ash which contained the highest trace metal concentra- tions (e.g., Pb from 0.5 up to 2.6 nM L−1; Ni from 12 up to 60 nM L−1; Hoffmann et al., 2012). Vasconcelos et al. (2001) report a 10–20 % growth rate reduction ofE. huxleyiwith in- creasing Pb up to 0.25 µmol L−1without additions of EDTA.
In our study,E. huxleyigrowth decreased with increasing Pb, Zn, Ni and V concentrations, whereby the highest con- centration of trace metals up to 0.8 µmol L−1slowed down E. huxleyigrowth by 10 % (Fig. 3a). WhileE. huxleyiis a species which has been studied intensively, much less work has been done on other coccolithophore species. For exam- ple, trace metal effects onG. oceanicahave not been tested before, and, in our experiments, we observed a decrease of G. oceanicagrowth of 12 % under the highest trace metal concentrations (Fig. 3b). A similar negative response to ele- vated trace metal concentration was observed forC. pelagi- cuswhere the growth rate decreased by 31 % in each of the trace metal treatments compared to the control (Fig. 3c). The bigger growth rate reduction observed forC. pelagicussug- gests a comparatively high sensitivity of this species to trace metals enrichment. A stepwise increase in trace metal con- centration did not induce any progressive growth rate reduc- tion attesting a strong sensitivity of bothG. oceanicaandC.
pelagicusalready at low trace metal concentrations.
P. carterae growth rate generally increased with trace metal concentration (Fig. 3d). This beneficial effect of high trace metal quantities (L,MandH) onP. carteraegrowth rate might be due to the preferred habitat of this species in eutrophic lagoons and estuaries (Heimdal, 1993), where trace metal concentrations are generally much higher (Sunda and Hunstman, 2005) than in open waters.
4.2 Morphometrical analyses
The coccolithophore species tested evidenced a detrimen- tal effect of trace metals on coccosphere, cell and coc- colith sizes. Indeed, three species,E. huxleyi, G. oceanica andC. pelagicus,displayed significant size reductions when grown under anomalously high trace metal concentrations.
However, the morphometrical responses are highly variable among species (Fig. 7): (1)E. huxleyireduced its coccolith sizes under high trace metal concentration. This reduction can explain the coccosphere diameter decrease and the con- comitant stable cell sizes (Fig. 7a). Additionally, an increase in the percentage of malformed and/or incomplete coccol- iths was observed under high trace metal concentrations.
(2) Trace metal concentration also influenced G. oceanica coccosphere and cell sizes (Fig. 7b). Furthermore, an ex- tra size reduction of both parameters, that goes along with coccolith size decrease, occurred at the highest trace metal
concentration tested (Fig. 7c). This implies a particularly noxious effect of very high trace metal concentration onG.
oceanicagrowth. (3)C. pelagicuscoccosphere, cell diame- ter and coccolith sizes were negatively influenced by higher trace metal quantities. Increased trace metal induced a reduc- tion of coccosphere, cell and coccolith sizes inC. pelagicus at all the concentrations tested. However, the volume of the calcitic portion of the coccosphere significantly increased un- der high trace metal concentrations. A plausible explanation is that the size decline of the cell goes hand in hand with an increase in the coccolith numbers that cover the cell (Fig. 7d).
Indeed, progressively increased numbers of free/detachedC.
pelagicus coccoliths go together with a gradual increase in trace metal concentrations. (Table 4). This hints at a benefi- cial effect of trace metal on the number ofC. pelagicuscoc- coliths produced per cell (Paasche, 1998; Müller et al., 2012).
(4) On the contrary,P. carteraedoes not show any sensitiv- ity to trace metal concentration since coccosphere, cell and coccolith sizes remain stable in all treatments tested.
Coccolithophore algae, therefore, respond differently to changes in trace metal concentrations. This species-specific sensitivity suggests a different degree of adaptation of the species tested.
4.3 Analogy and contrast with the fossil record
The trace metals tested here were chosen based on metal peaks identified in the Aptian OAE 1a (Erba et al., 2015) and latest Cenomanian OAE 2 (Snow et al., 2005). Zn and Pb are more volatile elements that are concentrated in magmatically degassed fluids, while Ni and V are found in higher concen- trations in water–rock exchange reactions of typical steady- state hydrothermal vents (Rubin, 1997). Therefore, the com- posure of trace metal tested was intended to simulate OAE conditions. We emphasize that the coccolithophore species chosen for this experiment are linked to the Mesozoic family Biscutaceae based on the fossil record tracing their biocal- cification history back to∼200 million years ago (Bown et al., 2004). When genomic data sets are considered for re- construction of coccolithophore evolution, it appears that the selected Coccolithales order (C. pelagicus andP. carterae) diverged from the Isochrysidales order (E. huxleyi andG.
oceanica) in the earliest Triassic (De Vargas et al., 2007) or even in the latest Permian (Liu et al., 2010), some 300 mil- lion years ago.
Considering that the species tested in this study have a long evolutionary history, it may be justified to conduct a comparison among fossil and living coccolithophore re- sponses. Morphometric analyses of selected nannofossil taxa across Cretaceous OAEs in various geological settings re- vealed differential species-specific patterns: for instance,Bis- cutum constans, a cosmopolitan coccolithophore species of the Cretaceous ocean, evidenced size variations in times of environmental change. Specifically, coccolith dwarfism (sensu Erba et al., 2010) occurred at intervals characterized
by high trace metal concentrations (Erba et al., 2010, 2015;
Faucher et al., 2017). Conversely,Watznaueria barnesiae, a cosmopolitan species described as a r-selected opportunis- tic species (Hardas and Mutterlose, 2007) did not change in size across OAEs (Erba et al., 2010; Bornemann and Mutterlose, 2006; Lübke and Mutterlose, 2016; Faucher et al., 2017). Indeed, a more pronounced ellipticity, interpreted as evidence of malformation, was documented by Erba et al. (2010) during OAE 1a, but not during other times of global anoxia (Bornemann and Mutterlose, 2006; Faucher et al., 2017). The very low variability inW. barnesiaesize indi- cates that this taxon was most adaptable and only marginally affected by the paleoenvironmental stress characterizing Cre- taceous OAEs. Finally,D. rotatoriusandZ. erectus, species with a meso-eutrophic preference, evidenced inconsistent size trends without a distinct relationship between size and metal peaks (Faucher et al., 2017).
Our laboratory experiments on living coccolithophore al- gae demonstrate that elevated trace metal concentrations af- fect coccolith size and/or weight similar to the fossil record.
Moreover, as quantified in nannofossil assemblages, our re- sults reveal species-specific responses. In fact, large differ- ences were observed between species, and we could identify the most-tolerant (P. carterae), intermediate-tolerant (E. hux- leyi, G. oceanica) and least-tolerant (C. pelagicus) taxa to in- creasing trace metal concentrations. Parallel changes among fossil and living coccolithophores suggest that trace metal concentrations have the potential to influence coccolith pro- duction and sizes.
We stress the fact that both the fossil record and the ex- perimental results converge on a species-specific response of coccolithophores to metal availability. Consequently, the in- discriminate use of coccolith sizes as a proxy of trace metal concentration in seawater should be avoided. Instead, it is crucial to identify the species index/indices that better trace paleoenvironmental stress induced by high (selected) metal concentrations.
5 Conclusions
With this study, we demonstrated for the first time that a mixture of trace metals affected growth and morphology of coccolithophore species. A size reduction of the coccosphere and cell diameters has been observed in three of the analyzed species. Furthermore, we observed the production of dwarf coccoliths (sensu Erba et al., 2010) under high trace metal concentrations. Our data show a species-specific sensitivity of coccolithophores to trace metal concentration, allowing the recognition of the most- (P. carterae), intermediate- (E.
huxleyi andG. oceanica) and least-tolerant (C. pelagicus) taxa.
The comparison of data on living coccolithophores and Mesozoic calcareous nannofossils shows strong similarities, suggesting that laboratory simulations of past extreme condi-
tions are viable when extant taxa are phylogenetically linked to extinct fossil species. Our study supports the hypothesis that anomalous trace metal conditions in the past oceans sig- nificantly contributed to the morphological coccolith changes during Cretaceous OAEs.
Laboratory experiments on modern coccolithophore species remain the only means to quantitatively assess the in- dividual or combined role of environmental parameters (e.g., trace metal availability) on coccolith secretion. Our results emphasize the need to consider species-specific differences where coccolith morphological features are used to recon- struct paleo-chemical conditions.
Data availability. No data sets were used in this article.
The Supplement related to this article is available online at https://doi.org/10.5194/bg-14-3603-2017-supplement.
Competing interests. The authors declare that they have no conflict of interest.
Acknowledgements. We acknowledge Agostino Rizzi for SEM photography of coccoliths. We thank the Editor, Jack Middelburg, Lennart de Nooijer and one anonymous reviewer for their helpful comments on the manuscript. The research was funded through MIUR-PRIN 2011 (Ministero dell’Istruzione, dell’Università e della Ricerca–Progetti di Ricerca di Interesse Nazionale) for Elisabetta Erba and through SIR-2014 (Ministero dell’Istruzione, dell’Università e della Ricerca–Scientific Independence of young Researchers) for Cinzia Bottini. Giulia Faucher was supported by Fondazione Fratelli Confalonieri.
Edited by: Jack Middelburg
Reviewed by: Lennart de Nooijer and one anonymous referee
References
Bach, L. T., Riebesell, U., and Schulz, K. G.: Distinguishing be- tween the effects of ocean acidification and ocean carbonation in the coccolithophore Emiliania huxleyi, Limnol. Oceanogr., 56, 2040–2050, 2011.
Bach, L. T., Bauke, C., Meier, K. J. S., Riebesell, U., and Schulz, K. G.: Influence of changing carbonate chemistry on morphol- ogy and weight of coccoliths formed by Emiliania huxleyi, Bio- geosciences, 9, 3449–3463, https://doi.org/10.5194/bg-9-3449- 2012, 2012.
Bornemann, A. and Mutterlose, J.: Size analyses of the coccolith speciesBiscutum constansandWatznaueria barnesiaefrom the Late Albian “Niveau Breistroffer” (SE France): taxonomic and palaeoecological implications, Geobios, 39, 599–615, 2006.
Bown, P. R., Lees, J. A., and Young, J. R.: Calcareous nannoplank- ton evolution and diversity through time, in: Coccolithophores, Springer Berlin Heidelberg, 481–508, 2004.
Brand L. E., Sunda W. G., and Guillard R. R.: Reduction of ma- rine phytoplankton reproduction rates by copper and cadmium, J. Exp. Mar. Biol. Ecol., 96, 225–250, 1986.
Bruland, K. W., Donut, J. R., and Hutchins, D. A.: Interactive in- fluences of bioactive trace metals on biological production in oceanic waters, Limnol. Oceanogr., 36, 1555–1577, 1991.
De Vargas, C. and Probert, I.: New keys to the Past: Current and future DNA studies in Coccolithophores, Micropaleontology, 50, 45–54, 2004.
De Vargas, C., Aubry, M. P., Probert, I., and Young, J.: Origin and evolution of coccolithophores: from coastal hunters to oceanic farmers, Evolution of primary producers in the sea, 12, 251–285, 2007.
Erba, E.: Calcareous nannofossils and Mesozoic oceanic anoxic events, Mar. Micropaleontol., 52, 85–106, https://doi.org/10.1016/j.marmicro.2004.04.007, 2004.
Erba, E., Bottini, C., Weissert, H. J., and Keller, C. E.: Cal- careous nannoplankton response to surface-water acidification around Oceanic Anoxic Event 1a, Science, 329, 428–432, https://doi.org/10.1126/science.1188886, 2010.
Erba, E., Duncan, R. A., Bottini, C., Tiraboschi, D., Weissert, H., Jenkyns, H. C., and Malinverno A.: Environmental consequences of Ontong Java Plateau and Kerguelen Plateau volcanism, Ge- ological Society of America Special Papers, 511, SPE511-15, https://doi.org/10.1130/2015.2511(15), 2015.
Faucher, G., Erba, E., Bottini, C., and Gambacorta, G.: Calcare- ous nannoplankton response to the latest Cenomanian Oceanic Anoxic Event 2 perturbation, Rivista Italiana di Paleontologia e Stratigrafia (Research In Paleontology and Stratigraphy), 123, 2017.
Guillard, R. R. L. and Ryther, J. H.: Studies of marine planktonic diatoms: I. Cyclotella Nana Hustedt, and Detonula Confervacea (CLEVE) Gran, Can. J. Microbiol., 8, 229–239, 1962.
Hardas, P. and Mutterlose, J.: Calcareous nannofossil assemblages of Oceanic Anoxic Event 2 in the equatorial Atlantic: Evidence of an eutrophication event, Mar. Micropaleontol., 66, 52–69, https://doi.org/10.1016/j.marmicro.2007.07.007, 2007.
Heimdal, B. R.: Modern coccolithophorids, CR Tomas, Academic Press, San Diego, CA, 731–831, 1993
Hoffmann, L. J., Breitbarth, E., Ardelan, M. V., Duggen, S., Olgun, N., Hassellöv, M., and Wängberg, S. Å.: Influence of trace metal release from volcanic ash on growth ofThalassiosira pseudo- nanaandEmiliania huxleyi, Mar. Chem., 132, 28–33, 2012.
Jenkyns, H. C.: Geochemistry of oceanic anoxic events, Geochem. Geophy. Geosy., 11, Q03004, https://doi.org/10.1029/2009GC002788, 2010.
Kester, D. R., Duedall, I. W., Connors, D. N., and Pytkowicz, R.
M.: Preparation of artificial seawater, Limnol. Oceanogr., 1, 176–
179, 1967.
Langer, G. and Bode, M.: CO2mediation of adverse effects of sea- water acidification in Calcidiscus leptoporus, Geochem. Geophy.
Geosy., 12, https://doi.org/10.1029/2010GC003393, 2011.
Langer, G., De Nooijer, L. J., and Oetjen, K.: On the role of the cytoskeleton in coccolith morphogenesis: the ef- fect of cytoskeleton inhibitors1, J. Phycol., 46, 1252–1256, https://doi.org/10.1111/j.1529-8817.2010.00916.x, 2010.
Larson, R. L. and Erba, E.: Onset of the Mid-Cretaceous green- house in the Barremian-Aptian: igneous events and the biologi- cal, sedimentary, and geochemical responses, Paleoceanography, 14, 663–678, https://doi.org/10.1029/1999PA900040, 1999.
Leckie, R. M.: Foraminifera of the Cenomanian-Turonian Boundary Interval, Greenhorn Formation, Rock Canyon Anticline, Pueblo, Colorado, in: Society of Economic Paleontologists and Miner- alogists Field Trip Guidebook, 4, 139–155, Midyear Meeting, Golden, Colorado, 1985.
Leckie, R. M., Yuretich, R. F., West, O. L. O., Finkelstein, D., and Schmidt, M.: Paleoceanography of the southwestern Western In- terior Sea during the time of the Cenomanian-Turonian bound- ary (Late Cretaceous), in: Stratigraphy and Paleoenvironments of the Cretaceous Western Interior Seaway, USA, Concepts in Sedimentol, Paleontol., edited by: Dean, W. E. and Arthur, M.
A., Soc. Sediment. Geol., Tulsa, Okla, 6, 101–126, 1998.
Liu, H., Aris-Brosou, S., Probert, I., and de Vargas, C.: A time line of the environmental genetics of the haptophytes, Mol. Biol.
Evol., 27, 161–176, https://doi.org/10.1093/molbev/msp222, 2010.
Lübke, N. and Mutterlose, J.: The impact of OAE 1a on marine biota deciphered by size variations of coccoliths, Cretaceous Res., 61, 169–179, 2016.
Müller, M. N., Beaufort, L., Bernard, O., Pedrotti, M. L., Talec, A., and Sciandra, A.: Influence of CO2and nitrogen limitation on the coccolith volume ofEmiliania huxleyi(Haptophyta), Bio- geosciences, 9, 4155–4167, https://doi.org/10.5194/bg-9-4155- 2012, 2012.
Neal, C. R., Coffin, M. F., Arndt, N. T., Duncan, R. A., Eldholm, O., Erba, E., Farnetani, C., Fitton, J. F., In- gle, S. P., Ohkouchi, N., Rampino, M. R., Reichow, M.
K., Self, S., and Tatsumi, Y.: Investigating Large Igneous Province Formation and Associated Paleoenvironmental Events:
A White Paper for Scientific Drilling, Sci. Dril., 6, 4–18, https://doi.org/10.2204/iodp.sd.6.01.2008, 2008.
Orth, C. J., Attrep, M., Quintana, L. R., Elder, W. P., Kauffman, E. G., Diner, and Villamil, T.: Elemental abundance anoma- lies in the late Cenomanian extinction interval: a search for the source(s), Earth Planet. Sc. Lett., 117, 189–204, 1993.
Paasche, E.: Roles of nitrogen and phosphorus in coccolith forma- tion in Emiliania huxleyi(Prymnesiophyceae), Eur. J. Phycol., 33, 33–42, 1998.
Pearce, M. A., Jarvis, I., and Tocher, B. A.: The Cenomanian–
Turonian boundary event, OAE2 and palaeoenvironmental change in epicontinental seas: new insights from the dinocyst and geochemical records, Palaeogeogr. Palaeoclimatol. Palaeocl., 280, 207–234, 2009.
Rubin, K.: Degassing of metals and metalloids from erupting seamount and mid-ocean ridge volcanoes: observations and pre- dictions, Geochim. Cosmochim. Ac., 61, 3525–3542, 1997.
Santomauro, G., Sun, W. L., Brümmer, F., and Bill, J.: Incorpora- tion of zinc into the coccoliths of the microalgaEmiliania hux- leyi, BioMetals, 29, 225–234, https://doi.org/10.1007/s10534- 015-9908-y, 2016.
Schindelin, J., Arganda-Carreras, I., Frise, E., Kaynig, V., Lon- gair, M., Pietzsch, T., Rueden, C., Saalfeld, S., Schmid, B., Tinevez, J., Y., White, D. J., Hartenstein, V., Eliceiri K., Tomancak, P., and Cardona, A.: Fiji: an open-source plat- form for biological-image analysis, Nat. Methods, 9, 676–682, https://doi.org/10.1038/nmeth.2019, 2012.
Snow, L. J., Duncan, R. A., and Bralower, T. J.: Trace element abun- dances in the Rock Canyon Anticline, Pueblo, Colorado, marine sedimentary section and their relationship to Caribbean plateau construction and oxygen anoxic event 2, Paleoceanography, 20, https://doi.org/10.1029/2004PA001093, 2005.
Sunda, W. G.: Trace metal interactions with marine phytoplankton, Biol. Oceanogr., 6, 411–442, 1989.
Sunda W. G. and Huntsman S. A: Feedback interactions between zinc and phytoplankton in seawater, Limnol. Oceanogr., 37, 25–
40, 1992.
Sunda, W. G. and Huntsman, S. A.: Processes regulating cellular metal accumulation and physiological effects: phytoplankton as model systems, Sci. Total Environ., 219, 165–181, 1998.
Sunda, W. G., Price, N. M., and Morel, F. M.: Trace metal ion buffers and their use in culture studies, Algal culturing tech- niques, 4, 35–63, 2005.
Vasconcelos, M. T. S. and Leal, M. F. C.: Antagonistic interactions of Pb and Cd on Cu uptake, growth inhibition and chelator re- lease in the marine algae Emiliania huxleyi, Mar. Chem., 75, 123–139, 2001.
Westbroek, P., Young, J. R., and Linschooten, K.: Coccolith produc- tion (biomineralization) in the marine alga Emiliania huxleyi, J.
Eukaryotic Microbiol., 36, 368–373, 1989.
Winter, A., Henderiks, J., Beaufort, L., Rickaby, R. E., and Brown, C. W.: Poleward expansion of the coccolithophore Emiliania huxleyi, J. Plankton Res., 36, 316–325, 2014.