Long-term adaptation of the
coccolithophore Emiliania huxleyi to ocean acidification and global warming
Dissertation
Zur Erlangung des Doktorgrades - Dr.rer.nat. -
der Mathematisch-Naturwissenschaftlichen Fakultät der Christian-Albrechts-Universität zu Kiel
vorgelegt von Lothar Schlüter
Kiel 2016
Erster Gutachter: Prof. Dr. Thorsten B.H. Reusch Zweiter Gutachter: Prof. Dr. Ulf Riebesell
Dritter Gutachter: Prof. Dr. Hinrich Schulenburg
Tag der mündlichen Prüfung: 19.02.2016
Zum Druck genehmigt: 19.02.2016
Contents
Zusammenfassung ... 5
Summary ... 7
Introduction ... 9
Evolution to global change ... 9
Phytoplankton as new models for rapid evolution: their role in global climate and potential winners and losers ... 12
The coccolithophore Emiliania huxleyi as a model organism ... 14
The selection regime: warming and acidification ... 16
Considerations in experimental evolution ... 17
Thesis outline ... 19
Publication I ... 21
Author contribution ... 21
Long-term dynamics of adaptive evolution in a globally important coccolithophore to ocean acidification ... 21
Publication II ... 41
Author contribution ... 41
Adaptation of a globally important coccolithophore to ocean warming and acidifications ... 41
Publication III ... 63
Author contribution ... 63
The effects of adaptation to global warming on previous adaption to ocean acidification in Emiliania huxleyi ... 63
Synthesis ... 87
The mutational basis of evolutionary change ... 87
Towards more complex selection environments ... 87
Evolutionary physiology of adaptation ... 89
Implications of study results to the real ocean ... 90
Mechanisms behind adaptation ... 92
Final conclusions... 94
References: ... 97
Appendix: ... 105
Supplementary Material Publication I ... 105
Supplementary Material Publication II ... 113
Danksagung ... 129
Eidesstattliche Erklärung ... 130
Zusammenfassung
Die Menschheit verändert den Kohlenstoffkreislauf hochgradig durch die Verbrennung fossiler Kohlenwasserstoffe, welche direkt und indirekt am Klimawandel beiträgt. Der Überschuss an anthropogenem CO2 Ausstoß treibt nicht nur die Erderwärmung an, sondern verursacht außerdem Ozeanversauerung, wenn CO2 im Meerwasser gelöst wird. Wie marines Phytoplankton auf diese Veränderungen reagiert ist von besonderem Interesse, da es in etwa die Hälfte der globalen Kohlenstofffixierung leistet. Besonders kalzifizierende Organismen sind besonders sensibel gegen Ozeanversauerung. Coccolithophoriden als kalzifizierendes Phytoplankton sind deshalb besonders im Fokus. Aufgrund ihrer kurzen Reproduktionszeit und ihrer hohen Populationsdichten sind sie besonders dafür geeignet, die Auswirkungen von adaptiver Evolution unter globalem Wandeln zu untersuchen.
Mein Studienalge, die Coccolithophoride Emiliania huxleyi, ist eine der häufigsten marinen Mikroalgen, und gleichzeitig einfach im Labor kultivierbar. In Experimenten konnten die physiologischen Abhängigkeiten von CO2 und Temperatur auf E. huxleyi gezeigt werden. Diese deuten darauf hin, dass das Wachstum und Kalzifizierung im Ozean der Zukunft reduziert sein werden. In einem CO2-Adaptations-Experiment hatte E. huxleyi das Potenzial sich an Ozeanversauerung anzupassen. Allerdings ist unklar, ob und wie die Anpassung an erhöhtes CO2 und Erwärmung miteinander interagieren. Im ersten Teil meiner Arbeit habe ich deswegen die Langzeitauswirkungen von CO2-Selektion (1100 µatm pCO2, 2200 µatm pCO2) sowie die Interaktion mit Temperaturselektion (26.3°C) untersucht, welche nach 1600 asexuellen Generationen CO2- Selektion hinzugefügt wurde.
Aufbauend auf ein erstes einjähriges Experiment habe ich untersucht, ob sich Adaptation an Ozeanversauerung allein über einen Zeitraum von vier Jahren fortführt. Die Fortsetzung des CO2- Adaptations-Experiment hat gezeigt, dass langfristige Adaptation komplex ist und sich phänotypische Antworten im Laufe der Zeit umschlagen können. Nach insgesamt 2100 asexuellen Generationen unter CO2-selektion steigerte sich die Fitness (in Form der Wachstumsrate) unter mittlerem CO2
(1100 µatm pCO2) langsam. Der Fitness-Vorteil von 5% nach 500 Generationen unter hoch CO2 (2200 µatm pCO2) blieb unverändert. Die Kalzifizierung wurde in den ersten 500 Generationen teilweise wiederhergestellt. Danach schlug die phänotypische Antwort jedoch um, und die Kalzifizierung wurde als Selektionsantwort reduziert. Diese Antwort war nicht grundlegend, da der Kalkgehalt der Zellen wiederhergestellt wurde, nachdem sie zurück unter heutige Ozeanwerte (400 µatm pCO2) transferiert wurden. Einige phänotypische Veränderungen der Zellen standen wahrscheinlich im Zusammenhang mit der Selektion für höhere Wachstumsraten, so wie eine reduzierte Zellgröße und ein niedriger organischer Kohlenstoffgehalt (POC).
Unabhängig des CO2-Partialdruckes konnte sich E. huxleyi an erhöhte Temperaturen anpassen. Der Fitnesszuwachs betrug bis zu 16% in Populationen welche an hoch CO2 und Temperatur angepasst waren gegenüber den nicht angepassten Kontrollen unter Selektionsbedingungen. Das Verhältnis von partikulären anorganischen (PIC) und organischen Kohlenstoff (PIC:POC) wurde auf das ursprüngliche Verhältnis wiederhergestellt, auch unter erhöhtem CO2. Die Zellen wurden mit der Zeit kleiner, begleitet von einer Reduktion des organischen Kohlenstoffgehalts. Die Produktionsraten konnten aufgrund der Adaptation der Wachstumsrate wiederhergestellt werden, welche dem heutigen Niveau entsprechen. Verglichen mit ihren nicht angepassten Kontrollen steigerte sich die Produktion um 101% (PIC) und 55% (POC) unter hoch CO2/Temperatur-Bedingungen.
In meinem dritten Kapitel wende ich mich der Frage zu, inwieweit Temperaturadaptation Adaptation an Ozeanversauerung beeinflusst. Die Adaptation an erhöhte Temperatur steigerte den Effekt der bestehenden CO2-Adaptation in der Wachstumsrate. Die adaptive Reduzierung der Zellgröße unter erhöhtem CO2 wurde nach der Temperaturadaptation umgedreht, so dass die adaptierten Zellen nun unter erhöhtem CO2 größer waren. Unter erhöhter Temperatur war kein physiologischer Effekt von CO2 auf den Kalkgehalt der Zellen vorhanden. Dementsprechend konnte ich dort keine evolutiven Veränderungen nachweisen. Die Adaptation an erhöhte Temperatur hat insgesamt die negativen Auswirkungen von Ozeanversauerung verringert. Um den vollen Fitnesszuwachs unter hoch CO2/Temperatur-Bedingungen zu erhalten, war Adaptation zu CO2 und Temperatur notwendig. Als Konsequenz daraus ergibt sich, dass CO2- und Temperaturadaptation sich addieren. Es mag auch einen kleinen nicht signifikanten synergistischen Effekt geben, da der kombinierte Effekt leicht größer war, als die reine Addition der Einzeleffekte.
Zusammengefasst könnte die Erderwärmung die Auswirkungen der Ozeanversauerung für E. huxleyi reduzieren. Meine Ergebnisse zeigen auch, dass Mikroalgen phänotypische Plastizität entwickeln können als Antwort auf den Klimawandel. Die Auswirkungen auf biochemisch wichtige Merkmale wie Kalzifizierung könnten dadurch unvorhersehbar beeinflusst werden. Prognosen bezüglich des Ozeans der Zukunft erhalten dadurch einen weiteren Unsicherheitsfaktor. Trotzdem haben marine Einzeller, so wie Phytoplankton, gute Chancen sich an den Klimawandel anzupassen im Gegensatz zu Organismen mit längerer Generationszeit.
Summary
Humans are profoundly altering the carbon cycle by fossil fuel burning, which contributes directly and indirectly to global change. Excess anthropogenic CO2 emissions not only drive the greenhouse effects and atmospheric warming but also cause ocean acidification when CO2 dissolves in ocean waters. How marine phytoplankton reacts to these changes is of particular interest as it contributes almost half of the global carbon fixation. Especially calcifying marine organisms are sensitive to ocean acidification. This puts coccolithophores as calcite producing phytoplankton in the focus of research on global change impacts. Because of their short reproduction time and high population densities coccolithophores are the ideal candidate to investigate adaptive evolution to global change.
My study species, the coccolithophore Emiliania huxleyi is one of the most abundant phytoplankton in the ocean, and at the same time, can be cultured easily in the laboratory. Coccolithophore growth and calcification display temperature dependent CO2-optimum curves, which indicate a reduction in growth rate and calcification under future ocean conditions of warming and ocean acidification.
While the potential of E. huxleyi to adapt to ocean acidification has already been shown, how warming and acidification adaptation interact remained uncertain. In my first chapter, I tested for the long-term effects of CO2 adaptation (1100 µatm pCO2, 2200 µatm pCO2) and the interactions with temperature adaptation (26.3°C) introduced after 1600 generations of CO2 adaptation.
Building upon first experiments over one year duration, I next assessed whether adaptation to ocean acidification alone would continue over a time interval of 4 yrs. The elongation of the selection to CO2 revealed that the long-term adaptation is complex and phenotypic responses may revert over time. After 2100 asexual generations of selection to CO2 the fitness (growth rate) increased slightly over time under medium CO2 conditions (1100 µatm pCO2). Under high CO2 (2200 µatm pCO2) the fitness advantage of 5% at 500 generations remained unchanged. The phenotypic trait of calcification was partly restored within 500 generations. Thereafter, calcification was reduced in response to selection. The reduction of calcification was not constitutively, as the calcite per cell quotas were restored when assessed with present-day CO2 conditions (400 µatm pCO2). Some phenotypic traits were likely associated with selection for higher growth rate, such as a reduced cell size and lower particulate organic carbon (POC) content per cell.
Temperature adaptation occurred independently of ocean acidification levels. The fitness increase in growth rate due was up to 16% in populations adapted to high temperature and high CO2 compared to not adapted cells under selection conditions. The ratio of particular inorganic (PIC) and organic carbon (PIC:POC) recovered to their initial ratio after temperature adaptation, even under elevated CO2. Cells evolved to a smaller size accompanied by a reduction in POC-content. Production rates were restored to values under present-day ocean conditions, owing to adaptive evolution in growth
rate. They were 101% (PIC) and 55% (POC) higher under warming compared to the non-adapted controls.
In my third chapter, I addressed how temperature selection changed adaptation to ocean acidification. Temperature adaptation increased the effect on persisting CO2 adaptation in growth rate. The adaptive reduction of cell size to CO2 selection was reversed after temperature adaptation, leading to larger CO2 adapted cells at high temperature. The immediate physiological effect on PIC per cell was diminished compared to the lower temperature treatment, and so were the adaptive effects. Temperature adaptation reduced the negative effects of ocean acidification. Both adaptations were necessary to receive the full fitness effect under high-temperature-high-CO2- conditions. As consequence both adaptive effects are additive, with a slight and not significant tendency to synergistic, as the combined effect is slightly larger than the addition of both single effects.
Taken together, global warming may reduce the adverse effects of ocean acidification on E. huxleyi populations. My results show further, that marine phytoplankton may evolve changes in the plastic response under future ocean conditions. This could affect biogeochemical important traits, such as calcification, in an unpredictable way. Nevertheless, marine microbes like unicellular phytoplankton have quite good chances to adapt to ocean acidification and global warming, in contrast to many organisms with longer generation times.
Introduction
Evolution to global change
Since the industrial revolution starting in the 18th century mankind increased its impact on the environment. In Earth history there has never been a single species with more influence on the appearance of the planet as humans, provoking the postulation of the anthropocene as new geological period (Crutzen 2002). The expansion of civilization causes a reduction of undisturbed ecosystems and a higher demand for energy and resources. The burning of fossil fuels in particular led to an ongoing increase in carbon dioxide (CO2) in the atmosphere as major greenhouse gas (Mitchell 1989). Atmospheric CO2 affects the Earth’s climate, oceans and ecosystem on a global scale.
This far, work on the effects of climate change has focused on range shifts (Parmesan et al. 1999, Parmesan & Yohe 2003, Perry et al. 2005), or on short-term physiological effects of, for example, warming and acidification (Sett et al. 2014). However, predictions about how future changes in climate affect marine life are not strait forward. Short-term experiments in ecosystems under future ocean conditions neglect long-term evolutionary processes that will change the traits of populations to be different than those today while the climate is changing. This raises the question if and how individual species can adapt to future ocean conditions and how the potential of single species adaptation will affect the community composition.
This thesis uses the term adaptation always in the context of evolutionary adaptation, while the term
"physiological adaptation" as acclimation/acclimatization (Garland & Kelly 2006). (Evolutionary) Adaptation is a population-level process. The mean fitness of populations changes when a certain genotype contributes more offspring to the next generation than others. In the absence of recombination (i.e. asexual reproducing populations), the abundance of this genotype increases within the population and may displace other genotypes after generations. We also say that this superior genotype is positively selected. Hence, evolution is a process where the mean population fitness increases as a consequence of natural selection.
“Physiological adaptation” refers to processes were individual organisms adjust to a range of environments (Garland & Kelly 2006). Such phenotypic plasticity is defined as acclimation (laboratory-based) or acclimatization when it occurs in nature (Angilletta 2009). Phenotypic plasticity describes how one genotype gives rise to different phenotypes as function of the environment (Scheiner 1993). Phenotypic plasticity can buffer environmental changes and increase the environmental range in which a species can exist. It is important to distinguish between phenotypic plasticity (how much the phenotype changes as a function of environmental change = classical plasticity) and phenotypic buffering (how broad is the environmental range a genotype can maintain its fitness) (Reusch 2014). Under a stressful environment an organism with better phenotypic
buffering would be favored by selection, because it can maintain its fitness. The opposite is the case with enhanced opportunities (e.g. more nutrients available). Here the organism with the higher plasticity would be favored, because it could more easily take advantage of the circumstances (Schaum et al. 2013, Reusch 2014). However, phenotypic plasticity and buffering both underlie evolutionary forces, and are therefore determined by the evolutionary history just as the mutation rate (Schaum & Collins 2014).
An increase in phenotypic plasticity therefore means that the phenotype changes more, not that the environmental range is increased, which is called tolerance. Plasticity often is associated with a cost.
The cost is not a reduced fitness due to expression of a certain phenotype, but a general reduced fitness in maintaining the cellular machinery necessary to be plastic (Scheiner 1993). This leads to a trade-off between maintaining the phenotypic plasticity and the maximum possible fitness under constant environmental conditions. As a result we expect organisms living in a stable environment as less plastic than those from instable environments (Scheiner 1993).
Depending on the exact position on the genome where the mutation occurs, mutations can be neutral (have no phenotypic effect), beneficial (increase in fitness) or deleterious. Deleterious mutations are quickly selected against and will therefore only play a negligible role within sexually or asexually propagating populations. Most mutations not causing any phenotypic variation are considered to be neutral, meaning the mutation has no biological meaning. For example the gene sequence of small proteins like insulin, cytochrome c and hemoglobins from various groups of animals showed that the extent of sequence divergence between species increases as the divergence time increases (Nei et al. 2010). However, the function of the gene remains the same, as long as the amino acid sequence of the active sites of the protein remains the same (Nei et al. 2010). The proportion of beneficial mutations is difficult to estimate and depends on the model system (Keightley & Lynch 2003). Before a beneficial mutation can proceed to fixation in a population (permanently established in the population), it has to overcome genetic drift, here the random loss of mutants that always occur by definition at 1/N, where N is the population size. When the mutation is established the frequency of this mutation in the population will increase depending on the selective advantage and the population size (Desai et al. 2007). The time it takes a mutant to get from establishment to being half of the population is approximately ln[Ns], where N is the population size and s the selective advantage. Initially neutral mutations can become beneficial under different environmental conditions, as any fitness effects are always context (=environment) dependent. It is now well established that evolutionary adaptation can happen on very short timescales. Examples are the rise of antibiotic resistances in bacteria since the medical utilization (Davies & Davies 2010).
Selection to multiple selection factor regimes and how do factors interact has hardly been investigated. Interactions between factors are generally described as synergistic, antagonistic or additive. When factors do note interact, the combined effect is the addition of single effects. When factors act synergistic, the combined effect is stronger than the simple addition of single effects. In case the combined effect is smaller as the addition the factors act antagonistic. I expect to find interactions between the two factors temperature and pH, as enzymatic functioning depends on both these factors (Dixon 1953). However, an important difference between both factors is that the intracellular pH is usually under tight control, whereas the temperature is not.
The three most important approaches to study the adaptive potential are: I. measuring standing genetic variation in climate-sensitive traits, II. inferring past adaptation from comparisons across space and time and III. conducting evolution experiments in real time (Sunday et al. 2014). Only approach III is a direct test of adaptive evolution.
I. A high standing genetic variation could possibly include genotypes that are positively selected under new environmental conditions. In controlled reciprocal exposure experiments where the individual fitness is measured genotypes/phenotypes can be determined which perform better than the population mean and would possibly be positively selected (Shaw & Etterson 2012).
II. The comparison of phenotypes across environmental gradients can give us information about evolution that happened in the past. Effectively this approach tests for local adaptation (e.g. to temperature, pCO2). With this approach time is substituted with space and other environmental drivers (e.g. nutrients, salinity) would covary in space as they would do in time (Sunday et al. 2014).
Such an approach can only tell the adaptive potential, and another shortcoming is that we do not know the time it took for the genotypic cline to build up as function of the environmental gradient.
III. The only direct test of (adaptive) evolution are replicated experimental evolution experiments (Lenski et al. 1991, Sniegowski et al. 1997, Dunham et al. 2002). In marine systems, using experimental evolution adaptation could be confirmed after time spans of less than a year (Lohbeck et al. 2012, Schaum & Collins 2014), which makes experimental evolution a valuable tool to investigate the response of phytoplankton to global change (Reusch & Boyd 2013). So far the number of evolutionary experiments with marine phytoplankton is small (Reusch & Boyd 2013), but increasing (Lohbeck et al. 2012, Benner et al. 2013, Schaum & Collins 2014, Scheinin et al. 2015).
The experimental set-up has large influence on the adaptive process. Most evolutionary experiments are initiated by sudden exposure to the new environment, although a continuous environmental change is more realistic. In a selection experiment with Chlamydomonas gradual environmental change led to a higher end-fitness compared to an abrupt change scenario. Here, more mutations
with smaller fitness effect could become fixed and add up in their fitness effects, instead of few with large effect in the abrupt scenario (Collins & de Meaux 2009). Further, a variable selection environment leads to more plasticity (Schaum & Collins 2014). Depending on the founding population used, derived from a single clone or a mixture of clones, fitness increase must derive through novel mutations or can be due to genotypic sorting, respectively (Lohbeck et al. 2012).
Adaptation to ocean acidification has already been demonstrated in E. huxleyi (Lohbeck et al. 2012) and Gephyrocapsa oceanica (Jin et al. 2013). In both experiments the growth rate of adapted populations exceeded the growth rate of non-adapted populations when tested at elevated CO2
conditions. While in the G. oceanica experiment a non-calcifying strain was used, in E. huxleyi the calcification was partly restored and was probably associated with evolution of the pH regulation system (Lohbeck et al. 2014). In this same E. huxleyi selection line it could be shown that the adaptation derived from divergent genetic mutation, as the experimental replicates showed different phenotypes when challenged with low salinity (Lohbeck et al. 2013). There is indication that higher levels of CO2 may lead to a degeneration of the carbon-concentrating mechanism (CCM) in Chlamydomonas (Collins & Bell 2004), which could also apply for marine phytoplankton. In E. huxleyi local temperature adaptation could be found (Zhang et al. 2014), which is not surprising as it corresponds to the global pattern of temperature adaptation in marine phytoplankton (Thomas et al.
2012).
Phytoplankton as new models for rapid evolution: their role in global climate and potential winners and losers
Although marine phytoplankton account for less than 1% of the Earth’s photosynthetic biomass it is responsible for about half of the global net primary production (Field et al. 1998). In terms of global geological earth system evolution, marine phytoplankton has played very decisive roles. In Earth’s history it was marine phytoplankton, cyanobacteria to be precise, that elevated the atmospheric oxygen 2.4 billion years ago (Falkowski 2012). The photosynthesis uses inter alia CO2 as a substrate to produce oxygen and organic matter. This makes photoautotrophic plankton the key driver in the ocean’s biological carbon pump (Falkowski 2012). The carbon that is fixed by phytoplankton eventually sinks to the deep sea as fecal pellets or dead bodies of phytoplankton. About 15% of the net primary production gets exported to the deep sea this way and about 0.1% gets buried into the sediment and under the right conditions to be transformed into fossil fuel (Falkowski 2012).
Currently we use per day about as much fossil fuel as is produced in a year (Houghton 2007).
Additional to the ecological importance of phytoplankton in Earth’s history and the carbon cycle, experiments on marine phytoplankton species in the context of possible evolution is particularly interesting and relevant, as we gain insight from very small beaker experiments that may add to understanding the fate of biogeochemical cycles.
The major functional/taxonomic phytoplankton groups are diatoms, dinoflagellates, cyanobacteria and coccolithophores (Litchman et al. 2007). Each of those groups has a particular combination of traits. Diatoms have a shell made of silicate, which restrict them in their abundance to areas with high silicate input. Some cyanobacteria are able to fix N2 and therefore are supposed to be most successful in areas with high phosphorus and no nitrate or ammonium. Some dinoflagellate species can also use organic matter as energy source and are therefore mixotrophic. With their flagella they are motile. Unique for dinoflagellates is a cellulose cell wall. Coccolithophores have calcite plates as shells and are therefore especially sensitive to ocean acidification and therefore global change.
Hence, the potential of coccolithophores to adapt to global change is of specific relevance for future ocean predictions.
Coccolithophores first appeared in the late Triassic about 200 Mya (million years ago), which makes them a comparatively young group of phytoplankton (Rost & Riebesell 2004). They have had a major impact on biogeochemical cycling over geological eras. The White Cliffs of Dover are actually composed primarily of coccoliths, being a remarkable landmark that highlights the geological impact of coccolithophores during the Jurassic. The biogeochemical relevance of coccolithophores results from the coupling of photosynthesis and calcification, the production of organic matter and calcite at the same time. Since coccolithophores contain organic and inorganic carbon, inorganic carbon is ingested by zooplankton and ends up in fecal pellets. This ballasting of organic matter with inorganic calcite enhances the transport into the deep sea (Armstrong et al. 2001). While photosynthesis binds CO2 in organic matter, part of which is eventually exported into the deep sea (biological carbon pump), the formation of calcite produces CO2 and increases the atmospheric pCO2 (carbonate counter pump). For each mol of calcite formed one mol of CO2 is released. In numbers, the organic carbon export into the deep sea was calculated to be 11.2 – 15 Pg C yr-1 and for calcite 0.82 – 1.20 Pg C yr-1 (Jin et al. 2006).
The calcite plates of coccolithophores are termed coccoliths (Paasche 1968). They ballast organic material and therefore enhance the transport of organic matter into the deep sea (Armstrong et al.
2001). Biogenic calcite has a density estimated 2.5 times denser than non-calcified E.huxleyi cells (Engel et al. 2009), and organic matter that is ballasted with coccoliths will be exported into the deep sea much faster than non-ballasted organic matter (Bach et al. 2012). The biological function of coccoliths is still under discussion. Prominent explanations are protection against grazing and viruses, ballasting for vertical migration and intracellular light manipulation (Raven & Crawfurd 2012).
Production and morphological integrity of coccoliths is compromised by ocean acidification. In physiological experiments coccolithophores showed reduced growth and calcification under elevated CO2 (Riebesell & Tortell 2011). However, the sensitivity to ocean acidification is species and strain
specific (Langer et al. 2009, Sett et al. 2014), highlighting the importance of standing genetic variation to phytoplankton adaptive evolution. A potential decline in coccolithophore abundance and production may have crucial consequences for the global carbon cycle (Rost & Riebesell 2004, Riebesell et al. 2009).
Not all species are equally affected by increased CO2 and/or temperature. Calcifying marine organisms are stressed by ocean acidification (Riebesell et al. 2000, Hoegh-Guldberg et al. 2007, Doney et al. 2009). On the other hand, enrichment in CO2 leads to a better accessibility of carbon for photosynthesis. For example diatoms could profit from CO2 fertilization (Wu et al. 2010, Rajanandhini et al. 2014). Of particular interest in terms of ocean acidification are coccolithophores, as they are unicellular calcifying marine phytoplankton and can both profit from excess CO2 and suffer from acidification, dependent on where the CO2 optimum of each species is (Sett et al. 2014). In a spring bloom (north Atlantic) experiment coccolithophores were the most abundant genus under greenhouse conditions (elevated CO2 (690 µatm pCO2) and temperature (16°C)) (Feng et al. 2009).
However, calcification was reduced under those conditions. Additionally the abundance of diatoms was reduced leading to a crucial reduction in biomineralization to organic material production rate (Feng et al. 2009). The ballasting effect of biominerals on organic carbon could be drastically reduced (Armstrong et al. 2001, Feng et al. 2009).
The coccolithophore Emiliania huxleyi as a model organism
Emiliania huxleyi is the world’s most common coccolithophore and calcifying species with a nearly global distribution, except for polar waters (Westbroek et al. 1989). One remarkable natural phenomenon is blooms of E. huxleyi. The coccoliths scatter the light and therefore blooms can be seen from out of space as a “milky cloud” in the ocean (Westbroek et al. 1989). E. huxleyi blooms usually occur in eutrophic areas after a diatom bloom, when water is highly stratified, the irradiance is high and silicate is already used up by diatoms (Tyrrell & Merico 2004). Further, the nitrogen to phosphorus (N:P) ratio seems to be relevant, as in most blooms N:P was rather high compared to Redfield (Redfield 1958, Townsend et al. 1994). In mesocosm experiments the success of E. huxleyi blooms could be enhanced by adding excess nitrogen over phosphorus (Egge & Heimdal 1994). E.
huxleyi further contributes to the production of dimethylsulphide (DMS), which is involved in cloud nucleation and may affect the regional climate (Westbroek et al. 1993, Puerta et al. 2005). Aside from the important ecological role for biogeochemical cycles and climate E. huxleyi is easy to cultivate in its asexual diploid phase, which made it a model organism for phytoplankton researchers.
E. huxleyi has a complex life cycle consisting of a calcified non-motile diploid and a non-calcified motile haploid life phase (von Dassow et al. 2009). Under laboratory conditions transition of diploid cultures to haploid could be induced by exposure to giant phycodnaviruses (Emiliania huxleyi viruses,
EhVs) (Frada et al. 2008). However, the underlying mechanism is still unclear (Frada et al. 2008). The haploid phase is resistant against those viruses leading to the assumption that the haploid phase is a escape strategy to those specific viruses (Frada et al. 2008). Both phases can reproduce asexually, which is actually the case under standard cultivation conditions. However, in nature sexual reproduction is likely to be common, even during blooming (Iglesias-Rodriguez et al. 2006). Evidence are for example many different genotypes even in bloom situations (Krueger-Hadfield et al. 2014).
For the calcified phase six morphotypes are known that can be differentiated according to size and coccolith morphology (Young et al. 2003).
E. huxleyi belongs to the group of heterococcoliths were calcification is an intercellular process, in opposition to the group of holococcoliths were coccoliths are formed at the cell surface (Young et al.
1999). In E. huxleyi calcification is a highly regulated process and takes place in a Golgi-derived intracellular vesicle, the coccolith vesicle (CV) (van der Wal et al. 1983). The regulation of Ca2+ in the CV is complex, since Ca2+ is involved in many cellular signal transduction processes and therefore the free cytosolic Ca2+ is maintained low (Mackinder et al. 2010). H+-ATPases maintain an H+ electrochemical gradient to accumulate Ca2+ via Ca2+/H+ exchangers from the cytosol to the CV. Once the necessary oversaturation is achieved the H+-ATPases activity is shut down, leading to an alkalinization of the CV lumen and a precipitation of calcite (Mackinder et al. 2010). The carbon source for calcification is believed to be HCO3-
. The production of calcite out of Ca2+ and HCO3-
produces a proton with a stoichiometry of 1 and hence leads to acidification of the CV lumen if not neutralized or removed. Further, HCO3-
is part of the intracellular HCO3−
/CO32−/
CO2 buffer system, which regulates the cytosolic pH (Brownlee et al. 1995). Under ocean acidification E. huxleyi has problems maintaining cytosolic pH (Suffrian et al. 2011). It has been shown, that voltage-gated proton channels serve to quickly release excess protons produced in calcification from the cytosol.
The plasma membrane potential is disrupted be seawater acidification and hence the regulation of pH. Hence, growth rate and calcification in E. huxleyi under ocean acidification are reduced.
Increasing atmospheric CO2 imposes two counteracting effects upon E. huxleyi. On the one hand, CO2
and bicarbonate ions can become limiting substrates for photosynthesis (Buitenhuis et al. 1999), on the other hand excessive CO2 in the atmosphere lowers the pH in seawater, which causes problems in the process of calcification (Bach et al. 2011). At very low concentrations of CO2, E. huxleyi suffers due to lack of photosynthesis substrate (Buitenhuis et al. 1999). At high CO2 concentrations it suffers of the reduced pH that comes along with the CO2 increase (Bach et al. 2013). However, the optimum pCO2 is strain and temperature specific (Langer et al. 2009, Sett et al. 2014). For example the pCO2
optimum for growth changes from 622 to 1295 µatm for temperature increasing from 15°C to 20°C (Sett et al. 2014). Notice, that the pCO2 optimum for growth does not equal the pCO2 optimum for
calcification (Sett et al. 2014). For temperature there are optimum curves as well, given constant carbonate system condition. Depending on the geographical origin (Norway, Azores) the optimum growth is at a different temperature indicating local adaptation (Zhang et al. 2014).
The selection regime: warming and acidification
Global change is induced by mankind through increasing CO2 emissions. In the ocean that leads to different effects. While ocean acidification is a direct and inevitable result of CO2 dissolving in seawater, temperature increase is indirect and subject to a certain model uncertainty.
The Earth atmosphere is heated by the sun’s short-wave radiation. Without the atmosphere the temperature of the Earth’s surface would be around -18°C (Mitchell 1989). This increase in surface temperature which is above the effective radiation temperature is known as the greenhouse effect, and the involved gasses as greenhouse gasses (Mitchell 1989). Approximately 84% of the total heating of the Earth system has gone into the oceans in the past 40 years (Levitus et al. 2005). The upper 75 m of the ocean warmed by 0.11 °C per decade (IPCC 2014), leading to a sea level rise due to the thermal expansion of sea water and more important in this context, to numerous range shifts of animals and plants that 'track' their climate zone (Parmesan & Yohe 2003).
CO2 is one of the most important greenhouse gasses. Climate reconstructions derived from ice-cores showed a significant relationship between CO2 concentration in the atmosphere and the mean global temperature. During the last ice age the CO2 concentration was below 200 ppm CO2 (Monnin et al.
2001), while the pre-industrial level was about 280 ppm CO2 (Meinshausen et al. 2011). Today’s CO2
concentration is about 400 ppm CO2 as a result of anthropogenic CO2 emissions (March 2015, Mauna Loa, Hawaii)(IPCC 2014). Earth system models project a further increase in CO2 levels up to 1000 ppm CO2 until the end of the century in the case of unabated CO2 emissions (IPCC 2014), with the corresponding global temperature increase of 2-4°C (IPCC 2014).
The atmosphere is in constant equilibrium with the surface ocean for gas exchange. About 30 % of the annual anthropogenic CO2 emission is absorbed by the ocean (Bakker et al. 2014). However, unlike O2 or N2 CO2 reacts with water (H2O) according to following equilibrium:
Oceanic uptake attenuates excess anthropogenic CO2 in the atmosphere. However, this uptake entails profound changes in seawater carbonate chemistry. The increasing pCO2 in the atmosphere leads to an increasing dissociation of to and an increase in H+-ions. The equilibrium shifts to more and a decrease of due to the decrease in pH. This lowering in pH led to the term
‘ocean acidification’ for the subsequent changes in carbonate chemistry, caused by anthropogenic CO2 emissions.
Warming has far-reaching implications, since all metabolic processes are temperature dependent.
Observations over the past decades revealed a decrease in phytoplankton abundance (Boyce et al.
2010), productivity (Behrenfeld et al. 2006) and phytoplankton size followed by a change in community composition (Morán et al. 2010). These observations are assumed to be direct or indirect associated to temperature increase. Ocean models predict a further decrease in ocean productivity, mainly because of the stronger stratification and accompanied nutrient limitation (Bopp et al. 2001, Steinacher et al. 2009). Not considered in those models is the direct thermal response of individual phytoplankton species. The thermal response in growth can be plotted as temperature-growth- curve. Most of these curves show two particular features, unimodality and negative skewness (i.e., a sharper decline in fitness above the optimum temperature than below). This makes phytoplankton living close to the temperature optimum more sensitive to warming than to cooling. Physiological models therefore predict tropical phytoplankton to be most vulnerable to global warming (Thomas et al. 2012). Dependent on temperature, and the nutrition obviously, the global distribution pattern is about to change (Thomas et al. 2012). However, disregarding the physiological implications, evolutionary adaptation is a possibility to attenuate effects of global warming. Eco-evolutionary models calculate higher optimal temperatures for tropical phytoplankton than they actually are (Thomas et al. 2012), suggesting that there may be constraints between thermal adaptation and other factors (e.g. CO2, nutrients,…) (Thomas et al. 2012).
However, how temperature and acidification act together as selection factors has hardly been investigated. There is evidence from ecophysiological experiments that elevated temperature could offset the response of E. huxleyi to increasing CO2 (Benner et al. 2013). However, there is no experiment that distinguishes between the single effects of temperature and CO2, and the combination of both so far.
Considerations in experimental evolution
According to Kassen (2002) the appropriate evolutionary experiment is as follows.
“A base population, which may be genetically uniform or diverse and either sexual or asexual, is inoculated into an environment, which may be heterogeneous or homogeneous, and natural selection is allowed to proceed for as many generations as one's patience allows. Samples are then extracted from each of the selected lines and their fitness assayed across a range of environments, preferably the same environments used during selection. The results are then cast in a genotype-by- environment matrix, where each of the selected lines are the different levels of genotype.”
In the assay experiments the evolutionary adaptation can be revealed by two different approaches:
The performance of the selected lines across all environments can be compared against theirs founders or an unselected control line. In this case adaptation to lab condition is part of the tested adaptation (Kassen 2002). To determine specific adaptation to a certain environment the selected lines have to be tested in their selection environment against lines that evolved under control (=ancestral) conditions. If there is adaptation, the selection line should show higher Darwinian fitness in its selection environment (Kassen 2002). Latter approach is suitable for experiments to global change, as the selection lines would evolve at ambient and future ocean conditions. When compared in an assay experiment, the difference between the selected populations at the corresponding conditions (future ocean) and control lines (ambient ocean) is the adaptive effect. The correlated response (the difference of ambient selected lines to future ocean selected lines at ambient conditions) reveals the costs of adaptation to a certain environment (Fig.1).
Fig 1. General scheme of a reciprocal experiment. After several generations of selection under selection/control conditions, populations are duplicated and the duplicates transferred into the contrary assay conditions. There the populations are compared in growth rate (the parameter selected for), and other phenotypical parameters. The comparison at selection conditions reveals the adaptive response, while the comparison at control conditions is the cost of adaptation.
Phytoplankton can reproduce both sexually and asexually. Under asexual reproduction the generation time (i.e. time between cell divisions) is relatively short, and in lab culture about 500 generations per year can be accomplished easily. Completely asexual selection regimes of diploid organisms, like E. huxleyi, can suffer from mutational load, which is a fitness reduction of a
population owing to accumulated deleterious mutations in the gene pool (does not apply for haploid organisms) (Kimura & Maruyama 1966). Populations with recombination are supposed to tolerate a higher mutational load compared to asexual populations (Rice 2002). Deleterious mutations are faster purged from the population, and beneficial mutations can be combined due to recombination (Rice 2002). However, sex is also accompanied with costs, such as mating and gamete production (Rice 2002). Sexual reproduction increases the rate of adaptation (Kaltz & Bell 2002). Hence, the adaptation rate in our asexual selection regime may underestimate the adaptive rate under natural conditions. However, the selective advantage of sex may only be present as long as adaptation is incomplete (Kaltz & Bell 2002).
Thesis outline
The following three chapters contain the main results of my thesis in the format of scientific publications, one of which (chapter II) is already published (Schlüter et al. 2014). In the end will be a synthesis that discusses the results of all three chapters and sets them into perspective.
Publication 1 is about the longest evolutionary experiment conducted in any marine species to date.
This work is continuing the evolutionary experiment described in Lohbeck et al. (2012), which showed increased growth and calcite per cell in E. huxleyi after 500 asexual generations of elevated CO2 selection. The selection was monitored over 2100 generations and revealed that adaptation is certainly not a straight process. While the adaptation in growth rate was still increasing depending on CO2 level, calcification was adaptively decreased after 500 generations. However, reduction in calcification was an effect of adaptive plasticity.
Publication 2 is whether or not adaptation to temperature is influenced by previous 1600 generations of CO2 adaptation, compared to treatments which experienced no ocean acidification. E.
huxleyi could adapt to temperature increase, apparent through higher growth rates which were up to 16% higher in populations adapted for one year to warming when assayed at their upper thermal tolerance limit. The effect of temperature adaptation was roughly three times larger than adaptation to CO2 at 15°C. There were no constraints of previous adaptation to CO2 on temperature adaptation.
The combined effect of temperature and CO2 alone was larger than the single temperature effect. A major temperature effect was the decline in cell size over time, which further decreased in replicates subjected to temperature adaptation. After temperature adaptation the cellular PIC:POC-ratio (inorganic to organic carbon-ratio) changed from lower PIC:POC at high CO2 compared to ambient CO2 to the opposite.
Publication 3 addresses the complementary question of chapter 2, namely the consequence of co- varying temperature adaptation on the existing CO2 adaptation. Thus, in the assay experiment only the CO2 regime was reciprocally varied, while the temperature stayed as under the selection conditions. After 480 generations of combined selection, temperature adaptation caused an increase in the positive adaptive effect to elevated CO2. The adaptive response to CO2 selection and temperature selection was additive. Further we found changes in correlated traits after combined selection. The adaptive reaction in cell size to CO2 reversed from an adaptive decrease at 15°C to an adaptive increase at 26°C. The physiological response in PIC per cell to acidification is diminished at high temperature and no adaptive response was visible. The changes in POC per cell were CO2-level dependent, with a loss of adaptive response at medium and similar reduction to CO2 at high level.
Adaptive effects on population production were based on adaptation in growth rate and resulted in partial restoration.
Publication I
Author contribution
This chapter is in preparation for publication in a scientific journal under multiple authorship. My contribution to this work is described below.
Title:
Long-term dynamics of adaptive evolution in a globally important coccolithophore to ocean acidification
Authors:
Lothar Schlüter, Kai T. Lohbeck, Joachim P. Gröger, Ulf Riebesell, and Thorsten B. H. Reusch Published in:
In preparation for submission Author contributions:
LS and TR conceived the study, LS performed the experiments and conducted the analyses, JG conducted the time series analyses, LS and TR wrote manuscript and all authors edited the manuscript.
Long-term dynamics of adaptive evolution in a globally important coccolithophore to ocean acidification
L. Schlüter,1 K. T. Lohbeck,1† J. P. Gröger,3 U. Riebesell,2 T.B.H. Reusch1*
1Evolutionary Ecology of Marine Fishes, GEOMAR Helmholtz-Centre for Ocean Research Kiel, Düsternbrooker Weg 20, 24105 Kiel, Germany.
2Biological Oceanography, GEOMAR Helmholtz-Centre for Ocean Research Kiel Düsternbrooker Weg 20, 24105 Kiel, Germany.
3Living Marine Resources Research Unit, Thünen-Institute of Sea Fisheries, Palmaille 9, 22767 Hamburg, Germany.
* corresponding author, e-mail treusch@geomar.de
† present address: University of Gothenburg, Department of Marine Sciences, Sweden, e-mail kai.lohbeck@gu.se.
Abstract
Owing to their large population sizes and short generation times marine phytoplankton may adapt to global change, for example to ocean warming or acidification. Long-term adaptation to novel environments is a dynamic process and phenotypic change can take place thousands of generations after exposure to novel conditions. We conducted a long- term evolution experiment (4 yrs = 2,100 generations) in the abundant and widespread coccolithophore species
Emiliania huxleyi. We find that long-term adaptation to oceanacidification is complex and initial phenotypic responses may revert for ecologically important traits. While fitness increased slightly over time in response to medium CO
2conditions (1100 μatm
pCO2), a fitness advantage of 5% remained unchanged over 4 yrs of adaptation in response to high ocean acidification levels (2200 μatm
pCO2). The biogeochemically important trait of calcification was partially restored within the first 500 generations but later reduced in response to selection, enhancing physiological declines of calcification in response to ocean acidification. Interestingly, calcification was not constitutively reduced but particulate inorganic carbon (PIC) cell quotas returned to control treatment levels when transferred back to present-day CO
2conditions (400 µatm
pCO2).
Some trait changes were likely associated with selection for higher cell division rates under
laboratory conditions, such as reduced cell size and lower particulate organic carbon content
per cell. Our results show that phytoplankton may evolve phenotypic plasticity that can
affect biogeochemically important traits, such as calcification, in an unforeseen way under
future ocean conditions.
Introduction
About half of the global primary production is contributed by marine phytoplankton (Field, Behrensfled, Randerson, & Falkowski, 1998). They not only form the base of marine food webs, but play a major role in global biogeochemical cycles by turning inorganic carbon and minerals into particulate organic matter that may eventually be transported into the deep ocean via sedimentation, a process known as the biological carbon pump (Falkowski, Fenchel, & Delong, 2008).
Coccolithophores, unicellular eukaryotic algae belonging to the haptophytes, are important contributors to the ballasting of organic particles (Armstrong, Lee, & Hedges, 2001). Their cells are covered by tiny calcite platelets, the coccoliths, which have a much higher density than seawater. As many marine calcifying organisms, coccolithophores suffer from ocean acidification (OA, (Kroeker, Kordas, Crim, & Singh, 2010), the dissolution of excess anthropogenic CO2 in ocean waters (Caldeira
& Wickett, 2003), by decreases in calcification and growth rates (Meyer & Riebesell, 2015; Riebesell
& Zondervan, 2000). Recent evolution experiments demonstrated, in line with evolutionary theory and results in model microbes, adaptation to OA and warming in the globally important coccolithophore Emiliania huxleyi (Lohbeck, Riebesell, & Reusch, 2012; Schlüter et al., 2014). Above studies ran for approximately 1 y (≈500 asexual generations). From evolutionary model species such as Escherichia coli and yeast it is well known that adaptive evolution is a dynamic process even in the simplest experiments, designed with a single clone (or genotype) as starting 'population'. For example adaptation to novel conditions via selective sweeps may be delayed by clonal interference (Desai, Fisher, & Murray, 2007; Lang et al., 2013), adaptive improvements may be sudden and step- wise when mutations are rare (Elena, Cooper, & Lenski, 1996) and consecutive beneficial mutations may depend on one another, introducing lineage-specific historical contingency (Blount, Borland, &
Lenski, 2008). Hence, further phenotypic changes can occur over several thousand generations. For example, in E. coli an adaption to citrate utilization arose 31,500 generations after initial exposure to glucose minimal medium that was citrate enriched (Blount et al., 2008). A recent 15-y time series reports evidence for adaptive changes of natural phytoplankton communities to yearly variation in environmental conditions (temperature and irradiance) (Irwin, Finkel, Müller-Karger, & Troccoli Ghinaglia, 2015).
Here, we evolved replicate populations of E. huxleyi for 2100 asexual generations (4 yrs) to ambient (400 µatm pCO2) and two elevated pCO2 levels, a medium concentration predicted for the worst- case, end-of-the-century level (1100 µatm, (Stocker, 2013)) and a high, proof-of-principle concentration (2200 µatm pCO2) that is temporarily found in contemporary coastal waters under upwelling (Melzner et al., 2013), and will be maximally reached in the year 2300 (Caldeira & Wickett, 2003). Upon initial findings of a partial restoration of calcification in E. huxleyi (Lohbeck et al., 2012),
we were particularly interested in how calcification played out in subsequent years. Another important question was whether or not adaptive evolution would lead to complete restoration of algal performance and fitness under OA compared to non-adapted controls when both were assayed under ocean acidification conditions.
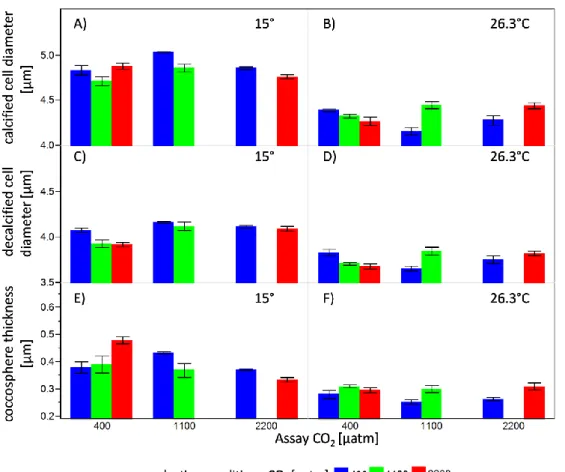
Results
Over 2100 asexual generations, mean exponential growth rates in all treatments increased with time (µ * generation-1: ambient CO2 6.56 x 10⁻⁵, medium CO2 4.33 x 10⁻⁵; high CO2 7.60 x 10⁻⁵, ARMAX model with significant autocorrelation terms, all trends P<0.001), with no detectable difference between treatments (Fig. 1A). In contrast, cell diameter decreased over time in all treatments, again with no difference among the treatment levels (Fig. 1B, ARMAX model all trends P<0.001). Thus, cells had between 12 and 22% less volume at the end of year 4 compared to the starting populations.
These background changes owing to the general selection regime in the laboratory need to be taken into account when interpreting the adaptive responses owing to simulated ocean acidification.
To asses evolutionary responses to elevated CO2 and in order to control for general laboratory adaptation, we measured growth rates of medium and high CO2 adapted populations in the respective elevated CO2 environment via reciprocal assay experiments relative to control populations that at the same time had evolved under ambient CO2 conditions (Collins, 2011). In all assay experiments, populations were acclimated for at least one full batch cycle (7-8 generations) to their novel condition. Assay experiments were conducted at five time points (500, 1000, 1200, 1600 and 2100 asexual generations), and also included a test of the correlated response, the back-exposure of populations evolved under elevated CO2 to ambient conditions (Fig. S2).
We focus here on the time course of the adaptive response (Fig. 2) which is given by the difference between control populations (always depicted as solid line) relative to populations that were allowed to long-term adapt to OA, both tested under OA conditions. In all assay experiments CO2-selected population grew faster than non–adapted ones when assayed under both medium and high CO2 (Fig.
2A,B; repeated measurement rmANOVA, medium CO2-selection, F1,8=43.92, P=0.0002; high CO2- selection: F1,8 = 53.72, P<0.0001). Growth rate adaptation increased over time under medium CO2- selection (rmANOVA, time x selection: F4,32=2.941, P=0.035). Under high CO2 selection the adaptation effect was continually present and did not increase further, nor was there a significant fluctuation of the adaptive response (rmANOVA, time x selection,F4,32=1.991, ns). Except for the first assay experiment after approximately 450 generations, medium and high-CO2 selected populations grew slower compared to controls under ambient pCO2 (Fig. S2A), thus revealing a cost to adaptation.
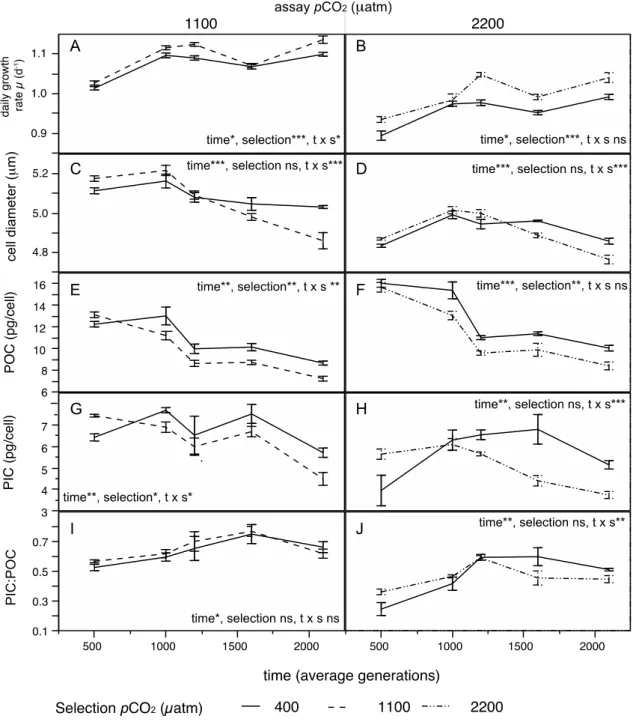
Fig. 1. Time course of exponential growth rates (A) and cell diameter (B) in Emiliania huxleyi over 4 yr of selection to three different CO2 concentrations, simulating ocean acidification. Growth rates and cell sizes were calculated every 5- days upon transfer of batch cultures. All lines reveal highly significant slopes that are not significantly different among CO2 treatments. As we were not specifically interested in detecting a response level difference but differences in the time trends (i.e. slopes), and as temporal variables are usually autocorrelated, the trend lines were not estimated based on simple regression but using a series of Autoregressive Moving Average Models with exogenous variables (ARMAX models, transfer functions).
Fig. 2. Evolutionary response of Emiliania huxleyi to selection under three CO2 conditions simulating ocean acidification.
Depicted is the adaptive response over 4 years measured during assay experiments at 5 time points (x-axis, average generations of all three CO2 treatments), always comparing medium- (left) and high-CO2 adapted (right) vs. non-adapted populations of E. huxleyi in three different CO2 environments, when assayed under elevated CO2 (mean±SD, n=5). (A,B) exponential growth rate (C;D) cell diameter (E,F) particulate organic carbon per cell (POC cell-1) (G;H) particulate inorganic carbon per cell (PIC cell-1) (I,J) ratio of PIC:POC. Significant results of main and interaction effects are depicted with asterisks (*0.05≥P>0.01, **0.01≥P>0.001, ***P<0.001). Complete repeated measures ANOVA results are given in Table S1. The correlated response, i.e. the performance of all selection treatments under ambient CO2 is presented in Fig.
S2.
Next we focused on ecologically important cell traits that were not directly subjected to selection such as cell sizes and elemental quotas. For cell size the phenotype changed in the course of the 4-yr experiment. While medium and high CO2 selected cells were initially larger, they became smaller
after 1400 generations relative to control populations (Fig. 2C,D, rmANOVA, time x CO2-selection, medium: F4,32=11.44, P<0.0001; high: F4,32=10.89, P<0.0001), although the main effect CO2 selection was not significant (rmANOVA, medium: F1,8=0.762, ns; high: F1,8=0.593, ns). Note that cell size changes associated with adaptation to elevated CO2 are superimposed by a general trend towards smaller cells in all treatments (Fig. S2B; Fig. S2B).
The particulate organic carbon (POC) content of the cells decreased over time in all treatments as a consequence of selection under elevated CO2. Compared to short-term exposed controls, we observed a decrease of POC-content under both medium and high CO2 selection (Fig. 2E,F, rmANOVA, medium CO2 selection: F1,7=18.13, P=0.0038; high CO2 selection: F1,6=17.45, P=0.0058), with the interaction with time being non-significant in both cases. Except for a non-significant decrease at 1000-generations, the general decrease in POC is apparent for all three selection treatments under ambient pCO2 (correlated response, Fig. S2C). Owing to the 12-22% decrease in cell volume across treatments we standardized cell quota by cell volume. The general picture remained the same, especially in the high CO2 selection treatment (Fig. S3A,B; rmANOVA: medium CO2
selection F1,7=6.47, P=0.0384; high CO2 selection F1,6=12.42, P=0.0124).
We were particularly interested how cell quotas in particulate inorganic carbon (PIC) would change throughout the selection experiment. We expected that given sufficient time, the observed partial restoration of PIC cell quotas after 500 generations (Lohbeck et al., 2012) would be completely restored in both, medium and high-CO2 treatments. Contrary to expectations, PIC cell quotas markedly decreased after generation 1000 to be lower in populations adapted to high CO2 than in non-adapted controls when subjected to OA conditions (Fig. 1G,H; rmANOVA, time x CO2: medium CO2 selection: F4,28=4.85, p=0.0042; high CO2 selection: F4,24=6.79, P=0.0008). In response to medium and high CO2 selection, CO2 adapted populations displayed 21% and 22% lower PIC, respectively, compared to the physiological decline of PIC in the control populations under medium and high CO2
(Fig. 2G,H; all at 2100 generations). This pattern remained after we standardized PIC content on cell volume to compensate for the general decrease in cell size over time (Fig. S3C,D; rmANOVA, time x CO2: medium CO2 selection: F4,28=3.95, P=0.0115; high CO2 selection: F4,24=5.58, P=0.0025). In terms of PIC:POC ratio we found an interaction of time and CO2 selection in the high, but not in response to medium CO2 selection (Fig. 1I,J, rmANOVA, time x CO2: medium: F4,28=0.3378, ns; high: F4,24=6.36, P=0.0012).
Fig. 3. Reaction norms of Emiliania huxleyi populations selected under ambient and high CO2 conditions as a function of the assay condition. Depicted are (A, B) daily growth rate, (C, D) particulate organic carbon POC; (E, F) particulate inorganic carbon (PIC) and the PIC:POC ratio (G, H) after 2100 generations of evolution (4 yrs). Given are mean values (±1SD, n=5). Significant results of planned contrasts only for the adaptation response (i.e. under elevated CO2) are indicated by asterisks (*0.05≥P>0.01, **0.01≥P>0.001, ***P<0.001).
For the last assay experiment we plotted population-wise reaction norms for important parameters under ambient and elevated CO2 levels to address the evolution of plasticity in traits other than fitness itself that accompanied adaptation (Fig. 2A,B). After 4 yrs, corresponding to ≈2,100 asexual generations, we observed a fitness increase in both selection treatments, resulting in 3.4% and 4.8%
fitness increase (calculated according to ref {Lenski, 1991 #2995}) under medium and high CO2, respectively, compared to control populations. Adaptation to OA was accompanied with ‘classical’
costs of adaptation in both medium and high CO2 when back-exposed at ambient CO2 (Fig. 2A,B; 2x2- ANOVA, interaction selection x assay CO2, both P<0.001).
The reaction-norm of the POC quota of cells after CO2 selection revealed a strong ‘overshooting’ of POC cell quota of non-adapted populations under medium (+20% POC, Fig. 2C) and high CO2 assay conditions (+19%, Fig. 2D) compared to high-CO2 adapted ones. Slopes of the reaction norms in