Elio Padoano Franz-Josef Villmer
The proceedings of the seventh International Conference on Production Engineering and Management, held between September 28 and 29, 2017 at the University of Trieste (Italy), collect the works carried out by professors, lecturers, researchers, graduates and students of the University of Trieste (Italy), the OWL University of Applied Sciences, Lemgo (Germany) as well as experts from other European universities and from industry. The main aim of the seventh edition of the conference has been to cover a broad range of topics and to bridge the gap between theory and practice in the field of Production Engineering and Management by offering an occasion where academia and industry could discuss practical and pressing questions. The topics of the conference therefore include not only production technologies and management in a narrower sense, but also new aspects of direct digital manufacturing, of lean management, of innovation techniques and methodologies, along with different topics of high interest for the wood processing and furniture production and addresses sustainable and revolutionary developments in modern industry.
Prof. Ing. Elio Padoano, PhD, is an associate professor of Operations Management at the University of Trieste; he also teaches evaluation methodologies in master and doctoral courses. He has coordinated research projects regarding evaluation methods for capital projects, sustainable production and business process reengineering.
Prof. Dr.-Ing. Franz-Josef Villmer is a professor for Engineering and Design at the OWL University of Applied Sciences; he teaches product development, project management, rapid development and innovation management. From 2011 to 2013 and from 2015 to 2017 he served as president of the Academic Council of the International Master Program Production Engineering and Management.
ISBN 978-3-946856-01-6
Production Engineering and Management
7
thInternational Conference
September 28 and 29, 2017 in Pordenone, Italy
PADOAN O — VILLMER PRODUC TION ENG INEER ING AND MANAG E MENT 2017
Production Engineering and Management
Proceedings 7 th International Conference
September 28 and 29, 2017 Pordenone, Italy
Production Engineering and Management
edited by
Elio Padoano Franz-Josef Villmer
padoano@units.it franz-josef.villmer@hs-owl.de
Scientific Committee
Egidio Babuin (University of Trieste, Italy) Daria Battini (University of Padua, Italy) David Bogataj (University of Padua, Italy) Franco Bulian (CATAS S.p.A., Italy)
Martina Calzavara (University of Padua, Italy) Raffaele Campanella (University of Trieste, Italy) Francesco Costantino (Sapienza University Rome, Italy) Goran Dukic (University of Zagreb, Croatia)
Wilfried Jungkind (Ostwestfalen‐Lippe University of Applied Sciences, Germany) Li Li (Ostwestfalen‐Lippe University of Applied Sciences, Germany)
Antonella Meneghetti (University of Udine, Italy) Marino Nicolich (University of Trieste, Italy) Fabio Nonino (Sapienza University Rome, Italy)
Micael Öhman (Luleå University of Technology, Sweden) Elio Padoano (University of Trieste, Italy)
Roberto Pinto (University of Bergamo, Italy)
Adrian Riegel (Ostwestfalen‐Lippe University of Applied Sciences, Germany) Fabio Sgarbossa (University of Padua, Italy)
Massimo Tronci (Sapienza University Rome, Italy)
Franz‐Josef Villmer (Ostwestfalen‐Lippe University of Applied Sciences, Germany) Helmut Zsifkovits (Montanuniversität Leoben, Austria)
All papers in the volume underwent a rigorous referee review under the supervision of the volume editors.
Volume 01/2017
Publication Series in Direct Digital Manufacturing Department of Production Engineering and Management OWL University of Applied Sciences, Lemgo (Germany)
Layout and design: Andrea Huxol, Andrea Davis Cover illustration: © taaee/fotolia
Copyright © 2017 by Elio Padoano, Franz-Josef Villmer All rights reserved.
This document and all of its parts are protected by copyright. Any use beyond the narrow limits of copyright law is inadmissible and liable to prosecution without the consent of the publisher and the authors. This applies in particular to duplications, translations, microfilming and storage and processing in electronic systems.
ISBN 978-3-946856-01-6
PREFACE
It is our pleasure to introduce the seventh edition of the International Conference on Production Engineering and Management (PEM), an event that is the result of the joint effort of the University of Trieste and the Ostwestfalen-Lippe University of Applied Sciences. The conference has been established as an annual meeting under the Double Degree Master Program
“Production Engineering and Management” by the two partner universities.
This year the conference is hosted at the university campus in Pordenone.
The main goal of the conference is to offer students, researchers and professionals in Germany, Italy and abroad, an opportunity to meet and exchange information, discuss experience, specific practices and technical solutions for planning, design and management of manufacturing and service systems and processes. As always, the conference is a platform aimed at presenting research projects, introducing young academics to the tradition of symposiums and promoting the exchange of ideas between the industry and the academy.
This year’s special focus is on industry sustainability, which is currently a major topic of discussion among experts and professionals. Sustainability can be considered as a requirement for any modern production processes and systems, and also has to be embedded in the context of Industry 4.0. In fact, the features and problems of Industry 4.0 have been widely discussed in the last editions of the PEM conference, in which efficiency and waste reduction emerged as key factors. The study and development of the connections between future industry and sustainability is therefore critical, as highlighted in the recent “German Sustainable Development Strategy and the 2030 Agenda”. Accordingly, the seventh edition of the PEM conference aims to offer a contribution to the debate.
The conference program includes 25 speeches organized in six sessions.
Three are specifically dedicated to “Direct Digital Manufacturing in the context of Industry 4.0” and “Technology and Business for Circular Economy and Sustainable Production”. The other sessions are covering areas of great interest and importance to the participants of the conference, which are related to the main focus: “Innovative Management Techniques and Methodologies”, “Industrial Engineering and Lean Management” and “Wood Processing Technologies and Furniture Production”. The proceedings of the conference include the articles submitted and accepted after a careful double- blind refereeing process.
Elio Padoano Franz-Josef Villmer
CONTENT
SESSION A
Direct Digital Manufacturing in the Context of Industry 4.0 Quality Control of Additive Manufacturing Using Statistical Prediction Methods
E. M. Scheideler, A. Ahlemeyer-Stubbe ... 3 Influencing Factors on Part Quality in Selective Laser Melting
A. Huxol, E. Scheideler, F.-J. Villmer ... 13 Participative Development of an Implementation Process for
Worker Assistance Systems
T. Kleineberg, M. Eichelberg, S. Hinrichsen ... 25
SESSION B
Innovative Management Techniques and Methodologies
Total Productive Manufacturing Approach for Quality Management in the Wood and Furniture Industry in Ghana
A. Riegel, S. L. Tekpetey ... 39 Successful Application of Agility Management in Consulting
Practice in China
C. Keller-Ebert, J. Ebert ... 51 Deployment of Process Capability Analysis for Single-Part
Production
A. Huxol, A. Davis, F.-J. Villmer, E. Scheideler ... 63 Prepare Organizations to Accept Risks: A Feasible Risk
Management Model
A. A. Ardebili, E. Padoano, F. Harsej ... 75
SESSION C
Direct Digital Manufacturing in the Context of Industry 4.0 Nondestructive Quality Check of Additive Manufactured Parts Using Empirical Models
E. M. Scheideler, A. Huxol, F.-J. Villmer ... 89 SLM Based Tooling for Injection Molding – Focus on Reduced
Effort in Surface Quality Optimization
O. Elstermeyer, F.-J. Villmer ... 101 Extending the Sliced V-Model to Smart Product Development
A. Deuter, A. Otte, M. Ebert ... 115 Investigation on the Direct Manufacturing of Waveguides and
Sensors Using FLM Technology
P. Ehlert, O. Stübbe, F.-J. Villmer ... 127
SESSION D
Industrial Engineering and Lean Management
Optimization of Automotive Logistics Network with Late Product Individualization
L. Li ... 139 Simulation Tool for Resources Optimization in a Production
Department
E. Pozzato, M. Nicolich, C. Poloni ... 151 An Instructional Program to Support Early Equipment Management in a Manufacturing Company
F. Furlan, E. Padoano, E. Gasparini, A. Congregalli ... 163
SESSION E
Technology and Business for Circular Economy and Sustainable Production
Sustainable Management of Biogas Produced with an Anaerobic Digestion Plant
L. Da Re, E. Di Bernardo, D. Pozzetto, L. Talon, M. Zonta ... 177 An Ergonomic Project to Increase Factory Efficiency
F. C. Grossi ... 191
SESSION F
Wood Processing Technologies and Furniture Production Preparation of Production and Manufacturing Documentation for Design Upholstered Sofa
J. Tauber, J. Svoboda, Z. Holouš ... 207 Influence of Geometrical and Technological Parameters on the Cut Quality When Cutting Melamine Faced Chipboard
M. Merhar, D. G. Bučar, G. Fajdiga ... 217 Autonomous Sanding Processes – An Overview over Analytical, Experimental and Fuzzy Control Process Models
A. Riegel, T. Hellmann, J. Hausmann ... 225 Durability Prediction of Wood Coatings
D. Tesařová, J. Hlavatý, E. Jeřábková ... 237
SESSION A Direct Digital Manufacturing in the Context of Industry 4.0
QUALITY CONTROL OF ADDITIVE MANUFACTURING USING STATISTICAL PREDICTION METHODS
E. M. Scheideler1, A. Ahlemeyer-Stubbe2
1OWL University of Applied Sciences, Lemgo, Germany
2ENBIS European Network for Business and Industrial Statistics, Eindhoven, the Netherlands
Abstract
Additive Manufacturing (AM) is increasingly used to design new products.
This is possible due to the further development of the AM-processes and materials. The lack of quality assurance of AM built parts is a key technological barrier that prevents manufacturers from adopting. The quality of an additive manufactured part is influenced by more than 50 parameters, which make process control difficult. Current research deals with using real time monitoring of the melt pool as feedback control for laser power. This paper illustrates challenges and opportunities of applying statistical predictive modeling and unsupervised learning to control additive manufacturing. In particular, an approach how to build a feedforward controller will be discussed.
Keywords:
Additive manufacturing, Process control, Predictive modeling, Predictive control
1 INTRODUCTION
Additive Manufacturing (AM) is increasingly used to design new products.
This is possible due to the further development of the AM-Processes and materials. The less of assurance of quality of AM built part is a key technological barrier that prevents manufacturers from adopting Am technologies especially for high-value applications where component failure cannot be tolerated [1]. The lack of quality implies inadequate dimensional tolerances, surface roughness, embedded material discontinuities, and defects. Part quality issues may be attributed to AM process parameter settings. The settings are typically chosen by a trial and error process, which is time-consuming. More and more modeling is used to get a deeper understanding of the physics of AM process. Significant effort has been dedicated to the search of predetermined optimal processing conditions which result in desired mechanical properties for a given part. This optimization can be done with commercial modeling packages, mostly based on finite element methods. However, this approach is not economical nor robust enough to deal with perturbations. Uncertainty in the simulation inputs
and simplification of physical phenomena lead to uncertainty in the process parameters and thus the optimization is less beneficial. [2] [3]
Process control in general can limit the lack of quality assurance of AM built parts and the lack of the known variance of optimized process parameter from physical models.
This paper will discuss a new approach to using metamodel technologies to enable process optimization, to improve the AM part quality and to reduce the number of insufficient AM parts. The main goal is to reduce the waste of time and money by either detecting major errors of the AM part in a very early stage and stop the building job or fixing an expected defect during the build process by changing process parameters.
2 STATE OF THE ART
Using additive manufacturing to build a part with certain desired properties such as dimensional accuracy, part density, mechanical properties or microstructures can be challenging for several reasons. First, the number of parameters that have to be determined in an AM process is large. Second, some parameter can vary during the build process. For example, the porosity of powder bed may change depending on the distribution of the powder size particles in a layer. Third, some parameter could vary across builds, for example, if the lens focusing the laser beam gets polluted. Finally some material properties such as the absorptivity cannot be known precisely. In conclusion, these factors introduce uncertainties that influence the repeatability of the process and create uncertainties in the properties of the AM parts [4].
2.1 Process parameters correlation
The view on process parameter correlation follows the ideas of Mani et al. [5].
In an AM process there exist correlations between the process parameters, process signatures and product qualities. The AM process parameters are the inputs, which sometimes determine with uncertainties. The process parameters can be categorized either in controllable such as laser power and scan speed or predefined parameters. For example, material properties are predefined for every build job. The process signatures are dynamic characteristics of the powder heating, melting and solidification processes as they occur during the AM process. They are categorized into either observable that means measurable signatures or derived and determined from analytical modeling or simulation. The product qualities are also grouped in geometric, mechanical and physical qualities. Figure 1 identifies the correlation between the three categories which should facilitate the development of in process sensing and real-time control of AM process.
Figure 1: Correlation between process parameters, process signatures and product qualities [5].
Mani et al. identified a large number of process signatures which may potentially be monitored to identify irregularities that might result in poor product quality [5].
The basic idea as given in Figure 1 is categorizing the parameters and identification of their general relationship. This is used as foundation for the described models in chapter 3.
2.2 Computational models
Process signatures that cannot be measured during production, need simulation models for derived parameters like melt pool deep or residual stress. A number of scientific investigations were devoted to the numerical analysis of the thermal processes during laser beam melting. One of the studies was conducted by IIin et al. [6]. This study focuses on the numerical analysis of the temperature distribution in the vicinity of the melt pool during laser beam melting process depending on the local geometry of the generated part. They use a simulation model to optimize the laser beam melting technique towards a stable formation of the melt pool during the entire generating process.
Commercial simulation tools allow predictions of the temperature during the build process and can therefore be used to forecast the distortion and residual stresses in the AM part. Normally these predictions take not into account the uncertainty of the input parameters or the variability in the process itself.
Running these simulation tools is a preliminary work for the optimization of process parameters like laser power or laser scan speed. It is possible to calculate with these simulations tools several controllable process parameters like the needed laser power, laser scan speed etc. These values can be calculated for every position on every layer. Because of the long computing times, it is not possible to use this kind of technology during the build process to control the process parameter.
2.3 Current control schemes in AM
Process control has been identified as an important tool to overcome the lack of quality and reliability in AM processes. Feedback control allows the intelligent modulation of process parameters following measurements of process signatures. Feedback control approaches for AM are often utilized in directed energy deposition processes. Most approaches are based on thermal signals gathered with cameras and photodetectors. The typically used algorithms are based on proportional-integral derivative (PID) controllers [3] [7]. Sometimes more advanced approaches, like model predictive control (MPC), are used. The feedback control is used with process signatures which are measurable or with derived signatures. A feedforward control is used for tuning the laser cladding melt pool shape online [8].
Adopting feedback control methods in AM is constrained by significant barriers. One is the lack of appropriate models for online estimation and control as well as the high sampling rates required to capture fast solidification dynamics in metal based AM.
3 RESEARCH APPROACH
The use of statistical methods will be useful to handle the process control in AM systems. Normally an AM process, for example, the selective laser melting (SLM) process, depends on about 50 parameters [9]. Some parameters are precisely known, other parameters have a higher variance.
To manage the process control with predictive modeling two hypotheses must be valid. First, an effective direction must be existent in the process. This means small defects in layer n lead to errors in future layers n+y. Every AM part is sliced in layers. y is the number of layers that have been built until the known defect at layer n becomes a crucial defect at layer n+y, which in turn damages the AM part (see Figure 2). The second hypothesis implies a different significance of the layers. Not every layer has the same importance for future layers. The previous layer is most important for the following one.
Former layers are less important.
Figure 2: Hypothesis error spread.
A single layer is generated during one laser scan. A layer itself is divided in cubes. Every cube has the height of the layer thickness and the area is the square of the track distance + variance. A cube as defined here may contain more than one voxel. It is important that all dimensions of the cube relate directly to process parameters as illustrated in Figure 3.
Figure 3: Geometry with cubes, voxel and laser beam.
The basic idea is to detect a situation that will lead to a potential low-quality piece, before the situation itself happens. Practically this means small deviations in layer n lead in summary to a relevant error in layer n+y. After detection of small defects, the parameters might be adjusted in layer n+x to avoid the error in n+y, assuming x is smaller than y. Therefore it is important
that calculation time for forecasting errors from the data volume must be shorter than the time for production from layer n until layer n+x.
3.1 Predictive models in general
Predictive modeling is used to estimate an unknown dependency from known input-output data. Input variables might include quantities of different process parameters by a cube. Output variables might include an indication of the level of a cube of whether a defect happens or not. Output variables are also known as targets in predictive modeling.
In deployment, there is likely to be a time gap between using the model that has been developed and carrying out the activity. The analysis period consists of the base period (for the input variables) and the aim or target period (for the target or output variables). The base period always comes before the target period and reflects the time gap between running a model and using the results of the model (Figure 4) [10].
Figure 4: Development of models learning phase.
To visualize how the general set up can be used for AM processes the model learnings phases are added to the research approach.
Depending on former activities, an anticipation of the deployment time gap (y) can be made. Then a temporal mismatch can be added into the modeling data. This is crucial, because input variables such as geometry, laser power or melt pool temperature are generated for every layer until layer n and target variables generated e.g. out of the melt pool temperature are from a later period, say layer n+y. Note that the time period (y) may differ depending on the type of the AM process, AM machine or material.
This temporal mismatch of variables is a major difference to other statistical models and to the above-described state of the art solutions. It is possible that the measurement of some parameter until layer n is used as input
variables and adding the measurements at layer n+y to define the target variable. Besides the temporal shift in the data, the availability of the data also needs to be considered.
Figure 5: Phases in AM process.
It is to consider that at one point in time (Time 1) the model has to be built, at that time the target must be known. The whole input and target data are given from the past. After the model is validated it will be deployed at time 2 when only input variables are assessable. Within this deployment, a prediction of the target is generated. The prediction in turn gives an answer on the question whether the target is leading to a potential defect or the quality of the AM part is fine. Once the model is validated and established it can be also used for time 3, time 4 and so on.
4 PRAGMATIC WORKFLOW
To incorporate this knowledge and technology to a solution, which provides the opportunity to control and react on upcoming defects in any AM-process, the following workflow is defined. In general the Finite Element Modeling (FEM) and two metamodels (I and II) will be employed. The Finite Element Modeling is used to generate data for an ideal situation. This data will be used to build a simplified metamodel (I) that can be used to regulate the process to avoid potential future defects. Afterwards the likelihood of having a potential future defect is calculated by metamodel (I).
For phase time 1 following pre work has to be done.
• Define measurable outcome parameters, which show the optimum scope for results.
• Development and usage of relevant design of experiments (DOE).
• Data generation by DOE. Data that leads to good AM parts and data represent bad or defected parts are generated.
• Identification of potential standard parameters for a simplified metamodel (II) for deviation correction.
• Computer simulation (FEM) to identify the ideal outcome parameter per cube/per layer.
• Build a second metamodel (I) based on the data generated in the simulation. The aim of the model is to find a simplified and fast equation to estimate the outcome parameters as good as possible.
• As input parameters only machine parameters and known physical equations are accepted.
Figure 6: Deployment predictive control process.
Based on the workflow the following predictive control process can be developed.
Figure 6 shows the control process:
• Step 1: Start with calculating the ideal outcome parameter (𝑝𝑝𝑖𝑖𝑖𝑖𝑖𝑖𝑖𝑖𝑖𝑖) for every layer and cube with use of metamodel (I). Can be done before starting the building process itself in the preparation phase.
• Step 2: With metamodel (I) outcome parameters (𝑝𝑝(𝑛𝑛+y)) of layer n+y based on the actual measured data until layer n are estimated.
• Step 3: Compare the ideal outcome parameter (𝑝𝑝𝑖𝑖𝑖𝑖𝑖𝑖𝑖𝑖𝑖𝑖) with estimated outcome parameter (𝑝𝑝(𝑛𝑛+y)).
• Step 4: Calculate differences and correct some process parameter at layer n+x with the help of metamodel (II).
• Step 5: Use the corrected process parameter at layer n+x
The amount of layer x depends on the time for calculation and adjustment of the process parameter. This time must be less or equal compared to the time needed for production from layer n to n+x.
5 CONCLUSION AND OUTLOOK
The development of metamodels can be used to implement simple calculation rules for AM-process. Ideal outcome parameters 𝑝𝑝(𝑛𝑛+y) for every cube in a layer can be estimated easily for different forms and geometries.
The measured data until layer n and estimation of outcome parameters 𝑝𝑝(𝑛𝑛+y)
lead to a change in process parameter at layer n+x. This in turn leads to a better part quality and therefore to enormous time savings.
Based on this approach a controlling of the production process will be possible. A next step will be to evaluate the applicability of the theoretical concept described in this paper. The concept must be proven in an industry environment together with industrial partners.
REFERENCES
[1] Everton, S. K., Hirsch, M., Stravroulakis, P., Leach, R. K., & Clare, A. T.
(2016) Review of in-situ process monitoring and in-situ methodology for metal additive manufacturing. Materials & Design, 95, 431-445.
[2] Lopez, F., Witherell, P., & Lane, B. (2016) Identifying uncertainty in laser powder bed fusion additive manufacturing models. Journal of Mechanical Design, 138(11), 114502.
[3] Fox, J., Lopez, F., Lane, B., Yeung, H., & Grantham, S. (2016) On the requirements for model-based thermal control of melt pool geometry in laser powder bed fusion additive manufacturing.
[4] Kamath, C. (2016) Data mining and statistical inference in selective laser melting. The International Journal of Advanced Manufacturing Technology, 86(5-8), 1659-1677.
[5] Mani, M., Lane, B., Donmez, A., Feng, S., Moylan, S., & Fesperman, R.
(2015) Measurement science needs for real-time control of additive manufacturing powder bed fusion processes. National Institute of Standards and Technology, Gaithersburg, MD, Standard No. NISTIR, 8036.
[6] Ilin, A., Logvinov, R., Kulikov, A., Prihodovsky, A., Xu, H., Ploshikhin, V., Bechmann, F. (2014) Computer aided optimization of the thermal
management during laser beam melting process. Physics Procedia, 56, 390-399.
[7] Kruth, J. P., Mercelis, P., Van Vaerenbergh, J., & Craeghs, T. (2007) Feedback control of selective laser melting. In Proceedings of the 3rd international conference on advanced research in virtual and rapid prototyping (pp. 521-527).
[8] Moralejo, S., Penaranda, X., Nieto, S., Barrios, A., Arrizubieta, I., Tabernero, I., & Figueras, J. (2016) A feedforward controller for tuning laser cladding melt pool geometry in real time. The International Journal of Advanced Manufacturing Technology, 1-11.
[9] Van Elsen, M. (2007) Complexity of Selective Laser Melting: a new optimisation approach.
[10] Ahlemeyer-Stubbe, A., Coleman, S. (2014) A practical guide to data mining for business and industry. John Wiley & Sons.
INFLUENCING FACTORS ON PART QUALITY IN SELECTIVE LASER MELTING
A. Huxol, E. Scheideler, F.-J. Villmer
OWL University of Applied Sciences, Lemgo, Germany
Abstract
Selective Laser Melting (SLM) is a powder bed fusion process to produce additively metal parts. From the current point of view, it seems to be one of the most promising additive manufacturing technologies for the production of end use parts. An increasing number of examples prove the successful application of SLM for technical part production. Nevertheless, they also show the enormous effort that is still required to qualify the production process of every single part individually.
The present paper gives an overview of the major influencing factors of the SLM process. To get a comprehensive research approach, existing publications on the topic are taken into account as well as own experimental work, evaluating the effects of the process parameters on the relative density of samples made from tool steel. The experimental setup and the results are described and opportunities for the further research work are discussed.
Keywords:
Selective laser melting, Additive manufacturing, Process parameters, Process optimization
1 INTRODUCTION
Additive manufacturing (AM) describes a number of technologies that create parts directly from three-dimensional CAD data, by additive joining of volume elements, usually in layers [1]. Since the advent of the first AM machines in the late 1980s, developments in this field have generated a large variety of technologies. Today, a number of AM technologies show a degree of maturity that allows their application for final part production. One of the most important AM technologies for final part production is Selective Laser Melting (SLM), which is a powder bed technology that fuses metal materials by use of a laser.
Compared to traditional technologies such as milling, forging or casting, AM technologies provide a number of advantages [2]: As no molds or tools are needed, AM processes are suitable for the production of small lots and even single parts. Furthermore, they allow producing structures that are impossible or very difficult to realize with traditional technologies. Products with internal cavities, strictly defined porosity or surface structures are opening up a wide
area of applications. Currently, end-use applications can be found e.g. in aerospace [3] or in the dental industry [4].
Besides the many advantages of AM, there are also a number of shortcomings to be mentioned: The staircase effect results from the layer wise build-up of the parts and influences the geometrical accuracy of the produced parts. Additionally, dimensional accuracy and surface quality do sometimes not achieve the benchmark set by conventional manufacturing processes, especially such of subtractive technologies [5].
2 SELECTIVE LASER MELTING PROCESS 2.1 Process description
Selective Laser Melting is a powder bed fusion process for metal materials.
The basic principle of this method is to spread a layer of powder on a build platform, which is then selectively fused by use of a laser beam in the area where the part is to be generated. After that, the platform is lowered, a new layer is spread and fused again. This procedure is repeated until the final height of the product is reached and thus the product is generated layer by layer, surrounded by the residual powder. The laser beam completely melts the powder, so that the fusion is based on a liquid phase sintering. In this way, almost completely dense products can be generated.
The complete AM process does not only include the build process itself, but also pre- and post-processing. The first step is Computer Aided Design (CAD) that delivers a three-dimensional model of the product. This is converted into an STL file, which is still the common exchange format for AM. This data has to be transferred to the machine, where the machine setup is done including the parameter definition. Then the build process itself is carried out. After removing the parts from the machine and cleaning, the post-processing is done. This includes e.g. removing of support structures, heat treatment and machining of surfaces or fits. After post-processing, the products are ready for application. [6] The process chain is shown in Fig. 1.
Figure 1: AM process chain.
Depending on the specifics of the setup that is used for the process, the sequence can vary slightly, e.g. the parameter definition might be done with a separate software before the data is transferred to the machine.
2.2 Process parameters
The SLM process is subject to a large number of influencing factors. Besides the process parameters of the in-process, also many factors of the pre- and post-process stages have a strong impact on the process result. For example, in the pre-process the orientation of the part in the build chamber is defined.
This influences the surface quality and, due to a typically anisotropic behavior, the mechanical properties.
For the in-process, a large number of parameters need to be defined. They include the definition of the exposure strategy, e.g. hatch definition, laser energy, and scan speed, but also the environmental control of the build chamber, including gas flow, atmosphere, and temperature. Possible influencing factors in the post-process stages are temperature and time for heat treatments, parameters for milling or grinding, etc. An extensive overview of a number of influencing parameters in each stage is given in Tab. 1.
Table 1: Influencing parameters in AM process stages.
Process stage Influencing factors
CAD AM suitable design, build orientation support structures
STL convert Level of detail, number of triangles File transfer Software, file format
Machine setup Laser parameters: type of laser source, laser energy, scan speed, spot diameter, focus position Scan strategy: hatch pattern and rotation, beam compensation, sequence of hatch/contour scan Build Condition of laser source, optical system
Atmosphere: oxygen content, pressure, gas flow speed and direction
Ambient factors: temperature, humidity
Material: grain size distribution, grain shape, chemical composition
Powder bed: layer thickness, build platform temperature, coating system
Remove Powder removal, cleaning process Post-process Manual operations
Machining: cutting speed, feed rate, tool contour Heat treatment: temperature, heat-up/cooling rate, dwell time
The extensive number of influencing parameters hinders the development of suitable methods for process control and quality assurance, especially as the
quantitative correlation between the parameters and the process results are mostly unknown.
2.3 State of technology
The application of the SLM technology offers new opportunities in design and manufacturing, as it provides an increased freedom of geometrical design and an economical production of single parts. Case studies show the general applicability of SLM to produce topology-optimized structures [7]. The widespread application of SLM in the dental industry is an example of the use of an AM technology for mass production of highly individual parts, considering the specific requirements [8].
Nevertheless, the technology also shows some limitations, especially regarding maximum part size and accuracy. Current SLM machines have build platform sizes of 100 x 100 to 400 x 400 mm² with about equal build height. The largest currently available machine has a build chamber volume of 800 x 400 x 500 mm³ [9] [10] [11] [12]. The achievable precision is different for x-y- and z-direction, commonly a geometrical accuracy between 0.05 and 0.2 mm is considered as state of technology. The precision depends on the diameter of the laser beam and the layer thickness. Due to the welding process and the structure of the powder material, the surface is rough compared to common subtractive machining, with average roughness values of 20 µm [13].
Quality control measures are largely limited to quality inspection, due to a lack of empirical data regarding the quantitative correlation between the process parameters and results. The assessment is either carried out as a final part inspection after the build process is completed or integrated into the build process, e.g. in form of a layer or melt pool monitoring [9] [10] [11] [12].
The available monitoring systems aim at detecting possible mistakes during the build process already.
As an additional quality management measure, the SLM machines record a large number of process parameters during the build process. Approaches for the analysis of these data exist mostly within research but require detailed knowledge of the interrelations between the parameters and the resulting part quality. These shortcomings are reflected by the fact that the improvement of the reproducibility and the development of suitable quality management methods are among the crucial success factors that are identified for the further advancement of AM [14].
3 DESIGN OF EXPERIMENTS
The analysis of complex processes like AM requires the identification of target quality attributes that characterize the output of the process and of factors possibly related to those attributes. Once a list of potential factors is identified from pre-testing and literature review, the strengths of the interdependency between those factors and the target attributes need to be quantified.
A plain one-factor-at-a-time analysis would require an extremely large number of tests. Furthermore, this is not suitable to identify existing interactions between input parameters, which may influence the correlation between the single input parameters and the target value. Using the statistical methods for Design of Experiments [15] is more efficient in this case. Due to a large number of process parameters in AM, a screening of the influencing factors is advisable as a first step. Screening experiments tend to be small and are aimed at identifying the factors that affect the target value most. As identification is the goal rather than sophisticated modeling, continuous factors in a screening design are typically set at only two levels. Thus, two- factor interactions are not discernible with this design. Therefore, definitive screening design [16] can be applied. This design is able to identify causes of nonlinear effects by investigating each continuous factor at three different levels. Definitive screening design will also require a small number of experiments, e.g. for six or more factors only about twice as many tests as factors are needed. The main advantages of definitive screening design are:
• Main effects are orthogonal to two-factor interactions.
• No two-factor interaction is completely confounded with any other two- factor interaction.
• All quadratic effects are determinable in models containing only main and quadratic effects.
4 RESEARCH SUMMARY
A lot of research work is carried out on the topic of the SLM process by different research institutes and companies. Only literature dealing with the evaluation of the influence of process parameters on the process results is included in this review. As no standards for the experimental setup exist, the results of the studies are difficult to compare. While in general, more than 50 influencing parameters in the SLM process can be identified [17], most research work focuses on the influence of the laser exposure parameters [18]
[19] [20]. The exposure parameters can be put together to calculate the energy input or energy density of the SLM process, which is considered as the dominant influencing factor on the porosity and other quality characteristics by several researchers [18] [20]. Nevertheless, other publications show, that the energy density is not the only influencing parameter, as the same value for the energy density, achieved by different combinations of scan speed and laser energy, result in different porosities of samples [21].
Furthermore, it must be stated that there is no common understanding of energy density as a physical variable. While some work considers the two- dimensional energy density, that calculates the energy input per surface area, others use a three-dimensional approach that also includes the layer thickness to calculate the energy input per material volume.
A comparison of different research carried out on the process parameters for SLM does not deliver an explicit result for identifying the most important influencing factors and it becomes obvious that experiments have to be carried out for each material individually.
5 PROBLEM DEFINITION
Existing research work identifies a number of different influencing process parameters. The results are ambiguous and strongly depend on the material as well as on the specific machine used for the evaluation. Thus, it is not possible to deduce quantitative correlations or mathematical relationships from the existing work to apply this for identifying the most important influencing factors. To achieve this, tests have to be carried out with predefined machines and materials. The aim of this research work is to identify the most important influencing factors within the SLM process by applying statistical methods for experimental design.
6 METHODOLOGY
The porosity of the produced parts is chosen as the value to be measured for evaluating the part quality, as this is influenced by the process parameters and has a strong impact on the mechanical properties of the final part. All tests are carried out on a Realizer SLM 125 machine. The material used for these experiments is tool steel 1.2709 (material number according to DIN EN 10027-2:2015 [22]).
Pre-tests are carried out for a first evaluation of the repeatability: Eight cubes 8 x 8 x 8 mm³ are built. The build job is repeated three times with identical process parameters.
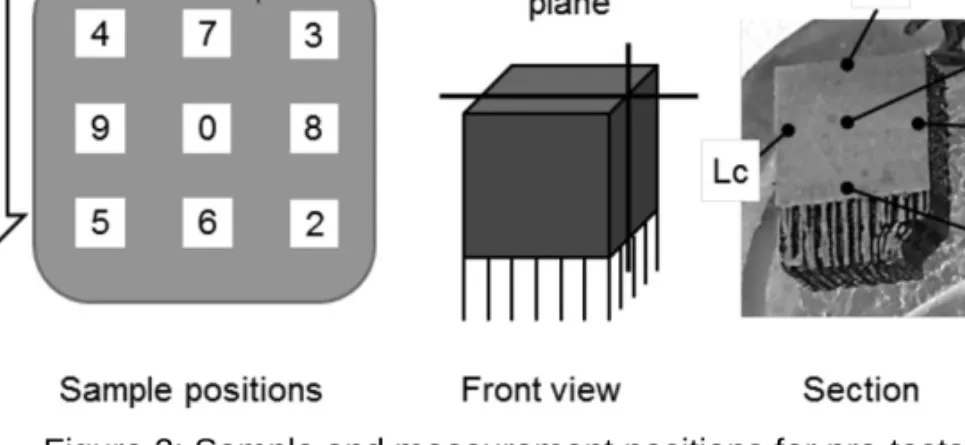
The porosity of the sample parts is evaluated by metallographic analysis. For this, a vertical cross section of the samples is grinded, polished and etched with a solution for macroscopic etching to remove material residue from the open pores. Microscopic images are taken in five different areas of the cross section. The location of the samples on the build platform and the position of the cross section and the microscopic images are displayed in Fig. 2.
Figure 2: Sample and measurement positions for pre-tests.
The microscopic images are taken with an incident light microscope with an optical enlargement of 100x and analyzed by an image processing system, that calculates area segments based on a threshold value for gray scales. As the pores are visible as black spots on the microscopic images, it is possible to evaluate the porosity within the cross section.
In a next step, an experimental design is carried out to evaluate the influence of different process parameters on the porosity of the parts. The definitive screening design is chosen to identify the strongest influencing factors. Based on the results of the literature research, the parameters for the laser power and movement and the hatch strategy are varied in the experiments, as they are expected to have the strongest influence on the porosity. The experimental setup for the first block is given in Tab. 2.
Table 2: Experimental setup for the definitive screening.
Block SampleExposure time [µs]
Point distance [µm]
Laser current [mA]
Lens position [mm/100]
Hatch distance [mm]
Position Hatch rotation
1 1_0 25 50 3300 300 0,08 Middle 45°
1 1_2 40 30 2700 220 0,08 Front 10°
1 1_3 40 50 3300 300 0,12 Back 90°
1 1_4 25 30 3300 260 0,08 Back 10°
1 1_5 55 50 3300 300 0,08 Front 10°
1 1_6 55 50 2700 260 0,12 Front 90°
1 1_7 25 30 2700 220 0,12 Back 90°
1 1_8 55 30 2700 220 0,12 Middle 45°
1 1_9 40 40 3000 260 0,1 Middle 45°
The exposure parameters in the table refer to the hatch exposure, the parameters for the boundary are kept constant during the whole experiment.
The experiments were grouped into three blocks, each block representing one build job. The sample geometry and positions are equal to those of the pre-tests. During the tests, it became obvious that the chosen parameter variations lead to a very unstable production process, which ended in a process break during the second block. Due to this, the third block was not built in this experiment. Nevertheless, the parts built within the first two blocks are analyzed in the same procedure as described for the pre-test. To exclude the influence of the boundary exposure only the center position (Cc) is analyzed for these samples.
7 RESULTS
The evaluation of the samples from the pre-test show large variations in the porosity between the single parts as well as within the parts. Tab. 3 and Fig.
3 show the results for the porosity calculated as mean and standard deviation from the five measurement areas, shown in Fig. 2.
The high mean value and standard deviation for the porosity of the sample 0 of test series 1 results from a large void that is formed in the center top of the sample and leads to a porosity of 17.02% in that measurement area. The formation of single large pores can weaken the material and result in a decrease of mechanical properties. Thus, it is important to consider these results in a further analysis.
Table 3: Results for porosity of the pre-test.
Sample: 0 2 3 4 5 6 7 8 9
Mean: 4,22 0,42 0,21 0,42 0,45 0,44 0,44 0,65 0,56 SD: 6,42 0,33 0,09 0,11 0,23 0,18 0,23 0,51 0,33
Sample: 0 2 3 4 5 6 7 8 9
Mean: 0,46 1,55 0,31 0,27 0,25 0,52 0,24 0,34 0,34 SD: 0,29 1,42 0,19 0,16 0,13 0,54 0,12 0,17 0,13
Sample: 0 2 3 4 5 6 7 8 9
Mean: 0,36 0,09 0,31 0,65 0,03 0,04 0,25 0,17 0,09 SD: 0,20 0,05 0,10 0,49 0,02 0,02 0,16 0,13 0,05 Test series 1Test series 2Test series 3
Porosity [%]
Porosity [%]
Porosity [%]
Figure 3: Mean values for porosity of the pre-test.
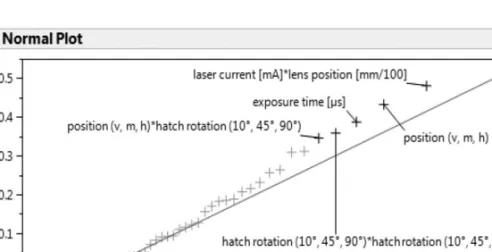
It is not possible to do the complete definitive screening, due to the missing third block of the screening experiments. For an evaluation of the present data, the two blocks of the screening experiment are combined with the results from the pre-tests. A screening analysis is applied to these data. The results are shown in the half normal plot, Fig. 4.
Figure 4: Half normal plot of the screening.
The distance of the data points of the straight is an indicator for the degree of influence of the parameter. The plot shows, that in this case the parameters with the strongest influence are: laser current*lens position, position, exposure time, hatch rotation*hatch rotation and position*hatch rotation.
These parameters have a stronger influence on the porosity than the others, that are included in the screening. Nevertheless, for none of them, the result is clearly differentiating from the others.
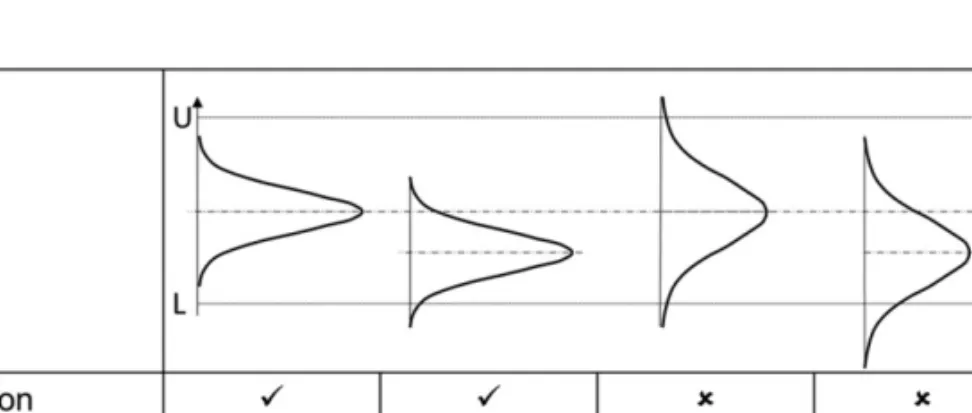
Besides the quantitative results from the porosity analysis, the metallography delivers further information on the shape of the pores. The voids are either of an elliptical form or of irregular shape (Fig. 5).
Figure 5: Microscopic images of voids in SLM samples, 200x.
a) Sample with elliptical pores, b) Sample with irregular voids.
The shape of the voids gives an indication of the formation mechanism. A more spherical or elliptical shape indicates the formation of the pore due to a gas bubble, that was enclosed in the melt pool during the solidification. These gas bubbles either can exist inside the powder particles of the raw material or be formed by evaporation of material during the melting process, as a result of a too high energy input. The irregularly shaped cavities can either be formed by material contraction during the cooling or be caused by an incomplete melting process, resulting from a too low energy input. The concrete form of the present cavities indicates, that the latter is more plausible in this case.
8 DISCUSSIONS
Together with the fact that certain combinations of parameters in the definitive screening design lead to a process break during the build, the results from the pre-test indicate that a closer evaluation of the other influencing factors is
required. The causes for the high variations within the pre-tests need to be identified and eliminated, if possible, as they will overlay the influence of the parameter variation. Careful analysis and optimization is required to reach a process state that enables the further evaluation of the influences of the different parameters.
As the screening analysis does not lead to an explicit result for the strongest influencing factors, further experiments are required. These should include a larger number of tests as well as consider more different process parameters.
One possible approach can be the utilization of the process log files of the SLM machine as here all surrounding parameters are filed. Furthermore, the evaluation of the areal percentage of porosity is not sufficient. As the different formation mechanisms of the pores indicate a too high or too low level of energy input, this should be taken into account as well.
Further experiments with an optimized setup are required, as the current results are not sufficient for a conclusive evaluation.
REFERENCES
[1] Verein Deutscher Ingenieure (2014) VDI 3405 Additive manufacturing processes, rapid manufacturing – Basics, definitions, processes, Beuth Verlag, Berlin.
[2] Gebhardt, A. (2005) Rapid Prototyping für metallische Werkstücke:
Direkte und indirekte Verfahren. RTejournal - Forum für Rapid Technologie, Vol. 2, online available: http://www.rtejournal.de/ausgabe- 2-2005/233, 21.07.2014.
[3] GE additive (2017) online available:
http://www.geadditive.com/#experience, 31.05.2017.
[4] Methner, M. (2007) Rapid Manufacturing: Dentaltechnik arbeitet effizienter mit Schichtbauverfahren - Schluss mit Guss, in: Medizin und Technik, Konradin-Verlag, Leinfelden-Echterdingen, online available:
http://www.medizin-und-technik.de/home/-/article/33568401/
35327192?returnToFullPageURL=back, 15.02.2016.
[5] Gebhardt, A. (2007) Generative Fertigungsverfahren, Hanser, München.
[6] Gibson, I., Rosen, D. W., Stucker, B. (2010) Additive Manufacturing Technologies: Rapid Prototyping to Direct Digital Manufacturing, Springer Science and Business Media, New York.
[7] Scheideler, E. M., Villmer, F.-J., Adam, G., Timmer, M. (2016) Topology Optimization and Additive Manufacturing – A Perfect Sybiosis? in:
Villmer, F.-J., Padoano, E.: Proceedings 6th International Conference Production Engineering and Management, Lemgo, pp. 39-50.
[8] Huxol, A., Villmer, F.-J. (2016) Special Requirements for Additive Manufacturing of Dental Frameworks in: Villmer, F.-J., Padoano, E.:
Proceedings 6th International Conference Production Engineering and Management, Lemgo, pp. 15-26.
[9] SLM Solutions (2017) online available https://slm- solutions.de/maschinen, 21.06.2017.
[10] Concept laser (2017) online available https://www.concept- laser.de/produkte/maschinen.html, 21.06.2017.
[11] EOS (2017) online available https://www.eos.info/systeme_loesungen/
metall/systeme_und_zubehoer, 21.06.2017.
[12] Realizer (2017) online available http://www.realizer.com, 21.06.2017, 14:40.
[13] Berger, U., Hartmann, A., Schmid, D. (2013) Additive Fertigungsverfahren, Europa Lehrmittel Verlag, Haan-Gruiten.
[14] Acatech – Deutsche Akademie der Technikwissenschaften, Nationale Akademie der Wissenschaften Leopoldina, Union der deutschen Akademien der Wissenschaften (Eds.) (2016) Additive Fertigung, München.
[15] Rushing, H., Karl, A., Wisnowski, J. (2013) Design and Analysis of Experiments by Douglas Montgomery: A Supplement for Using JMP, SAS.
[16] Jones, B., Nachtsheim, C. J. (2011) A class of three-level designs for definitive screening in the presence of second-order effects. Journal of Quality Technology, 43(1), 1.
[17] Spears, T. G., Gold, S. A. (2016) In-process sensing in selective laser melting (SLM) additive manufacturing, in Integrating Materials and Manufacturing Innovation, 5:2, online available https://link.springer.com/article/10.1186%2Fs40192-016-0045-4,
22.06.2017.
[18] Cherry, J. A. et al. (2015) Investigation into the effect of process parameters on microstructural and physical properties of 316L stainless steel parts by selective laser melting, in The International Journal of Advanced Manufacturing Technology, Volume 76, Issue 5-8, pp. 869- 879.
[19] Yadroitsev, I., Yadroitsava, I., Bertrand, P., Smurov, I. (2012) Factor analysis of selective laser melting process parameters and geometrical characteristics of sythesized single tracks, Rapid Prototyping Journal, Vol. 18, Issue 3, pp. 201-208.
[20] O´Regan, P. et al. (2016) Metal based additive layer manufacturing:
variations, correlations and process control, in Procedia Computer Science, 96, pp. 216-224.
[21] Prashanth, K. G. et al. (2017) Is the energy density a reliable parameter for material sythesis by selective laser melting?, Materials Research Letters, online available http://dx.doi.org/10.1080/
21663831.2017.1299808, 22.06.2017.
[22] DIN EN 10027-2 (2015) Bezeichnungssysteme für Stähle – Teil 2:
Nummernsystem; Deutsche Fassung EN 10027-2:2015, Beuth, Berlin.
PARTICIPATIVE DEVELOPMENT OF AN IMPLEMENTATION PROCESS FOR WORKER ASSISTANCE SYSTEMS
T. Kleineberg, M. Eichelberg, S. Hinrichsen Industrial Engineering Lab,
OWL University of Applied Sciences, Lemgo, Germany
Abstract
Challenges of companies are presented by an increasing number of product variants or a growing product complexity in combination with a reduction of lot size. Therefore the scope of the work in the field of manual assembly will be more complex. This situation leads to a need of assistance systems. With these systems, the assembly workers will be qualified to execute their work tasks within the requirements. This approach set up on a further implementation of an assistance system at a great device manufacturer. The main focus of this implementation was the technical and functional design of the assistance system, but a successful implementation requires also an active handling of the change process. The purpose of this paper is the presentation of design principles in form of a process model for the implementation of digital assistance systems. The development of the design principles takes place in a participative approach. Executives, work councils and workers develop the project results together with external project members. Project managers will be able to manage implementation processes with the results and take all the success factors into account.
Keywords:
Assistance systems, Change management, Success factors, Process model
1 INTRODUCTION
Manufacturing companies with assembly areas are presented with challenges, such as an increasing number of product variants, increasing product complexity, and shrinking lot sizes. These challenges change the demands on assembly systems and those working on them. The scope of the work is becoming more complex, more varied and undergoes more frequent changes due to shorter product life cycles. The short change cycles of various manufacturing orders in assembly can lead to early interruption of the learning curve of those involved [1] and to lower work productivity and a high error rate.
This situation leads to a need for assistance systems, which support employees in carrying out their work duties in a cooperative manner [2] [3] [4].
At a large device manufacturer, an assembly assistance system consisting of three different applications was developed and introduced on a trial basis [5].
The developed applications support different professional groups with
information based on needs. So, for example, employees are provided with information on the work steps, visualized through images, videos or texts [5]
[6]. During this implementation process, the focus was on the technical and functional design of the applications. However, the successful introduction of such applications also requires, in addition to the functioning technology, an organization and workforce prepared for the technological change, as the workforce is required to undergo a not inconsiderable change process [4].
Only when the affected workforce views the assistance system as an asset and actively uses it, the introduction can be regarded as successful. Therefore there is a requirement for the development of user-centered design and implementation processes [7]. If this defined implementation process is lacking, this represents a major hurdle for the introduction of assistance systems [8].
2 OBJECTIVES AND APPROACH
The objective of the project described below is the development of a target process for the implementation of digital assistance systems. In addition to design tasks, this should also include success factors for change management and best practice examples. The results can be used by project managers in the future as a tool for the effective and efficient planning and implementation of the introduction process. In this project, the employees, work councils, and management of the device manufacturer with their different perspectives are explicitly included. The empirical basis for this project is formed essentially by the implementation of an assistance system by a device manufacturer mentioned above.
The selected procedure is set out in Figure 1 and consists of three phases:
(1) Identification of success factors, (2) selection of the procedure model (3) combination of success factors and process model into a target implementation process. The results of these phases are described in sections 3.1 to 3.3.
The first phase is broken down into three parts. The first part consists of literature research on success factors for introduction and change processes in general and a subsequent inductive category formation in accordance with Mayring [9]. For this, prominent specialist texts and studies on change management [10] [11] [12] [13] [14] [15] [16] [17] are searched through for success factors for change processes. Using inductive category formation, the success factor categories are derived from the sources mentioned. To this end, the core statements from the respective sources on the success factors are filtered out and noted. If an aspect arises that is not dealt with in the previous sources, the category is expanded or a new one formed. At the end of the review, the categories are again reviewed for overlaps and adjusted so that they are better delineated.
Figure 1: Phases of the approach.
In the second part, critical incidents for the completed introduction process at the device manufacturer are identified, using the Critical Incident Technique of Flanagan [18]. Following Koch [19], the procedure for data collection consists of three steps: (1) recording critical incidents, (2) evaluating the relevance of the critical incidents and (3) dividing the critical incidents into categories. This method is based on experience, yields practical results and can be adapted relatively flexible to the question being posed [20]. Therefore the application of this method in this case is useful. The critical incidents recorded are based on activities from the introduction process that was undergone, e.g. in workshops or during the test phase. In the third part, these will be assigned to the success factor categories from part 1 in a workshop.
The procedure here will be in accordance with deductive category assignment [9]. The results of this phase are success factor categories specially adapted to the implementation of assistance systems (cf. section 3.1).
In phase 2 there is a comparison and the selection of a procedure model for the implementation process. In doing so, various different procedure models are considered [10] [11] [12] [16] [21] [22] [23] [24] [25] [26] [27] [28]. The selected procedure model is adapted to the requirements of the assistance
Selection of a procedure model
Literature research and evaluation
Selected procedure model
Combination of procedure model and success factors
Allocation in expert workshop
Target model for the implementation
process Result Method
Content Section
Identification of success factors
Literature research and inductive category formation
Success factors of change management
Evaluated, critical incidents Workshop and
critical incidents technique Identification of
critical incidents
Deductive category formation
Summarized and specified success
factors Combination of
critical incidents and success factors
3.1
3.2
3.3
Phase 1
Phase 3 Phase 2
system design and represents the result of the second phase (cf. section 3.2).
The third phase consists of the combination of the success factor categories and the procedure model. For this, an expert workshop is held. Here the success factor categories are each assigned to the individual stages of the procedure model. Subsequently, specific success factors are developed for each success factor category of a stage. The procedure developed in this manner is the result of the third phase (cf. section 3.3).
3 RESULTS
3.1 Success factors
By means of an evaluation of the literature on the subject of change processes, a total of ten success factor categories were identified. These were refined on the basis of 23 recorded critical incidents and the expert opinions in the workshop. The final ten success factor categories are shown in an overview in Figure 2. By evaluating the critical incidents, it was possible to identify the relevance of individual success factor categories. Thus in the category of communication, 14 critical incidents were considered. This means that the greatest number of incidents fed into this category. The conclusion can be drawn that this category has particular significance for the success of the project. In nine of the 14 cases, however, communication is not the only category to which these critical incidents were assigned. This demonstrates that communication is closely connected to other success factors - such participation, for example. This result is confirmed by Lauer [11]. He describes communication as the central success factor and as a catalyst for change.
Figure 2: Overview of change management success factors categories of an assistance system implementation.
3.2 Process model
In order to attain the goal of this project of designing a target process for the implementation of digital assistance systems, existing procedure models for organizational or technical change processes were analyzed. The criteria for the selection of the procedure model largely consisted of the project stage completeness, the level of detail and the suitability for software, hardware and work organizational changes. After several side-by-side comparisons, the REFA Standard Programs Work System Design [28] and Assembly System
Leadership & key personnel Vision Leadership driving the change process.
Important: Pay special attention to trustworthy key personnel.
Deriving the vision from the company vision. Formulation of a clear and realistic vision from which the strategy and goal can be derived.
Communication Team-building
Use open and clear communication internally and externally.
Important: vision, successes and regular communication (including feedback)
Integrate all participants in the project.
Important: Pay attention to and use the strengths, networking and motivation of participants.
Analysis Participation
Systematic analysis of the starting situation and goal attainment.
Turn those affected into participants.
Important: Involve all stakeholders in accordance with needs.
Qualification Sustainability
Train all participants using appropriate methods and in accordance with requirements.
Embed the change and change process sustainably in the company.
Important: Establish a willingness to change in the culture.
Project organization Process-oriented management Create a structure for the systematic
completion of projects.
Important:Prioritize tasks, pay attention to timing.
For each stage of the project, use appropriate methods, techniques and tools.
Important: Plan conflict management, controlling, external consultants and rapid results.
Design [29] emerged as particularly suitable. The REFA procedure models were adapted in terms of content to the requirements for the implementation of an assistance system. Figure 3 shows the procedure model in a summary overview. So for example the iterative nature of the procedure is emphasized in some stages, as these are needed in the development of software in particular. The procedure model consists of a total of six stages.
Figure 3: Procedure model for the design and change process (REFA 2016, modified).
1. Analysis & project scope
• Conduct a current state analysis
• Create a project charter
• Carry out a technology screening
2. Finalize targets
• Record usage requirements
• Analyze existing assistance systems with comparable requirements
• Finalize targets
3. Rough planning
• Record detailed work flow and information
flows/requirements
• Develop hardware concepts
• Iteratively develop software architecture or select software platform 4. Detailed planning
• Iterative design of hardware and software
• Review efficiency and utility
• Specify work organization
5. Realization
• System procurement, configuration
• Train personnel
• Test and improve the system iteratively
6. Implementation
• Gradually switch over
• Set up continuous improvement process
• Implement success monitoring
• Document results
In the first stage of the model, the starting situation is analyzed and project framework conditions are derived. Problem statement, goal setting, system delimitation, milestones and the project team are defined here. In the second stage, additional data is gathered, in order to specify in further detail the basis of these goals. Based on this, requirements are defined. These are refined in collaboration with possible software and hardware providers and if necessary verified in a mock-up. Then in the third stage, the hardware concept is developed and a software platform selected, and/or the software architecture is iteratively developed. In the fourth stage, the final hardware is selected and the software is developed or procured on a prototype basis. The process of development generally proceeds in short-cycle loops, so that quality can be assured through continuous feedback. The work organization is finalized in this stage. In the fifth stage, the system is implemented in a test environment.
Through multiple testing (iterative), problems are identified and subsequently eliminated, so that production readiness is achieved. In the sixth stage, there is a gradual introduction in the selected area. Any errors are continuously eliminated in real-time operation. The sustainability of the system is ensured by selecting a person with responsibility for this task.
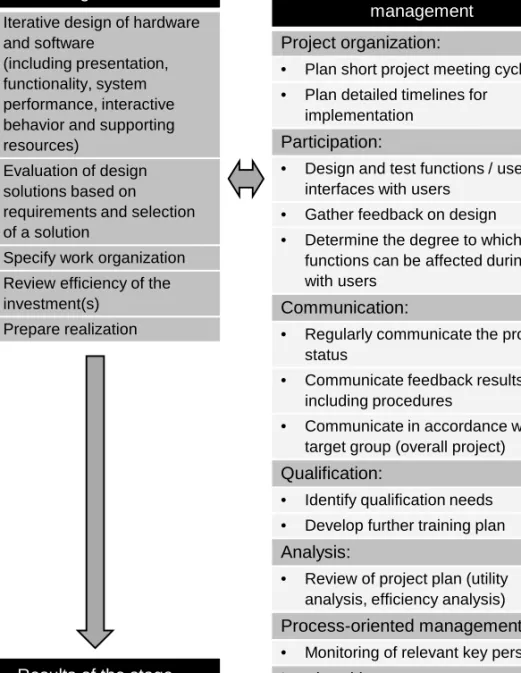
3.3 Target process
The target process was developed on the basis of the success factor categories identified, the critical incidents and the selected procedure model.
A list of success factors was assigned to each stage of the procedure model.
In Figure 4, the success factors of the first stage, "Analysis & project scope", are shown according to success factor category. Consideration of the factors supports the successful implementation of the change process. In Figure 5, the design tasks from the procedure model and the assigned success factors for stage 4 "Detailed planning" are shown exemplarily. There are interactions between these. So, for example, there is a connection between the iterative design of hardware and software and the success factor "Design and test functions and user interfaces with users". In this success factor, the change process with the participation of users is to the fore. The design tasks primarily relate to technical or functional aspects and directly to the hardware and software.
![Figure 1: Correlation between process parameters, process signatures and product qualities [5]](https://thumb-eu.123doks.com/thumbv2/1library_info/5234891.1670996/16.892.197.695.235.530/figure-correlation-between-process-parameters-process-signatures-qualities.webp)