Research Collection
Journal Article
Micro-computed tomography study on bread dehydration and structural changes during ambient storage
Author(s):
Chen, Yi; Parrilli, Annapaola; Jaedig, Florian; Fuhrmann, Adrian; Staedeli, Christian; Fischer, Peter;
Windhab, Erich J.
Publication Date:
2021-05
Permanent Link:
https://doi.org/10.3929/ethz-b-000460921
Originally published in:
Journal of Food Engineering 296, http://doi.org/10.1016/j.jfoodeng.2020.110462
Rights / License:
Creative Commons Attribution-NonCommercial-NoDerivatives 4.0 International
This page was generated automatically upon download from the ETH Zurich Research Collection. For more
information please consult the Terms of use.
Journal of Food Engineering 296 (2021) 110462
Available online 28 December 2020
0260-8774/© 2020 The Author(s). Published by Elsevier Ltd. This is an open access article under the CC BY-NC-ND license
(http://creativecommons.org/licenses/by-nc-nd/4.0/).
Micro-computed tomography study on bread dehydration and structural changes during ambient storage
Yi Chen
a,*, Annapaola Parrilli
b, Florian Jaedig
a, Adrian Fuhrmann
a, Christian Staedeli
c, Peter Fischer
a, Erich J. Windhab
aaInstitute of Food, Nutrition and Health, ETH Zurich, Schmelzbergstrasse 9, 8092, Zurich, Switzerland
bEmpa, Swiss Federal Laboratories for Materials Science and Technology, Überlandstrasse 129, 8600, Dübendorf, Switzerland
cJowa AG, Erlenwiesenstrasse 9, 8604, Volketswil, Switzerland
A R T I C L E I N F O Keywords:
X-ray micro-computed tomography Bread
Image analysis
A B S T R A C T
This study investigated the structural changes in bread during ambient storage. The structural changes in bread were studied using X-ray micro-computed tomography. Fresh bread had a porosity of 53.7 ±1.6% and a high pore connection value, suggesting that most pores in the bread are extensively interconnected. Moreover, fresh bread had cell walls with an average thickness of about 0.2 mm and a wide pore size distribution. During storage, the bread underwent substantial water-loss, leading to volume shrinkage and microstructural alterations. Sig- nificant increases in total porosity and in the number of small pores as well as a significant decrease in average cell wall thickness were observed over 14 storage days. Grayscale intensity obtained from the X-ray images provided additional insights into the changes in the network density, which is expected to be correlated with water distribution and starch recrystallization during staling.
1. Introduction
Bread is generally considered to be an open-cell solid foam comprising a solid phase containing the cell walls and a fluid phase containing air (Cauvain, 2012; Rathnayake et al., 2018). Due to the various processing steps occurring during bread preparation and the interactions between different ingredients, pores within the bread demonstrate anisotropic shapes and sizes as well as heterogeneous ori- entations and connectivity (Mathieu et al., 2016). The resulting struc- ture can be characterized in terms of porosity, mean pore size, pore size distribution, pore connectivity, and cell wall thickness, which play important roles in determining the physical and sensory properties, and water transfer during ambient storage. Primo-Martín et al. (2010) re- ported that a thicker crust with a more closed structure and smaller gas cells has a significant positive impact on the crispness retention of the crust. In addition, Karathanos et al. (1996) stated in their paper that the effective vapor diffusivity in porous materials and starch materials increased under conditions of increasing porosity and average pore size.
Characterization of the breadcrumb structure is difficult because crumb cells are not uniform and exhibit a wide range of sizes (P´erez-Nieto et al., 2010). Nevertheless, a number of methods have been
proposed and employed to analyze the internal structure of bread, including light microscopy, electron microscopy, X-ray tomography, and magnetic resonance imaging (Rathnayake et al., 2018). Among them, X-ray micro-computed tomography (micro-CT) has great potential owing to its ability to noninvasively investigate the microstructure in three dimensions.
Micro-CT is based on X-ray radiography and tomography, a series of radiographs are acquired while the sample rotates perpendicularly to the X-ray beam. The contrast observed in the X-ray radiographs can be explained by the attenuation of the X-ray beam. Typically, the attenu- ation coefficient is proportional to the density of the investigated ma- terial (Chevallier et al., 2014; Maire et al., 2001). This technique can provide a spatial representation of the cellular structure of food products in a nondestructive manner, thanks to the strong contrast between the voids and the cell wall solids within the products (Lassoued et al., 2007).
Numerous studies have proved that micro-CT is particularly suitable for the 3D evaluation of the cellular structure of baked products (Gao et al., 2018). Falcone et al. (2004) reported that the porous structure of the bread could be investigated using micro-CT without any sample preparation. Primo-Martín et al. (2010) employed micro-CT to study the morphological characteristics of the crumb and crust in crispy rolls.
Besbes et al. (2013) compared the porosity profiles of fresh pan breads
* Corresponding author.
E-mail address: yi.chen@hest.ethz.ch (Y. Chen).
Contents lists available at ScienceDirect
Journal of Food Engineering
journal homepage: http://www.elsevier.com/locate/jfoodeng
https://doi.org/10.1016/j.jfoodeng.2020.110462
Received 12 September 2020; Received in revised form 19 December 2020; Accepted 22 December 2020
obtained using helium pycnometry and micro-CT. Furthermore, Van Dyck et al. (2014) used micro-CT in combination with a volume stitching strategy to create a high-resolution 3D scan of the whole cross section of different breads. More recently, Mathieu et al. (2016) revealed that micro-CT was able to demonstrate the evolution of the bread micro-architecture before, during, and after full hydration.
During ambient storage, water travels through the connected pores and solid matrix from the breadcrumb to the crust and eventually to the surrounding environment by diffusion, a phenomenon that is mainly driven by the differences in water activity (Primo-Martín et al., 2010) because there is no micro-convection in the bread pore system that could support the water transfer. On one hand, dehydration is a complex process, highly dependent on the structural parameters of food systems, such as porosity, pore size, and cell wall thickness (Srikiatden and Roberts, 2007). On the other hand, dehydration transforms the closed pores into open ones (Datta et al., 2007). Such morphological changes would in turn have significant impacts on water transport in porous products (e.g., bread).
None of the studies have investigated the microstructural changes in bread during storage. The main objective of this work was to study the structural evolution in the bread during ambient storage using micro- CT. The weight loss, volume shrinkage, and changes in the moisture content in different regions of the bread during storage were examined.
This work presented the relationship between cellular morphology and water transport in bread over time.
2. Material and methods 2.1. Bread sample preparation
The bread samples were baked in accordance with a recipe (Table 1) that included wheat flour, yeast, water, and salt. The optimal dough hydration was checked with a Farinograph®-E (Brabender GmbH & Co., KG, Germany).
Wheat flour (white flour, type 550) was procured from Stadtmühle Schenk AG. Baker’s yeast (Presshefe 100138), manufactured by Hefe Schweiz AG was used. Non-iodized table salt obtained from Schweizer Rheinsalinen AG and regular tap water were used.
A dough of 5 kg was prepared according to the composition in Table 1 using a kneading machine (IRIS-030, Tekrom, Italy) for 10 min.
Immediately after the mixing, 800 g of dough was separated and rolled out to a thickness of approximately 5 mm using a sheeter (Type 2446, Seewer Rondo, Switzerland). Afterwards, the flattened dough was placed in a rounding machine (Type 130312, Divider Rounder DR Robot2 Automatic White-Blue, Daub Bakery Machine B.V., Netherlands). The rounded bread loaves (45 ±5 g) were subsequently placed into a proofing chamber (Type GS20ED, Wiesheu GmbH,
Germany) for 30 min at 32 ◦C and approximately 80% relative humidity.
After proofing, the leavened loaves were placed in an industrial oven (X2000-A-BCBBCEA, Wiesheu GmbH, Germany) for baking (time, 10 min; temperature, 200 ◦C).
After baking, the breads were allowed to cool down before being stored in a climate chamber (KALTE 3000, Switzerland) over a period of ¨ 14 days. The storage conditions were kept constant (temperature, 23 ◦C;
relative humidity, 65%).
2.2. Measurement of water reduction by weighing
The bread samples were weighed on a scale (XP 204, Mettler Toledo GmbH, Switzerland) on days 1, 2, 4, 7, and 14. Weight loss (%) was calculated as Wday1Wday1−Wt *100 %, where Wday1 is the weight of the bread on day 1 and Wt is the weight of the bread on a certain measuring day (t).
Measurements were performed in triplicate.
2.3. Moisture content measurement
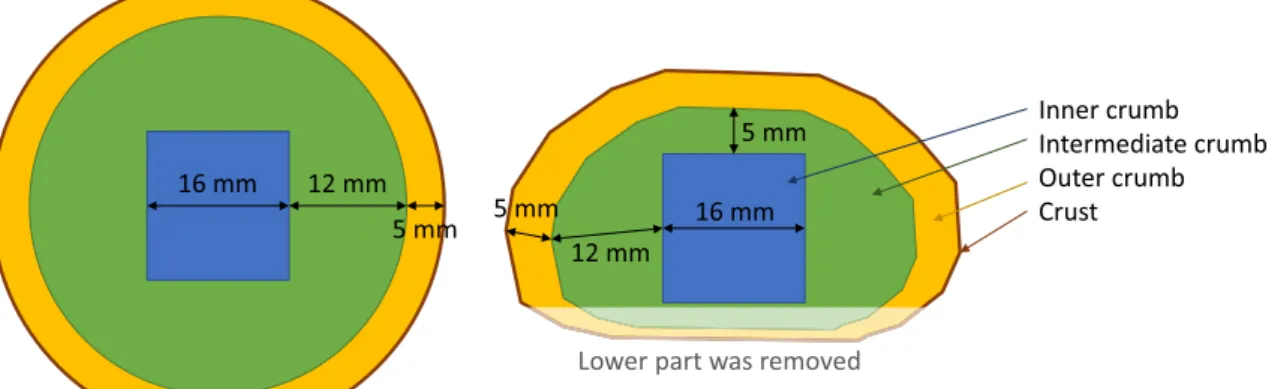
The bread samples were cut and separated into 4 different regions (inner crumb, intermediate crumb, outer crumb, and crust) according to the scheme illustrated in Fig. 1, in order to investigate the local changes in the moisture content. The separated samples were then weighed and placed in an oven (Paraffinschrank Un110pa, Memmert GmbH +Co.
KG, Germany) at 103 ◦C for 5 h. Afterwards, the samples were trans- ferred into a desiccator for cooling. After cooling, the samples were weighed again. The moisture content was calculated based on the dif- ference in weight before and after drying in the oven and was deter- mined in triplicate. The moisture content of each region was measured on days 1, 2, 4, 7, and 14.
2.4. Volume measurement of the bread
The measurements of the specific volume of the bread samples were conducted in triplicate using a VolScan Profiler (VSP 600, Stable Micro Systems, United Kingdom) on the day of baking (day 1) in accordance with the method proposed by the AACC in 2005 (No. 10–16.01). The VolScan Profiler digitally modeled the dimensions of the test sample using a low-frequency, high-precision laser. Based on the bread size in the study, a vertical step size of 3 mm and a rotational speed of 0.5 rps were applied. Volume loss (%) was calculated as Vday1Vday1−Vt*100 %, where Vday1 is the volume of the bread on day 1 and Vt is the volume of the bread on a certain measuring day (t).
2.5. Image acquisition and analysis 2.5.1. X-ray micro-computed tomography
The bread samples were measured using an EasyTom XL Ultra 230- 160 micro/nano-CT scanner (RX Solutions, Chavanod, France). As shown in Fig. 2, the sample was placed on a sample holder on a rotation stage and scanned at a nominal resolution of 40 μm. The scanner operated at 70 kV and 70 μA. The scans were performed with a rotation of 360◦at a rotation step of 0.25◦, which resulted in a set of 1440 pro- jections. The tests were performed on days 1, 2, 4, 7, and 14. On each measuring day, 3 samples were scanned.
2.5.2. Image analysis and visualization
Image reconstruction was performed using the X-Act CT software (RX Solutions, Chavanod, France). No artifact correction, except for the specific alignment assessment depending on the single scan, was used to obtain micro-CT sections with a pixel size of 40 μm. Quantitative 3D and 2D analyses were performed using the Avizo Software (ThermoFisher Scientific, Waltham, MA, USA). Volumes of interest (VOIs) were defined based on the partitioning of the bread shown in Fig. 1.
Abbreviations
micro-computed tomography (micro-CT) glass transition temperature (Tg) water activity (aw)
moisture content (MC)
Table 1
Formulation of bread based on 1 kg flour.
Ingredients Amount (g)
Wheat flour 1000
Yeast 25
Salt 22
Water 616
Journal of Food Engineering 296 (2021) 110462
3 The following 3D parameters were evaluated: porosity (%), pore connection (%), cell wall thickness (mm), and pixel intensity/grayscale intensity. The porosity (%) was expressed as the percentage ratio of voxels designated as pores to the total volume of interest (Van Dyck et al., 2014). The pore connection (%) was calculated through an indi- vidual 3D analysis using the following formula (Panzavolta et al., 2018):
Vmaxdetected pore ΣVtotdetected pores*100 %
Cell wall thickness (mm) was calculated in 2D on the basis of the parallel plate model (Parfitt et al., 1987): Cell wall thickness =
(Surface/Volume)2
Pixel intensity was obtained based on the grayscale intensity, ranging from 0 (black) to 255 (white). The values in the range of 0–2 represent the pore/void space inside the bread (Wang et al., 2011).
Moreover, a 2D distribution analysis of the equivalent pore diameter (mm), defined as the diameter of the equivalent circle having the same area as the measured single 2D pore, was performed on the cross section located in the middle between the bottom and top of the bread samples.
2.6. Statistical analysis
Statistical significance was assessed using one-way analysis of vari- ance (ANOVA) with OriginPro 2018 (OriginLab Inc., USA). Tukey’s HSD test was used to compare the treatment means at 5% significant level.
3. Results and discussion
3.1. Weight loss and volume loss of bread during storage
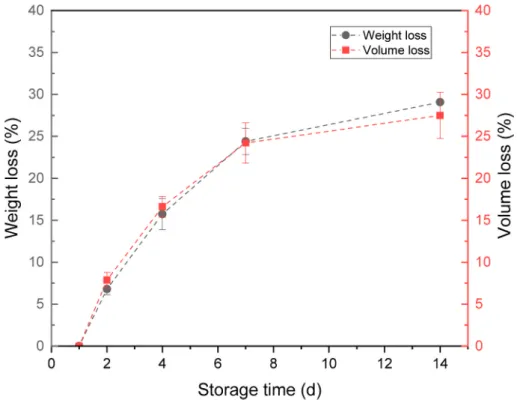
Cumulative weight loss (%) of the bread over time is shown in Fig. 3.
Weight loss is primarily caused by the loss of water from bread during storage. Fresh bread is in a non-equilibrium state. As a result, water in the bread tends to migrate from the crumb to the crust and eventually to the outer environment during storage; this process is mainly driven by the differences in water vapor pressure between the crumb, crust, and atmosphere (Hug-Iten et al., 2003). As shown in Fig. 3, the rate of weight loss from day 1 to day 4 was observed to be higher than the rate from day 4 onward. The rapid weight loss within the first 4 days could be attributed to the significant difference in the water vapor pressure Fig. 1.Partitioning of bread sample.
Fig. 2.Experimental setup for micro-CT measurement.
Y. Chen et al.
between the crumb and the atmosphere at the beginning stage of the ambient storage. In addition, in this stage, water molecules are more mobile and are thus free to evaporate. During storage, water becomes immobilized owing to its incorporation into crystalline starch structures, which are formed by the recrystallization of amylopectin upon staling (Goesaert et al., 2009). Therefore, the dehydration rate of the bread decreases over time. With the progression of storage, the dehydration rate is further reduced owing to the additional internal resistance for moisture transfer (Srikiatden and Roberts, 2007). When the vapor pressure of the crumb equals the partial vapor pressure of the ambient air in the climate chamber, the dehydration process reaches an equi- librium state, indicating that no further moisture loss occurs. In our case, as there were no data points after day 14, one cannot be certain whether the drying of the bread reached its fully developed equilibrium on day 14. During the 14 day storage, the bread lost in total 29.1 ±0.2% of its weight.
Fig. 3 also shows that the volume loss occurs simultaneously with weight loss. Similarly, the highest rate of volume loss was observed between day 1 and day 4, followed by a gradually reduced rate over time. The close correlation (almost overlapped data points) between weight loss (%) and volume loss (%) suggests that during storage, the volume of the bread decreases almost linearly with water reduction. A similar observation was reported by Aprajeeta et al. (2015) that the shrinkage of potato slices occurs linearly with respect to the decrease in the moisture content. During isothermal dehydration of food products, the moisture gradient within the products induces microstructural stress, which leads to material deformation. Volume shrinkage occurs as a consequence of food tissue failing to maintain its structural arrange- ment, especially as the intracellular spaces previously occupied by water are constantly emptied and replaced by air (Mahiuddin et al., 2018).
Therefore, it is generally believed that the volume reduction of food products occurs in response to drying, and that the shrinkage is normally linearly proportional to the volume of the removed water (Srikiatden and Roberts, 2007). After 14 days of storage, the volume loss of the bread was 27.5 ±2.8%, which corresponds well with the weight loss.
The reduced rate of increase in volume loss after day 7 is attributed to the fact that the gluten and starch networks in the bread become stiff and
reach a glassy state in response to dehydration, which restricts further shrinkage (see Figs. 4–6, glass transition temperature aspect).
3.2. Boundary conditions for structural changes in the bread
Moisture content in food has always been referred to in the context of (a) the water activity value (aw), which indicates the availability/
movability of “freely movable water” and (b) the glass transition tem- perature (Tg), denoting a temperature limitation for the deformability of the food matrix, which is closely correlated with textural perception.
The correlation between aw and moisture content can be expressed ac- cording to Lewicki’s derivation from Raoult’s law (Lewicki, 2000):
u=A* (1
aw
− 1 )b−1
(1) where u is the water content, A and b are constants. The following equation based on the equation proposed by Bhandari and Howes (1999) can be employed to calculate Tg:
Tg=
∑n
i=1xiΔcp,iTg,i
∑n
i=1xiΔcp,i (2)
where xi is the mole fraction of component i, △Cp, i is the change in heat capacity of component i between the glassy and rubbery states, and Tg,i is the glass transition temperature of component i. In the case of bread, the components including starch, gluten, fiber and water are taken into account for the Tg calculation.
Because the coupling of (a) the overall molecular mobility of complexly structured molecular mixtures (e.g., bread) and (b) the particular availability and mobility of plasticizers (e.g., water) is essential, a graph depicting the relationship between Tg, aw, and moisture content (MC) (TaM-Diagram) was plotted in Fig. 4. The TaM- Diagram was used to compare the measurement data from the litera- ture, and the good agreement verifies the robustness of the plot.
Fig. 3.Weight loss and volume loss of bread during storage.
Journal of Food Engineering 296 (2021) 110462
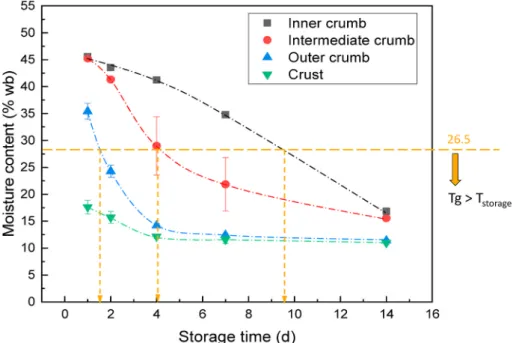
5 3.3. Kinetic changes in the moisture content in different regions of bread over time
Fig. 5 demonstrates the kinetics of water redistribution within the bread during ambient storage. On day 1 (fresh bread), the inner crumb and the intermediate crumb contain a high moisture content (45.6 ± 0.1% and 45.2 ±0.2%, respectively). A relatively lower moisture con- tent (35.4 ±1.5%) was observed in the outer crumb, and the lowest moisture content (17.6 ±1.3%) was observed in the crust. The initial moisture gradient within the bread is most likely caused in response to
water removal during baking, a process in which the crust experiences the highest temperature, resulting in a substantial amount of water loss.
Similar results were also reported by Thorvaldsson and Skj¨oldebrand (1998), who stated that evaporation of water vapor near the surface and condensation closer to the center, result in the movement of water to- ward the center during baking.
During ambient storage, all regions in the bread (inner crumb, in- termediate crumb, outer crumb, and crust) exhibited a decrease in moisture content. The steady decline in the moisture content of the crust might indicate that the crust does not absorb the water migrating from Fig. 4. Comparison of experimental data from literature with calculations from own data applying equations (1) and (2) (− □− : Tg calculated based on equation (2); − • − : MC derived from equation (1); ⋄: Tg data from Huang et al. (1996); ○: Tg data from Bhatt and Nagaraju (2009); □: Tg data from Wang and Zhou (2017);
∇: Tg data from Buera et al. (1998); Δ: MC data from Buera et al. (1998)).
Fig. 5. Development of moisture content (wet basis) in different regions within the bread over time, including the indication of time points at which the Tg exceeds the storage temperature of 23 ◦C in specific regions of the bread.
Y. Chen et al.
the crumb during storage. It is highly probable that water is transferred from the crumb via the interconnected pores directly to the atmosphere in the climate chamber without resulting in the moistening of the crust.
In addition, the inner crumb maintained the highest moisture content during the entire storage period, followed by the intermediate and the outer crumbs, respectively. The moisture content remained the lowest in the crust over time. These observations imply that dehydration takes place in all regions of the bread; the moisture in the inner crumb seems to be more conserved than that in other regions. This phenomenon could be explained by diffusion kinetics in bread, as diffusion is regarded as the main driving force of water transfer in food products (Boudhrioua et al., 2003). The outer crumb exhibited a greater drop in moisture content within the first 4 days compared to the other regions. As it is located right next to the crust, water in the outer crumb is assumed to diffuse easily via the pores in the crust to the surrounding environment owing to the difference in partial vapor pressure. This assumption can be confirmed by the findings of Monteau et al. (2017), who studied water transfer in bread during staling using numerical models and observed that evaporation was greater in the region closer to the crust.
From day 7 onward, similar water contents were observed in the outer crumb and the crust, indicating that both regions achieve their equilibrium with the atmosphere, with similar equilibrium moisture contents. Furthermore, the inner crumb and intermediate crumb showed similar levels of moisture content on days 1 and 2. However, the dif- ference between the moisture content of these two regions increased on days 4 and 7. On day 14, they again attained a similar moisture content.
These results revealed that the dehydration of the bread starts pre- dominantly in the outer part of the bread in the initial stage and pro- gresses to the inner part, where a substantial decrease in the moisture content is observed in the later stages. This is because the water transfer rates inside the bread are regulated by diffusion, as water molecules move from a region with a high concentration towards a region with a lower concentration (Derossi et al., 2011; Toǧrul and Pehlivan, 2003). In the initial stage of storage, the high concentration gradient with respect to the water content between the crust and the outer crumb leads to rapid dehydration in the outer part of the bread. With increased storage time, the higher moisture gradient between the inner crumb, interme- diate crumb, and outer crumb causes further drying in the crumb. In addition, the different drying kinetics in different regions of the bread could be related to their different structural properties.
From Fig. 6, it can be extrapolated that the critical moisture content is approximately 26.5% under given storage conditions, where Tg = 23 ◦C. Thus, when the moisture content is below 26.5%, the bread is in a glassy state, where molecular mobility is strongly restricted. As shown in Fig. 5, the crust is in a “quasi glassy” state already after baking, and no or only very minor structural changes can be expected to be detectable within the crust during storage. Fig. 5 also illustrates that the main structural changes in the bread structure may appear before day 10 in the inner crumb, before day 4 in the intermediate crumb, and before day 2 in the outer crumb. This could explain the lower volume loss observed during the later stages of ambient storage (Fig. 3).
3.4. Changes in porosity and pore connection over time
Porosity is referred to as the ratio of the open space in the material to the total volume of the material (Srikiatden and Roberts, 2007). In the case of bread, the porosity represents the volume fraction of pores in the entire bread. The porous structure of the bread could be attributed to the incorporation of bubbles during dough mixing, yeast fermentation, and the expansion and breakage of air bubbles during baking (Besbes et al., 2013). As shown in Fig. 7, the fresh bread had an initial porosity of 53.7
±1.6% on day 1. This result was comparable to the value (60% for the bread with a proofing volume of 300 mL) reported by Primo-Martín et al. (2010). Over time, a mild increase in porosity was observed. On day 14, the aged bread had a significantly higher porosity of 56.8 ± 1.0%. The porosity is expected to increase because the pores containing water are replaced by air as the dehydration proceeds (Aprajeeta et al., 2015). It has been stated in the literature that porosity is inversely proportional to material shrinkage (Mahiuddin et al., 2018). Such in- verse correlation has been observed in this study as well. After 14 days of storage, the bread lost approximately 27.5% of its volume but gained approximately 5.8% porosity.
The pore connection is defined by the percentage ratio of the maximum pore volume to the total volume of the pores. A high pore connection value means that the pores are highly interconnected, whereas a low value implies that the pores are separated from each other. When the value of the pore connection is close to 100%, almost all pores are interconnected (Chevallier et al., 2014). Fresh bread had a high value of the pore connection (99.6 ±0.1%), suggesting that most of the pores in the bread are interconnected. This result was in agreement Fig. 6. TaM-Diagram with indications of parameters for the inner crumb and crust at days 1 and 14 and indication of glass transition conditions at a storage temperature of 23 ◦C.
Journal of Food Engineering 296 (2021) 110462
7 with that obtained by Wang et al. (2011), who reported values of approximately 99% for 5 different breads and stated that breads exhibit a maze-like structure where all the open cells are massively inter- connected, creating a single large cell that is open to the atmosphere.
The interconnected and open porous structure could be attributed to the escape of the gasses from the inside of the bread to the surrounding atmosphere during baking. Mondal and Datta (2008) claimed that CO2 is released from the bread during baking when the bubble walls break under pressure, resulting in a more continuous and open porous struc- ture. Furthermore, the value of the pore connection of the bread did not change significantly during ambient storage. This observation indicates that the bread maintained its open structure and high levels of pore interconnectivity over time. Additionally, the moisture-induced volume shrinkage and the increase in porosity seem to have had an insignificant impact on the interconnectivity of the pores.
3.5. Evolution of average cell wall thickness over time
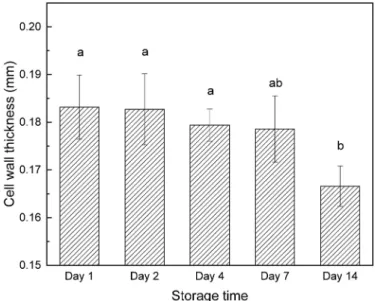
Fresh bread on day 1 had an average cell wall thickness of 0.18 ± 0.01 mm, which corresponds well with the values present in the litera- ture, i.e., 0.17–0.19 mm reported by Van Dyck et al. (2014) and 0.23–0.24 mm stated by Besbes et al. (2013). The cell wall mainly consists of solid materials (starch and gluten) and a small amount of water (Mahiuddin et al., 2018). As shown in Fig. 8, the cell wall thick- ness decreased progressively during storage. The significant reduction in the wall thickness observed on day 14 could be explained by the dehydration of the cell wall components and the removal of the free water from the cell wall. As the moisture content in the cell wall is rather low, a drastic decrease in wall thickness is not expected. Cell wall thickness is believed to be highly associated with the mechanical properties of the cellular structure (Falcone et al., 2004). As a conse- quence, the reduced cell wall thickness might be one of the causes of the crack formation observed on day 7 and day 14 of storage. During stor- age, the different rates of moisture transport between the outer part and the inner part of the bread (see Fig. 5) resulted in the generation of a stress gradient within the bread. Cracking occurs when the stresses exceed the failure stress of the cell wall (Gulati and Datta, 2015). As drying proceeds, the cell wall thickness continuously reduces to a point where the cell wall might be too thin and too brittle to withstand the large stress gradient inside the bread, resulting in the local disruption of structure and eventual crack formation.
3.6. Changes in pore size distribution over time
As depicted in Fig. 9, in the fresh bread, a large fraction of pores was observed in the diameter ranges of 0.1–0.3 mm (20.7 ±1.0%), 0.5–0.8 mm (26.8 ±1.0%), and 1–3 mm (18.6 ±2.9%). This wide distribution of pore sizes suggests that the pores in the crumb do not have uniform sizes.
As discussed previously, the porous structure of the bread is determined by a series of aeration stages during bread preparation, including kneading, proofing, and baking (Besbes et al., 2013). The heterogeneity of the pore sizes could be attributed to the nonhomogeneous entrapment of the gas bubbles in the dough during kneading, heterogeneous yeast distribution inside the dough, and non-uniform local expansion during baking.
Similar to day 1, the majority of the pores on day 14 were distributed in size ranges of 0.1–0.3 mm, 0.5–0.8 mm, and 1–3 mm. However, sig- nificant increases in the equivalent pore diameter were found in the ranges 0–0.1 mm and 0.1–0.3 mm, indicating that a significant number of small pores (≤0.3 mm) were generated during the storage. A plausible explanation could be that some pores are compressed due to the Fig. 7. Porosity of bread over time (different letters indicate significantly
different means at P ≤0.05).
Fig. 8.Average cell wall thickness of bread over time (different letters indicate significantly different means at P ≤0.05).
Fig. 9.Comparison of pore size distribution in bread on day 1 and day 14 (different letters in each interval indicate significantly different means at P
≤0.05).
Y. Chen et al.
shrinkage of the bread, resulting in reduced pore sizes. It should be noted that there was a slight increase in the number of large pores (>3 mm) in the aged bread, which might be due to crack formation. The relatively higher number of large pores generated during storage could also be another cause for the increased number of small pores on day 14 as the bread volume was reduced over time.
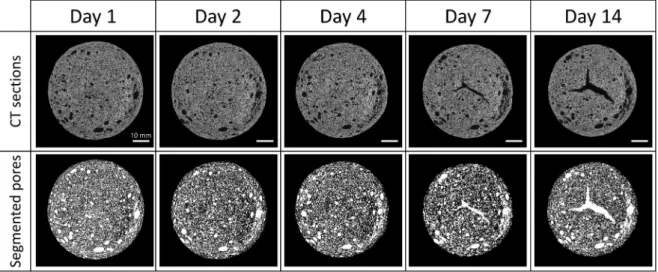
Fig. 10 demonstrates 2D images of the bread during storage at a central depth of the samples. As illustrated in the images, pores of various sizes were randomly distributed inside the bread, but most of the pores were rather small. In addition, a higher number of relatively larger pores was seen in the outer crumb, which could be attributed to the uneven bubble expansion underneath the crust during baking. This observation also explains the distinct drying kinetics of the outer crumb.
Over time, the changes in the pore structure were not pronounced enough to be observed in images between day 1 and day 4, which sug- gests that pore sizes are not significantly altered during the early stage of ambient storage; the statistical findings associated with structural changes presented above are in agreement with this hypothesis. How- ever, cracking can be clearly identified in the center of the crumb on day 7, which evidently expands on day 14.
3.7. Evolution of grayscale intensity over time
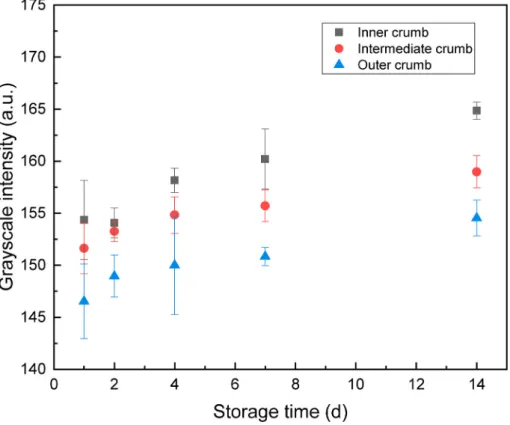
Fig. 11 depicts the changes in the average grayscale intensity of the bread during storage. The grayscale intensity ranged from 0 to 255, indicating the extent of X-ray absorption by the bread (Wang et al., 2011). On day 1, the inner crumb, intermediate crumb, and outer crumb all had an intensity of approximately 145–155, with the inner crumb having the highest value, followed by the intermediate crumb and the outer crumb. Over time, an increase in intensity was observed in all regions of the bread. The intensity of the inner crumb was consistently higher than that of the intermediate and outer crumbs during the entire storage period, whereas the outer crumb exhibited the lowest intensity.
X-ray imaging is based on the attenuation of the X-ray beam trans- mitted through a sample (Yang et al., 2016). At fixed energy and with comparable object thickness, the contrast in an X-ray image is a function of the chemical composition and the density of the material (Yang, 2017). Changes in the density of a sample could be detected by micro-CT. In general, a dense material absorbs more X-ray radiation;
thus, less radiation is transmitted through the material, resulting in a high signal intensity in the X-ray images (Henkensiefken et al., 2011). In light of this principle, the increase in the intensity in all regions of the bread could be due to the increase in the network density during storage.
The change in the network density in the bread could be attributed to
water loss from the pores during storage. It has been reported that water movement in a material can cause changes in the local density, thus influencing the grayscale intensities of the X-ray images (Bentz et al., 2006). In this study, the slowest increase in the intensity of the outer crumb over time could be correlated to lower amount of reduction in the moisture content in this region compared to that in the other regions of the bread (Fig. 5). Furthermore, another plausible reason for the in- crease in the network density is starch retrogradation during storage.
After baking, amylose and amylopectin in the bread tend to re-associate, forming a crystalline network. During storage, this network further matures and increases the size and number of inter- and intra-molecular crystalline zones (Goesaert et al., 2009). Such extensive networks and supermolecular structures would consequently contribute to the in- crease in density, thereby increasing the grayscale intensity. As mentioned previously, crumb porosity increased from 53.7 ±1.6% to 56.9 ±1.0% during ambient storage. On the other hand, bread volume reduced approximately 27% during storage. Therefore, the increase in porosity did not pose a significant impact on bread density.
Fig. 12 shows the evolution of the microstructural changes in the inner crumb in three dimensions over time. It can be noted that bread crumb exhibits a porous sponge-like structure; this is supported by the observations of Primo-Martín et al. (2010). Moreover, some “bright spots” with a relatively higher intensity can be identified in the 3D images. As discussed, these spots might correspond to dense structures.
During storage, the number of the “bright spots” is seen to increase, which is in line with the findings depicted in Fig. 11. The 3D images also reveal the nonhomogeneous pore size distribution and 3D cracks in the inner crumb.
4. Conclusions
This work studied the structure-property relationships related to water transport in wheat bread during ambient storage. The strong correlation between weight loss and volume loss confirmed that the volume shrinkage is mainly caused by water migration. The more intensive volume loss in the early storage state and its significant decrease after 7 days of storage indicate increasing loss of structural deformability that approaches a quasi-glassy state as soon as the glass transition temperature of the bread crumb region exceeds the storage temperature of 23 ◦C. Accordingly, the “Tg-criterion” suggests that the inner/intermediate/outer crumb structures contribute to the volume change only until day 10, 4, and 2, respectively, while the moisture loss related mass loss continues until day 14. According to the model cal- culations applied, the bread does not fully reach an equilibrium within
Fig. 10.2D cross-sectional pore images of bread during storage. The images in the first row refer to the axial sections of the samples without crust obtained at a central depth. The second row shows the same central sections segmented with a global thresholding with respect to the porosity detected. Scale bar =10 mm.
Journal of Food Engineering 296 (2021) 110462
9 this period under the storage conditions used.
Micro-CT proved to be effective at providing spatial information about the morphological characteristics (porosity, pore connection, cell wall thickness, pore size distribution, etc.) of the bread and their alter- ations during ambient storage. After 14 days storage, a significant in- crease in the total porosity, a significant decrease in the average cell wall thickness, and a significant increase in the number of small pores were observed and quantified. Moreover, the grayscale intensity can be seen as an indicator of the network density. The increase in the grayscale intensity of the bread over time is expected to result from the increase in the network density as a consequence of dehydration and starch recrystallization during bread staling.
Author contribution
Yi Chen, Conceptualization, Methodology, Investigation, Data cura- tion, Visualization, Writing and editing. Annapaola Parrilli, Conceptu- alization, Methodology, Micro-CT analysis, Visualization, Data curation, Reviewing and editing. Florian Jaedig, Investigation. Adrian Fuhrmann, Investigation. Christian Staedeli, Resources, Funding acquisition. Peter Fischer, Conceptualization, Supervision, Reviewing and editing. Erich J.
Windhab, Conceptualization, Supervision, Reviewing and editing,
Funding acquisition Acknowledgement
This work was supported by Innosuisse - Schweizerischen Agentur für Innovationsf¨orderung, Switzerland (Schweizer Brot ohne Alterung (18153.2)). We would like to thank Jowa AG for the support in carrying out this project. We would like to thank Empa (Swiss Federal Labora- tories for Materials Science and Technology) for the support in Micro-CT measurements.
References
Aprajeeta, J., Gopirajah, R., Anandharamakrishnan, C., 2015. Shrinkage and porosity effects on heat and mass transfer during potato drying. J. Food Eng. 144, 119–128.
https://doi.org/10.1016/j.jfoodeng.2014.08.004.
Bentz, D.P., Halleck, P.M., Grader, A.S., Roberts, J.W., 2006. Four-dimensional X-ray microtomography study of water movement during internal curing. In: Jensen, O.M., Lura, P., Kovler, K. (Eds.), International RILEM Conference – Volume Changes of Hardening Concrete: Testing and Mitigation. RILEM Publications S.A.R.L., pp. 11–20. https://doi.org/10.1617/2351580052.002
Besbes, E., Jury, V., Monteau, J.-Y., Le-Bail, A., 2013. Characterizing the cellular structure of bread crumb and crust as affected by heating rate using X-ray microtomography. J. Food Eng. 115, 415–423.
Fig. 11.Development of average intensity of different regions within bread over time.
Fig. 12.3D images of inner crumbs during storage. Scale bar =5 mm.
Y. Chen et al.
Bhandari, B.R., Howes, T., 1999. Implication of glass transition for the drying and stability of dried foods. J. Food Eng. 40, 71–79. https://doi.org/10.1016/S0260- 8774(99)00039-4.
Bhatt, C.M., Nagaraju, J., 2009. Studies on glass transition and starch re-crystallization in wheat bread during staling using electrical impedance spectroscopy. Innovat. Food Sci. Emerg. Technol. 10, 241–245. https://doi.org/10.1016/j.ifset.2008.10.002.
Boudhrioua, N., Bonazzi, C., Daudin, J.D., 2003. Estimation of moisture diffusivity in gelatin-starch gels using time-dependent concentration-distance curves at constant temperature. Food Chem. 82, 139–149. https://doi.org/10.1016/S0308-8146(02) 00542-3.
Buera, M.P., Jouppila, K., Roos, Y.H., Chirife, J., 1998. Differential scanning calorimetry glass transition temperatures of white bread and mold growth in the putative glassy state. Cereal Chem. 75, 64–69.
Cauvain, S.P., 2012. Breadmaking - Improving Quality, Second. Woodhead Publishing.
Chevallier, S., R´eguerre, A.L., Le Bail, A., Della Valle, G., 2014. Determining the cellular structure of two cereal food foams by X-ray micro-tomography. Food Biophys. 9, 219–228. https://doi.org/10.1007/s11483-014-9336-5.
Datta, A.K., Sahin, S., Sumnu, G., Ozge Keskin, S., 2007. Porous media characterization of breads baked using novel heating modes. J. Food Eng. 79, 106–116. https://doi.
org/10.1016/j.jfoodeng.2006.01.046.
Derossi, A., Severini, C., Cassi, D., 2011. Mass transfer mechanisms during dehydration of vegetable food: traditional and innovative approaches. In: El-Amin, M. (Ed.), Advanced Topics in Mass Transfer. IntechOpen. https://doi.org/10.5772/14725.
Falcone, P.M., Baiano, A., Zanini, F., Mancini, L., Tromba, G., Montanari, F., Del Nobile, M.A., 2004. A novel approach to the study of bread porous structure: phase- contrast X-ray microtomography. J. Food Sci. 69, 38–43. https://doi.org/10.1111/
j.1365-2621.2004.tb17865.x.
Gao, J., Wang, Y., Dong, Z., Zhou, W., 2018. Structural and mechanical characteristics of bread and their impact on oral processing: a review. Int. J. Food Sci. Technol. 53, 858–872. https://doi.org/10.1111/ijfs.13671.
Goesaert, H., Leman, P., Buttebier, A., Delcour, J.A., 2009. Antifirming effects of starch degrading enzymes in bread crumb. J. Agric. Food Chem. 57, 2346–2355. https://
doi.org/10.1021/jf803058v.
Gulati, T., Datta, A.K., 2015. Mechanistic understanding of case-hardening and texture development during drying of food materials. J. Food Eng. 166, 119–138. https://
doi.org/10.1016/j.jfoodeng.2015.05.031.
Henkensiefken, R., Nantung, T., Weiss, J., 2011. Saturated lightweight Aggregate for internal curing in low w/c mixtures: monitoring water movement using X-ray absorption. Strain 47, 432–441. https://doi.org/10.1111/j.1475-1305.2009.00626.
Huang, V.T., Haynes, L., Levine, H., Slade, L., 1996. Glass transitions in starch, gluten x.
and bread as measured: dielectric spectroscopy and TMA methods. J. Therm. Anal.
47, 1289–1298. https://doi.org/10.1007/BF01992828.
Hug-Iten, S., Escher, F., Conde-Petit, B., 2003. Staling of bread: role of amylose and amylopectin and influence of starch-degrading enzymes. Cereal Chem. 80, 654–661.
Karathanos, V.T., Kanellopoulos, N.K., Belessiotis, V.G., 1996. Development of porous structure during air drying of agricultural plant products. J. Food Eng. 29, 167–183.
https://doi.org/10.1016/0260-8774(95)00058-5.
Lassoued, N., Babin, P., Della Valle, G., Devaux, M.F., R´eguerre, A.L., 2007.
Granulometry of bread crumb grain: contributions of 2D and 3D image analysis at different scale. Food Res. Int. 40, 1087–1097. https://doi.org/10.1016/j.
foodres.2007.06.004.
Lewicki, P.P., 2000. Raoult’s law based food water sorption isotherm. J. Food Eng. 43, 31–40. https://doi.org/10.1016/S0260-8774(99)00130-2.
Mahiuddin, M., Khan, M.I.H., Kumar, C., Rahman, M.M., Karim, M.A., 2018. Shrinkage of food materials during drying: current status and challenges. Compr. Rev. Food Sci.
Food Saf. 17, 1113–1126. https://doi.org/10.1111/1541-4337.12375.
Maire, E., Buffi`ere, J.Y., Salvo, L., Blandin, J.J., Ludwig, W., L´etang, J.M., 2001. On the application of X-ray microtomography in the field of materials science. Adv. Eng.
Mater. 3, 539–546. https://doi.org/10.1002/1527-2648.
Mathieu, V., Monnet, A.F., Jourdren, S., Panouill´e, M., Chappard, C., Souchon, I., 2016.
Kinetics of bread crumb hydration as related to porous microstructure. Food Funct 7, 3577–3589. https://doi.org/10.1039/c6fo00522e.
Mondal, A., Datta, A.K., 2008. Bread baking - a review. J. Food Eng. 86, 465–474.
https://doi.org/10.1016/j.jfoodeng.2007.11.014.
Monteau, J.Y., Purlis, E., Besbes, E., Jury, V., Le-Bail, A., 2017. Water transfer in bread during staling: physical phenomena and modelling. J. Food Eng. 211, 95–103.
https://doi.org/10.1016/j.jfoodeng.2017.04.016.
Panzavolta, S., Torricelli, P., Casolari, S., Parrilli, A., Fini, M., Bigi, A., 2018. Strontium- substituted hydroxyapatite-gelatin biomimetic scaffolds modulate bone cell response. Macromol. Biosci. 18, 1–10. https://doi.org/10.1002/mabi.201800096.
Parfitt, A.M., Drezner, M.K., Glorieux, F.H., Kanis, J.A., Malluche, H., Meunier, P.J., Ott, S.M., Recker, R.R., 1987. Bone Histomorphometry : standardization. J. Bone Miner. Res. 2, 595–610.
P´erez-Nieto, A., Chanona-P´erez, J.J., Farrera-Rebollo, R.R., Guti´errez-L´opez, G.F., Alamilla-Beltr´an, L., Calder´on-Domínguez, G., 2010. Image analysis of structural changes in dough during baking. LWT - Food Sci. Technol. (Lebensmittel- Wissenschaft -Technol.) 43, 535–543. https://doi.org/10.1016/j.lwt.2009.09.023.
Primo-Martín, C., van Dalen, G., Meinders, M.B.J., Don, A., Hamer, R.H., van Vliet, T., 2010. Bread crispness and morphology can be controlled by proving conditions.
Food Res. Int. 43, 207–217.
Rathnayake, H.A., Navaratne, S.B., Navaratne, C.M., 2018. Porous crumb structure of leavened baked products. Int. J. Food Sci. 1–15. https://doi.org/10.1155/2018/
8187318.
Srikiatden, J., Roberts, J.S., 2007. Moisture transfer in solid food materials: a review of mechanisms, models, and measurements. Int. J. Food Prop. 10, 739–777. https://
doi.org/10.1080/10942910601161672.
Thorvaldsson, K., Skjoldebrand, C., 1998. Water diffusion in bread during baking. Leb.
u.-Technol 31, 658–663.
Toǧrul, I.T., Pehlivan, D., 2003. Modelling of drying kinetics of single apricot. J. Food Eng. 58, 23–32. https://doi.org/10.1016/S0260-8774(02)00329-1.
Van Dyck, T., Verboven, P., Herremans, E., Defraeye, T., Van Campenhout, L., Wevers, M., Claes, J., Nicolaï, B., 2014. Characterisation of structural patterns in bread as evaluated by X-ray computer tomography. J. Food Eng. 123, 67–77.
https://doi.org/10.1016/j.jfoodeng.2013.09.017.
Wang, S., Austin, P., Bell, S., 2011. It’s a maze: the pore structure of bread crumbs.
J. Cereal. Sci. 54, 203–210. https://doi.org/10.1016/j.jcs.2011.05.004.
Wang, Y., Zhou, W., 2017. Non-equilibrium states and glass transitions in Bakery products. In: Non-Equilibrium States and Glass Transitions in Foods: Processing Effects and Product-specific Implications, pp. 63–87. https://doi.org/10.1016/B978- 0-08-100309-1.00005-5.
Yang, F., 2017. Multi-contrast X-Ray Imaging of Water Transport in Cement-Based Materials. ETH Zurich.
Yang, F., Griffa, M., Bonnin, A., Mokso, R., Di Bella, C., Münch, B., Kaufmann, R., Lura, P., 2016. Visualization of water drying in porous materials by X-ray phase contrast imaging. J. Microsc. 261, 88–104. https://doi.org/10.1111/jmi.12319.