Resonant Scattering by Magnetic Impurities as a Model for Spin Relaxation in Bilayer Graphene
Denis Kochan,* Susanne Irmer, Martin Gmitra, and Jaroslav Fabian Institute for Theoretical Physics, University of Regensburg, 93040 Regensburg, Germany (Received 15 April 2015; revised manuscript received 14 July 2015; published 4 November 2015)
We propose that the observed spin relaxation in bilayer graphene is due to resonant scattering by magnetic impurities. We analyze a resonant scattering model due to adatoms on both dimer and nondimer sites, finding that only the former give narrow resonances at the charge neutrality point. Opposite to single- layer graphene, the measured spin-relaxation rate in the graphene bilayer increases with carrier density.
Although it has been commonly argued that a different mechanism must be at play for the two structures, our model explains this behavior rather naturally in terms of different broadening scales for the same underlying resonant processes. Not only do our results—using robust and first-principles inspired parameters—agree with experiment, they also predict an experimentally testable sharp decrease of the spin-relaxation rate at high carrier densities.
DOI:10.1103/PhysRevLett.115.196601 PACS numbers: 72.80.Vp, 72.25.Rb
Understanding spin relaxation is essential for designing spintronics devices[1,2]. Unfortunately, spin relaxation in graphene structures has been a baffling problem[3]. While experiments in both single layer graphene (SLG) [4–11]
and bilayer graphene (BLG)[7,8] yield spin lifetimes on the 100–1000 ps time scale (the highest values achieved in graphene/h-BN structures [12,13]), theories based on realistic spin-orbit coupling and transport parameters pre- dict lifetimes on the order of microseconds [14–24].
While the magnitudes of the spin-relaxation rates of SLG and BLG are similar, the dependence of the rates on the electron density is opposite in the two systems. In SLG the spin-relaxation rate decreases with increasing the carrier density[5–8], in BLG the spin-relaxation rate increases[7,8].
Since the diffusivity in the investigated samples decreases with increasing the electron density, it has been a common practice to assign two different mechanisms to both struc- tures: the Elliott-Yafet mechanism[25,26]to SLG[5,6,9,10]
and Dyakonov-Perel mechanism[27]to BLG[7–9].
The main problem with that assignment is quantitative.
Spin-orbit coupling in graphene [28]is too weak to yield such a small spin-relaxation time. An explicit first-principles calculation [23] predicts that one would need 0.1% of adatoms to give a 100 ps spin lifetime. Recently a new mechanism for SLG was proposed[29](see also Ref.[30]), based on resonant scattering off local magnetic moments.
It gives the observed spin-relaxation times with as little as 1 ppm of local magnetic moments and also agrees with the experimental behavior for SLG of decreasing the spin- relaxation rate with increasing electron density. Where do these local moments come from? It was theoretically predicted that adatoms such as hydrogen[31,32], but also chemisorbed organic molecules [33] can be responsible.
Experimentally it was demonstrated that hydrogen adatoms indeed induce local moments [34,35], but even untreated
graphene flakes were shown to exhibit 20 ppm spin1=2 paramagnetic moments[36]. The most natural candidates for resonant magnetic scatterers appear to be polymer residues from different fabrication steps of graphene devi- ces. Our mechanism is also in line with mesoscopic transport experiments[37,38]which found strong evidence for the local magnetic moments in the dephasing rates. Our theory does not work for high adatom concentrations (say, above 0.1%), at which the induced magnetic moments seem to form a fluctuating magnetic-field network[34].
In this Letter we propose that the spin relaxation in BLG is caused by the same mechanism of resonant magnetic scatterers. We show that (i) adatoms (we model specifically hydrogen) on dimer and nondimer sites of BLG give different resonance energies and resonance widths, (ii) the calculated spin-relaxation times are in quantitative agree- ment with experiment, (iii) the opposite trends of the spin- relaxation rate in SLG and BLG are due to different scales of the energy fluctuations (caused by electron-hole pud- dles) in the two structures, reflecting their different density of states (DOS), (iv) the spin-relaxation rate in BLG should reverse its trend and decrease with increasing electron density at high densities, making an experimentally veri- fiable prediction. As in SLG, also in BLG resonant magnetic scatterers are spin hot spots[39]: affecting spin but not momentum relaxation.
Model Hamiltonian.—We consider a single adatom on ABstacked bilayer graphene sitting on either a dimer or a nondimer position. The full model Hamiltonian isH0þH0, where
H0¼−t0X
hm;niσ λ∈ft;bg
jaλmσihbλnσj þt1
X
mσ
jatmσihbbmσj þH:c: ð1Þ
is the unperturbed BLG Hamiltonian with intralayer nearest-neighbor hopping t0¼2.6eV, and direct 0031-9007=15=115(19)=196601(5) 196601-1 © 2015 American Physical Society
interlayer hoppingt1¼0.34eV [40]. We neglect indirect interlayer parameters which yield fine features of the energy bands (such as warping and electron-hole asym- metry) as unimportant for our purposes. The first sum runs overhm; ninearest neighbors in the top (λ¼t) and bottom (λ¼b) layers. The second sum runs over theasites of the Asublattice of the top layer andbsites of theBsublattice of the bottom layer. Statejcλmσi represents the spinσ carbon 2pzorbital on sublatticec¼ fa; bgand sitemin layerλ. The eigenvalues ofH0 are[41,42]
εμαðkÞ ¼α 2
μt1þ ffiffiffiffiffiffiffiffiffiffiffiffiffiffiffiffiffiffiffiffiffiffiffiffiffiffiffiffiffiffi t21þ4t20jfðkÞj2
q
; ð2Þ
where the index α labels the conduction (α¼ þ) and valence (α¼−) bands, andμstands for the high (μ¼ þ) and low (μ¼−) energy bands with respect to the charge neutrality point, forfðkÞsee Supplemental Material[43].
We place the adatom on the top layer either on a dimer siteCd, which is anatsite, or on a nondimer siteCnd, which is a bt site. The adatom also carries a local magnetic moment coupled with the electron spins via the exchange interaction J. The HamiltonianH0 is [29],
H0¼X
σ
εjhσihhσjþωðjhσihcσjþjcσihhσjÞ−Jˆs·S;ˆ ð3Þ
wherejhσiis the adatom orbital with spinσ. This orbital has on-site energyεand is connected to the siteCon the bilayer with hopping energyω. The spin operatorssˆandS,ˆ which are the Pauli matrices in the corresponding spinor spaces, are for itinerant electrons and local magnetic moments, respectively.
To obtain realistic parameters for the adatom HamiltonianH0, we performed first-principles calculations with QUANTUM ESPRESSO [48] using a 7×7 graphene
supercell with a single hydrogen adatom. In agreement with previous studies [49] we found that hydrogen on both dimer and nondimer sites induces local magnetic moments of 1 Bohr magneton per unit cell. However, for fitting the orbital parameters ofH0, namelyεandω, we used the spin- unpolarized first-principles band structure and setJ¼0in the tight-binding calculation. For the dimer site we select ε¼0.25eV andω¼6.5eV, while for the nondimer one ε¼0.35eV andω¼5.5 eV. Figures1(a)and1(c)show that the fits are very good. However, these fitted parameters are not unique, as a larger neighborhood of values offers a comfortable agreement with first-principles data. We have selected the values which are close to the uniquely fitted SLG orbital parameters. For the exchange coupling we take the same (unbiased) value as for SLG[29],J¼−0.4eV.
Resonant scattering.—We transform the adatom HamiltonianH0 into the singlet (l¼0) and triplet (l¼1) basisjcl;mli ¼ jci⊗jl; mli[labelml ¼−l;…;l is the total spin projection] and eliminate the adatom orbital jhi by downfolding. This gives the energy dependent perturbation H0ðEÞ ¼P
l;mlVlðEÞjcl;mlihcl;mlj, allow- ing us to analytically calculate the T matrix, TðEÞ ¼ P
l;mlTlðEÞjcl;mlihcl;mlj, where VlðEÞ ¼ ω2
E−εþ ð4l−3ÞJ; ð4aÞ TlðEÞ ¼ VlðEÞ
1−VlðEÞGCðEÞ: ð4bÞ Here GCðEÞ≡ΛCðEÞ−iπνCðEÞ is the C-site projected Green’s function per atom and spin of the unperturbed BLG with
ΛCðEÞ ¼ E 2D2ln
E2ðE2−t21Þ ðD2−E2Þ2
þt1ΔC
2D2ln Eþt1
E−t1
; ð5Þ
K Γ
Γ M -1 -0.5 0 0.5 1
E-EF [eV]
-0.4 -0.2 0 0.2 0.4 Fermi energy [eV]
0 0.01 0.02 0.03
DOS [states / eV atom spin]
dimer site BLG plain BLG 0.05%
K Γ
Γ M
-1 -0.5 0 0.5 1
E-EF [eV]
-0.4 -0.2 0 0.2 0.4 Fermi energy [eV]
0 0.01 0.02 0.03
DOS [states / eV atom spin]
non-dimer site BLG plain BLG 0.05%
(a) (b) (c) (d)
FIG. 1 (color online). Calculated electronic structure of bilayer graphene with hydrogen adatoms. Panels (a) and (b) are for dimer adatoms, (c) and (d) for nondimer ones. In (a) and (c) we plot the electronic band structures: dotted lines are spin-unpolarized first- principles calculations using a7×7supercell, while solid lines are tight-binding fits as described in text. Panels (b) and (d) show unperturbed, ϱþ0ðEÞ þϱ−0ðEÞ, and perturbed, RCðEÞ (with adatom concentration of η¼0.05%), DOS per atom and spin. Dimer adatoms (b) show a narrow resonant peak near the charge neutrality point atEres≃22.5meV with the full width at half maximum Γ≃8.4meV. Nondimer adatoms (d) induce a broad resonance atEres≃26.1meV withΓ≃165.2meV. For plotting DOS we perform running averages of 20 meV. Insets: schemes of the tight-binding model Hamiltonian,H0þH0, Eqs.(1) and(3).
νCðEÞ ¼X
μ¼
jEj−μΔCt1
2D2 ΘðD−jEjÞΘðjEj−μt1Þ; ð6Þ where D¼ ffiffiffiffiffiffiffiffiffiffiffiffi
p3 p π
t0≃6eV is the effective BLG band- width andΔCequals zero for theCdsite and one for theCnd
site, respectively.
We first analyze orbital resonances ofH0 (setJ¼0) by plotting in Figs.1(b)and1(d)the perturbed DOS per atom and spin,RCðEÞ ¼P
μ¼ϱμ0ðEÞ−ðη=πÞImf½−ðd=dEÞGCðEÞ× TlðE;J¼0Þg, where η is the adatom concentration per carbon atom andϱμ0ðEÞ ¼ ð2jEj−μt1Þ=ð4D2ÞΘðD−jEjÞΘ ðjEj−μt1Þis the unperturbed bilayer DOS per atom and spin for the high (μ¼ þ) and low (μ¼−) energy band, for details see Ref.[43]. As seen from Fig.1(b), the dimer site hydrogen chemisorption induces a pronounced narrow resonance near the charge neutrality point. In contrast, nondimer adatoms, see Fig.1(d), give a broad and shallow resonance. This striking difference is explained by considering the character of the resonance states. In a monolayer graphene an adatom on the Asite induces a resonance state which is localized mainly on theBsublattice. Thus, an adatom on a dimer site induces a resonance state which is spread mainly on the nondimer sublattice and hybridizes only little with the other layer, keeping the resonance narrow. If the adatom is on a nondimer site, the resonance state is mainly on the dimer sublattice which couples to the other layer, causing a leakage of the state and broadening of the resonance. The same behavior is seen in vacancy models[50].
Spin-flip scattering and spin-relaxation rate.—The T matrix allows us to compute the spin-flip rate for a single scattering event by the adatom at siteC(dimer or nondimer) jkμðEÞ;↑i→jqνðE0Þ;↓ibetween bandsμandν[51],
WCkμ↑;qν↓¼2π
ℏ η2fC↑;↓ðEÞPμCðEÞPνCðE0ÞδðE−E0Þ; ð7Þ where the site and band dependent projections PμCðEÞ ¼ 2ðjEj−μΔCt1Þ=ð2jEj−μt1ÞΘðD−jEjÞΘðjEj−μt1Þ, see also Ref.[43]. The exchange-induced spin-flip function is
fC↑;↓ðEÞ ¼ X
l¼0;1
ðl−12ÞVlðEÞ 1−VlðEÞGCðEÞ
2: ð8Þ
The spin-flip rate does not depend on the relative orientation of k and q, since the energy dispersion in our model has rotational symmetry. However, the spin-flip rate is very different for dimer and nondimer adatoms.
To obtain the spin-relaxation rate 1=τCs we sum over different partial rates and obtain
1 τCs ¼η2π
ℏ fC↑;↓ðEÞ½PþCðEÞϱþ0ðEÞ þP−CðEÞϱ−0ðEÞ2
ϱþ0ðEÞ þϱ−0ðEÞ ; ð9Þ where the labelsþand−denote BLG high and low energy bands entering the definitions of PμC and ϱμ0 given in the text. To get the final spin-relaxation rate we take an unbiased average over the dimer and nondimer sites,
1=τs≡1=ð2τCsdÞ þ1=ð2τCsndÞ. This is plotted in Fig. 2(a) and compared with SLG. Two pronounced shoulders—we call themspin-relaxation edges—in1=τCsd emerge from the exchange splitting of the orbital resonance seen in DOS at Fig.1(b), just like for SLG, although the peaks in BLG are more separated due to the energy renormalization by the interlayer coupling. In contrast, nondimer adatoms show a rather flat behavior with respect to the energy, reflecting the broad resonance of the perturbed DOS, Fig.1(d). Nondimer adatoms still induce a large1=τssince they strongly perturb the low-energy states which are localized on the nondimer sites. This behavior is encoded in the low-energy site projectionP−CðEÞ, in Eq.(9), which is at low energies much larger for nondimer than for dimer adatoms.
Comparison with experiments and contrasting single and bilayer graphene.—Comparison with experiments requires temperature and electron-hole puddles broadening of 1=τs. Temperature broadening is due to population smearing, (−∂f0=∂E), wheref0 is the Fermi-Dirac distri- bution. The puddle broadening is modeled as a convolution with a Gaussian kernel of standard deviation σbr. For the bilayer we useσbr≃23meV, which corresponds to density fluctuationsΔnof8.5×1011=cm2, following experimental estimates[52]. In Figs.2(b)–2(d)we present the main results of this Letter, the fully broadened relaxation rates compared with Aachen-Singapore (AS) [7] and Riverside (R) [8]
experiments. Clearly the two experiments are somewhat at odds, but they display consistent behavior at low temper- atures. We adjust the local moment concentration to describe the AS data, obtainingη¼0.17ppm. All other parameters are as obtained from the orbital fits. The agreement at low temperatures is especially good. At high temperatures the overall shapes differ, but the two experiments differ as well.
This experimental discrepancy further underlines the extrin- sic character of the spin relaxation in BLG. It is likely that the relative population of dimer and nondimer adatoms changes with temperature, differently in different samples, reflecting the idiosyncrasy of the experimental data.
However, our calculation gives a rather robust prediction at low temperatures: at high carrier densities, above the spin- relaxation edge at about 5×1012=cm2, the spin-relaxation rates should start to decrease.
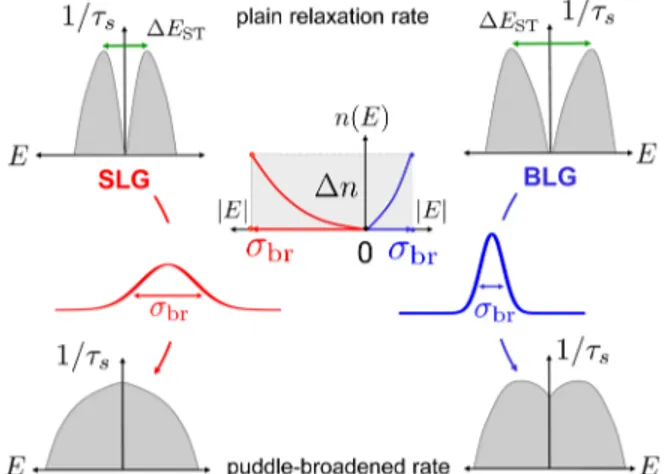
Perhaps the most pressing remaining question is: Given the same resonant spin-relaxation mechanism for single and bilayer graphene, why do their spin-relaxation rates have the opposite trends as functions of charge density[7,8]? Our mechanism offers a natural, and perhaps mundane answer:
electron-hole puddles. At low temperatures and in the absence of density fluctuations the two structures should exhibit the same trend, namely, an increase of the spin- relaxation rate going away from the charge neutrality point.
In SLG the behavior is exactly opposite. The reason is offered in Fig.3. In SLG the carrier density fluctuations lead to a large Fermi energy smearing (σbr¼91meV versus σbr¼23meV in BLG for the same carrier density fluc- tuationΔnof8.5×1011=cm2). Averaging over the Fermi
energy of the singlet-triplet split spin-relaxation peaks then inverts the shape of the spin-relaxation rate around the Dirac point. In the bilayer, due to its greater density of states, the energy broadening is much more modest, and the
experiments (unless their samples would exhibit large variations of the electronic densities) find the behavior as expected for an unbroadened system. Figure 3 also shows the origin of the spin-relaxation edge and the robust- ness of our prediction of the decrease of the spin-relaxation rate at greater electron densities. At high temperatures (above 100 K), it is enough to invoke thermal broadening to see the trend reversal even in ultraclean SLG, as its resonance peaks are closer than those in BLG [43]. The picture given in Fig.3could be used to analyze experimental trends in spin relaxation in both SLG and BLG.
In conclusion, we showed that resonant scattering by local magnetic moments quantitatively accounts for the experimental data. This spin-relaxation mechanism also explains the apparently striking opposite behavior of the measured spin relaxation of SLG and BLG, offering a real alternative to quantitatively unsubstantiated but often made assignment of the two distinct trends as Elliott-Yafet and Dyakonov-Perel. Finally, our model makes a specific prediction of reversing the increase of the spin-relaxation rate in graphene bilayer with increasing carrier density, at high densities, accessible experimentally.
We thank B. Beschoten and R. Kawakami for providing us with their experimental data. This work was supported by DFG SFB 689 and GRK 1570, and by the EU Seventh Framework Programme under Grant Agreement No. 604391 Graphene Flagship.
FIG. 3 (color online). The effect of electron-hole puddles on spin relaxation in SLG and BLG. From top to bottom: The spin- relaxation rate exhibits two resonance peaks due to singlet-triplet splittingΔEST. The splitting of the peaks is greater in BLG. The peaks are broadened by temperature and carrier density fluc- tuationΔnwhich is very different for SLG and BLG, due to their different DOS. For a given temperature and density fluctuation Δn the energy smearing in SLG σbr≃ΔEST, while in BLG σbr≪ΔEST. After broadening, the spin-relaxation rate around the charge neutrality point in SLG has the opposite trend as the unbroadened rate. In BLG the original trend is preserved.
-150 -100 -50 0 50 100 150 Fermi energy [meV]
108 109 1010 1011 1012
1/τ s [s-1 ]
1/τsCd 1/τsCnd BLG: 1/τs
SLG: 1/τs (only meV scale applies)
-6 -4 -2 0 2 4 6
carrier density [x 1012cm-2]
0.17 ppm T=0 K
(a)
-100 0 100 108
109 1010 1011
1/τ s [s-1 ]
Th [5 K]
Exp AS [5 K]
Exp R [4 K]
-6 -4 -2 0 2 4 6
-100 0 100 Fermi energy [meV]
Th [50 K]
Exp AS [50 K]
Exp R [20 K]
-6 -4 -2 0 2 4 6 carrier density [x1012cm-2]
-100 0 100 Th [300 K]
Exp AS [300 K]
Exp R [300 K]
-6 -4 -2 0 2 4 6
0.17 ppm 0.17 ppm 0.17 ppm
(b) (c) (d)
FIG. 2 (color online). Calculated spin-relaxation rates 1=τs as a function of energy (carrier density) for impurity concentration η¼0.17ppm. (a) Zero temperature, unbroadened, rates for dimer (red solid) and nondimer (black solid) adatoms, as well as the resulting average1=τs (blue dotted line). For reference the SLG calculation is also shown (gray dashed-dotted line). (b)–(d) Spin- relaxation rates for three representative temperatures. Theoretical data (blue solid) are broadened, simulating the presence of electron- hole puddles, with a Fermi level smearing of 23 meV. Circles and diamonds represent data points from Aachen-Singapore (AS)[7]and Riverside (R)[8]experiments, respectively. The two shoulders (spin-relaxation edges) at100meV are exchange-split resonances. At high carrier densities the model predicts a decrease of the spin-relaxation rate.
*Corresponding author.
denis.kochan@physik.uni‑regensburg.de
[1] I.Žutić, J. Fabian, and S. Das Sarma,Rev. Mod. Phys.76, 323 (2004).
[2] J. Fabian, A. Matos-Abiague, C. Ertler, P. Stano, and I.
Žutić, Acta Phys. Slovaca57, 565 (2007).
[3] W. Han, R. K. Kawakami, M. Gmitra, and J. Fabian, Nat.
Nanotechnol.9, 794 (2014).
[4] N. Tombros, C. Jozsa, M. Popinciuc, H. T. Jonkman, and B. J. van Wees,Nature (London)448, 571 (2007).
[5] N. Tombros, S. Tanabe, A. Veligura, C. Jozsa, M. Popinciuc, H. T. Jonkman, and B. J. van Wees,Phys. Rev. Lett. 101, 046601 (2008).
[6] K. Pi, W. Han, K. M. McCreary, A. G. Swartz, Y. Li, and R. K. Kawakami,Phys. Rev. Lett.104, 187201 (2010).
[7] T.-Y. Yang, J. Balakrishnan, F. Volmer, A. Avsar, M.
Jaiswal, J. Samm, S. R. Ali, A. Pachoud, M. Zeng, M.
Popinciuc, G. Güntherodt, B. Beschoten, and B. Özyilmaz, Phys. Rev. Lett.107, 047206 (2011).
[8] W. Han and R. K. Kawakami,Phys. Rev. Lett.107, 047207 (2011).
[9] A. Avsar, T.-Y. Yang, S. Bae, J. Balakrishnan, F. Volmer, M.
Jaiswal, Z. Yi, S. R. Ali, G. Güntherodt, B. H. Hong, B.
Beschoten, and B. Özyilmaz,Nano Lett.11, 2363 (2011).
[10] S. Jo, D.-K. Ki, D. Jeong, H.-J. Lee, and S. Kettemann, Phys. Rev. B84, 075453 (2011).
[11] R. G. Mani, J. Hankinson, C. Berger, and W. A. de Heer, Nat. Commun.3, 996 (2012).
[12] M. H. D. Guimarães, P. J. Zomer, J. Ingla-Aynés, J. C. Brant, N. Tombros, and B. J. van Wees, Phys. Rev. Lett. 113, 086602 (2014).
[13] M. Drögeler, F. Volmer, M. Wolter, B. Terrés, K. Watanabe, T. Taniguchi, G. Güntherodt, C. Stampfer, and B. Beschoten, Nano Lett.14, 6050 (2014).
[14] D. Huertas-Hernando, F. Guinea, and A. Brataas,Phys. Rev.
B74, 155426 (2006).
[15] B. Dóra, F. Murányi, and F. Simon, Europhys. Lett. 92, 17002 (2010).
[16] J.-S. Jeong, J. Shin, and H.-W. Lee,Phys. Rev. B84, 195457 (2011).
[17] V. K. Dugaev, E. Y. Sherman, and J. Barnaś,Phys. Rev. B 83, 085306 (2011).
[18] C. Ertler, S. Konschuh, M. Gmitra, and J. Fabian,Phys. Rev.
B80, 041405 (2009).
[19] P. Zhang and M. W. Wu,Phys. Rev. B84, 045304 (2011).
[20] H. Ochoa, A. H. Castro Neto, and F. Guinea, Phys. Rev.
Lett.108, 206808 (2012).
[21] M. Diez and G. Burkard,Phys. Rev. B85, 195412 (2012).
[22] L. Wang and M. W. Wu, Phys. Rev. B 87, 205416 (2013).
[23] D. V. Fedorov, M. Gradhand, S. Ostanin, I. V. Maznichenko, A. Ernst, J. Fabian, and I. Mertig,Phys. Rev. Lett. 110, 156602 (2013).
[24] D. V. Tuan, F. Ortmann, D. Soriano, S. O. Valenzuela, and S. Roche,Nat. Phys.10, 857 (2014).
[25] R. J. Elliott,Phys. Rev. 96, 266 (1954).
[26] Y. Yafet,Solid State Physics(Academic Press, New York, 1963), Vol. 14, pp. 1–98.
[27] M. Dyakonov and V. Perel, Sov. Phys. Solid State13, 3023 (1972).
[28] M. Gmitra, S. Konschuh, C. Ertler, C. Ambrosch-Draxl, and J. Fabian,Phys. Rev. B80, 235431 (2009).
[29] D. Kochan, M. Gmitra, and J. Fabian,Phys. Rev. Lett.112, 116602 (2014).
[30] D. Soriano, D. V. Tuan, S. M.-M. Dubois, M. Gmitra, A. W.
Cummings, D. Kochan, F. Ortmann, J.-C. Charlier, J.
Fabian, and S. Roche,2D Mater.2, 022002 (2015).
[31] E. J. Duplock, M. Scheffler, and P. J. D. Lindan,Phys. Rev.
Lett.92, 225502 (2004).
[32] O. Yazyev,Rep. Prog. Phys.73, 056501 (2010).
[33] E. J. G. Santos, A. Ayuela, and D. Sánchez-Portal,New J.
Phys.14, 043022 (2012).
[34] K. M. McCreary, A. G. Swartz, W. Han, J. Fabian, and R. K.
Kawakami,Phys. Rev. Lett.109, 186604 (2012).
[35] B. Birkner, D. Pachniowski, A. Sandner, M. Ostler, T.
Seyller, J. Fabian, M. Ciorga, D. Weiss, and J. Eroms,Phys.
Rev. B87, 081405 (2013).
[36] R. R. Nair, M. Sepioni, I. Tsai, O. Lehtinen, J. Keinonen, A. V. Krasheninnikov, T. Thomson, A. K. Geim, and I. V.
Grigorieva,Nat. Phys.8, 199 (2012).
[37] A. A. Kozikov, D. W. Horsell, E. McCann, and V. I. Fal’ko, Phys. Rev. B86, 045436 (2012).
[38] M. B. Lundeberg, R. Yang, J. Renard, and J. A. Folk,Phys.
Rev. Lett.110, 156601 (2013).
[39] J. Fabian and S. Das Sarma, Phys. Rev. Lett. 81, 5624 (1998).
[40] S. Konschuh, M. Gmitra, D. Kochan, and J. Fabian,Phys.
Rev. B85, 115423 (2012).
[41] L. G. Johnson and G. Dresselhaus,Phys. Rev. B 7, 2275 (1973).
[42] E. McCann and M. Koshino,Rep. Prog. Phys.76, 056503 (2013).
[43] See Supplemental Material at http://link.aps.org/
supplemental/10.1103/PhysRevLett.115.196601 for first principles methods and analytical model calculations, which includes Refs. [44–47].
[44] J. P. Perdew, K. Burke, and M. Ernzerhof,Phys. Rev. Lett.
77, 3865 (1996).
[45] S. Grimme,J. Comput. Chem.27, 1787 (2006).
[46] V. Barone, M. Casarin, D. Forrer, M. Pavone, M. Sambi, and A. Vittadini,J. Comput. Chem.30, 934 (2009).
[47] D. Vanderbilt,Phys. Rev. B41, 7892 (1990).
[48] P. Giannozziet al., J. Phys. Condens. Matter21, 395502 (2009).
[49] M. Moaied, J. V. Alvarez, and J. J. Palacios,Phys. Rev. B 90, 115441 (2014).
[50] E. V. Castro, M. P. Lopez-Sancho, and M. A. H. Vozmediano, Phys. Rev. Lett.104, 036802 (2010).
[51] ForjEj≳t1≃0.34eV or carrier concentrationjnj≳2.4× 1013=cm2both low and high energy bands are occupied, and interband transitions are also allowed.
[52] K. Zou and J. Zhu,Phys. Rev. B82, 081407 (2010).