arXiv:1301.0434v2 [hep-ex] 22 Jan 2013
Results for φ 1 and φ 2 from Belle
Pit Vanhoefer
Max-Plank-Institut f¨ ur Physik F¨ oringer Ring 6
M¨ unchen 80805 GERMANY
We present a summary of measurements sensitive to the CKM angles φ 1 and φ 2 , performed by the Belle experiment using the final data sam- ple of 772 × 10 6 BB pairs at the Υ(4S) resonance produced at the KEK asymmetric e + e − collider. We discuss CP asymmetries from the decays B 0 → ccK 0 , D (∗)+ D (∗)− which are sensitive to φ 1 and from B → π + π − , a 1 ± π ∓ being sensitive to φ 2 . Furthermore the measurement of the branch- ing fraction of B 0 → ρ 0 ρ 0 decays and fraction of longitudinal polarization in this decay is presented and used to constrain φ 2 with an isospin analysis in the B → ρρ system.
PRESENTED AT
CKM2012, the 7th International Workshop on the CKM Unitarity Triangle
Cincinnati, USA, 6-10 September 2012
1 Introduction
One major precision test of the Standard Model (SM) is to validate the Cabibbo- Kobayashi-Maskawa (CKM) mechanism for violation of the combined charge-parity (CP ) symmetry [1, 2]. This is one of the main purposes of the Belle experiment at KEK which has significantly contributed proving the CKM scheme and constraining the unitarity triangle for B decays to its current precision. Any deviation from unitarity would be a clear hint for physics beyond the SM. These proceedings give a summary of the experimental status of measurements of the CKM angles φ 1 and φ 2 defined from the CKM matrix elements as φ 1 ≡ π − arg( − V td V tb ∗ )/(V cd V cb ∗ ) and φ 2 ≡ arg( − V td V tb ∗ )/(V ud V ub ∗ ).
The CKM angles can be determined by measuring the time-dependent asymmetry between B 0 and B 0 decays into a common CP eigenstate [3]. In the decay sequence, Υ(4S) → B CP B Tag → f CP f Tag , where one of the B mesons decays into a CP eigen- state f CP at a time t CP and the other decays into a flavour specific final state f Tag at a time t Tag , the time-dependent decay rate is given by
P (∆t, q) = e −|∆t|/τ
B04τ B
01 + q(A CP cos ∆m d ∆t + S CP sin ∆m d ∆t)
, (1)
where ∆t ≡ t CP − t Tag , ∆m d is the mass difference between the mass eigenstates B H
and B L and q = +1( − 1) for B Tag = B 0 (B 0 ). The CP asymmetry is given by N(B → f CP ) − N (B → f CP )
N (B → f CP ) + N (B → f CP ) , (2) where N (B(B) → f CP ) is the number of events of a B(B) decaying to f CP , the asymmetry can be time-dependent. The parameters A CP and S CP describe direct and mixing-induced CP violation, respectively ∗ . All measurements presented here are based on Belle’s final data set of 772 × 10 6 BB pairs.
2 The Angle φ 1
First-order (tree) weak processes proceeding via b → c quark transitions such as B 0 → (cc)K 0 , D (∗)+ D (∗)− , are directly sensitive to the angle φ 1 , which is the CKM angle currently measured with the smallest experimental uncertainty.
2.1 The Decay Channels B 0 → (cc)K 0
The decays B 0 → (cc)K 0 , including the so-called ‘golden channel’ B 0 → J/ψK S 0 , provide a theoretically and experimentally very clean environment to extract φ 1 .
∗
There exists an alternate notation where C
C P= − A
C P.
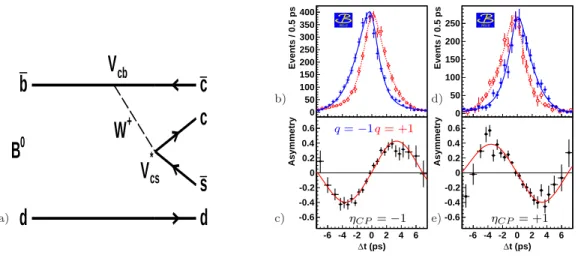
Since possible additional contributions to the leading order tree diagram, see Fig. 1 a), are negligible or even carry the same weak phase [4], the measured CP asymmetry S CP = η CP sin(2φ 1 ) reveals an unpolluted value of φ 1 , with the decay channel’s CP eigenvalue η CP . The combined measurement of CP violation in the golden channel and B 0 → ψ(2S)K S 0 , B 0 → χ c K S 0 , and B 0 → J/ψK L 0 provide currently the world’s most precise value of sin(2φ 1 ) = 0.667 ± 0.023 (stat) ± 0.012 (syst) [5], as shown in Fig. 1. No direct CP violation was observed, A CP = 0.006 ± 0.016 (stat) ± 0.012 (syst), as predicted by the SM [6].
b
d
c c s d V cb
*
V cs
W +
B 0
a)
-6 -4 -2 0 2 4 6
Events / 0.5 ps
0 50 100 150 200 250 300 350 400
t (ps)
∆
-6 -4 -2 0 2 4 6
Asymmetry
-0.6 -0.4 -0.2 0 0.2 0.4
0.6 -6 -4 -2 0 2 4 6
Events / 0.5 ps
0 50 100 150 200 250
t (ps)
∆
-6 -4 -2 0 2 4 6
Asymmetry
-0.6 -0.4 -0.2 0 0.2 0.4 0.6
b)
c)
d)
e)
BELLE BELLE
q = −1q = +1
η
CP= −1 η
CP= +1
Figure 1: a) leading-order process of B 0 → (cc)K 0 decays. b) and d) ∆t distributions with the fit result on top. c) and e) time-dependent CP asymmetries. b) and c) show the CP -odd states and d) and e) show the CP -even state B 0 → J/ψK L 0 . Mixing- induced CP violation can be clearly seen in the asymmetry plots and no height difference in the ∆t distributions indicates no direct CP violation.
2.2 The Decays Channels B 0 → D ( ∗ )+ D ( ∗ ) −
The decays B 0 → D (∗)+ D (∗)− are also sensitive to φ 1 , however additional contribu- tions from loop (penguin) processes make a pollution of the measured observables possible. Hence also direct CP violation can occur. Compared to the previous Belle measurement, the updated result of B 0 → D + D − decays benefits from a better con- tinuum suppression due to the use of neural-networks. The CP asymmetries obtained are S CP = 1.06 +0.21 −0.14 (stat) ± 0.08 (syst) and A CP = 0.43 ± 0.16 (stat) ± 0.05 (syst) [7]
and are in good agreement with the results from Babar [8]. The pseudo-scalar to
vector scalar decay B 0 → D ∗± D ∓ is a decay into a non CP -eigenstate. One therefore
has to consider four flavor charge combinations and the time-dependent decay rate in
Eq. 1 has to be expanded to five CP parameters [9, 10]. The indirect CP asymmetry
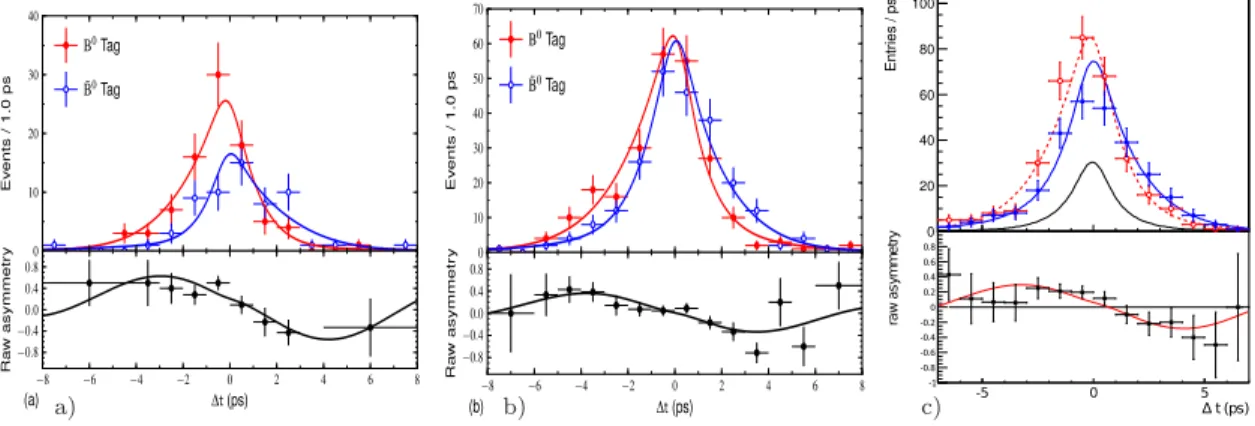
obtained is S CP = − 0.78 ± 0.15 (stat) ± 0.05 (syst), no direct CP violation has been observed [7]. B 0 → D ∗+ D ∗− is a pseudo-scalar to vector vector decay and therefore composed of CP even and odd components. An angular analysis in the transversity basis is performed to separate the different CP states. The fraction of CP -odd states is found to be R ⊥ = 0.138 ± 0.024 (stat) ± 0.006 (syst) and a first observation of mixing- induced CP violation has been reported; S CP = − 0.79 ± 0.13 (stat) ± 0.03 (syst), A CP = 0.15 ± 0.08 (stat) ± 0.04 (syst) [11]. The ∆t distributions and CP asymmetries for each mode are shown in Fig. 2.
0 10 20 30 40
Events/1.0ps
B0Tag B¯0Tag
−8 −6 −4 −2 0 2 4 6 8
∆t(ps) 0.8
0 .4 0.0
−0 .4
−0.8
Rawasymmetry
(a)
0 10 20 30 40 50 60 70
Events/1.0ps
B0Tag
¯B0Tag
−8 −6 −4 −2 0 2 4 6 8
∆t(ps) 0.8
0.4 0.0
−0 .4
−0 .8
Rawasymmetry
(b)
raw asymmetry
-1 -0.8 -0.6 -0.4 -0.2 0 0.2 0.4 0.6 0.8
t (ps)
∆
-5 0 5
Entries / ps
0 20 40 60 80 100
a) b) c)
Figure 2: ∆t distributions for each flavour tag and the CP asymmetries, each with the fit result on top. a) B 0 → D + D − , b) B 0 → D ∗± D ∓ and c) B 0 → D ∗+ D ∗− .
3 φ 2
Decays proceeding via b → uud quark transitions such as B 0 → ππ, ρπ, ρρ and a 1 (1260)π, are directly sensitive to φ 2 . At tree level we expect A CP = 0 and S CP = sin 2φ 2 . Again, possible penguin contributions can give rise of direct CP violation, A CP 6 = 0 and also pollute the measurement of φ 2 , S CP = q 1 − A 2 CP sin(2φ ef f 2 ) where the observed φ ef f 2 ≡ φ 2 − ∆φ 2 is shifted by ∆φ 2 due to different weak phases from additional non-leading contributions.
Despite this, it is possible to determine ∆φ 2 in B 0 → h + h − with an SU (2) isospin analysis by considering the set of three B → hh decays where the hhs are either two pions or two longitudinally polarized ρs, related via isospin symmetry [12]. The B → hh amplitudes obey the triangle relations,
A +0 = 1
√ 2 A +− + A 00 , A −0 = 1
√ 2 A +− + A 00 . (3)
Isospin arguments demonstrate that B + → h + h 0 is a pure first-order mode in the limit
of neglecting electroweak penguins, thus these triangles share the same base, A +0 =
A −0 . ∆φ 2 can then be determined from the difference between the two triangles. This method has an inherent 8-fold discrete ambiguity in the determination of φ 2 .
4 The Decay B → ππ
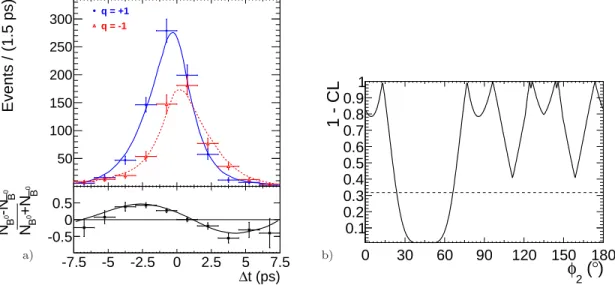
Preliminary results of the CP parameters in this pseudo-scalar to scalar scalar decay yield S CP = − 0.636 ± 0.082 (stat) ± 0.027 (syst) and A CP = 0.328 ± 0.061 (stat) ± 0.027 (syst). The ∆t distributions and the resulting CP asymmetry are shown in Fig. 3 a). Belle excludes the range φ 2 ∈ / [23.8 ◦ , 66.8 ◦ ] at the 1σ level by performing an isospin analysis to remove the penguin contribution, see Fig. 3 b). The amount of direct CP violation was found to be smaller compared to the previous measurement at Belle [13]. The previous result was confirmed with the previous data set of 535 × 10 6 BB pairs. The updated CP asymmetries are in better agreement with other experiments [14].
Events / (1.5 ps)
50 100 150 200 250
300
q = +1q = -1t (ps) -7.5 -5 -2.5 0 2.5 ∆ 5 7.5
0 B
+N
0BN
0 B
-N
0BN -0.5 0
0.5
° )
2 (
0 30 60 90 120 150 φ 180
1 - CL
0.1 0.2 0.3 0.4 0.5 0.6 0.7 0.8 0.9 1
a) b)
Figure 3: a) ∆t distribution for each flavour tag and the fit result on top and the
resulting CP asymmetry for B 0 → π + π − . Mixing-induced CP violation can be
clearly seen in the asymmetry plots and the height difference in the ∆t projection
indicates direct CP violation. b) scan of φ 2 from an isospin analysis in the B → ππ
system, the dashed line corresponds to the one σ level.
5 The Decay B 0 → ρ 0 ρ 0
The presence of multiple, largely unknown backgrounds with the same four charged pions final state as B 0 → ρ 0 ρ 0 make this rare decay quite difficult to isolate. In- terference between the various 4π modes need to be considered. Having a decay into two vector particles, an angular analysis has to be performed, similar to the decay B 0 → D ∗+ D ∗− . As for B 0 → ρ + ρ − [15, 16, 17], the decay B → ρρ is naively expected to be polarized dominantly longitudinally. However, color-suppressed B decays into light vectors are especially difficult to predict [18]. Besides updating to the full data set, a helicity angle cos Θ H for each ρ 0 is added to the fit. The angles, defined in the helicity basis, are powerful in separating the different back- grounds and allow one to measure the fraction f L of longitudinal (purely CP -even) polarization in B → ρρ decays. As a preliminary result, Belle obtains B (B 0 → ρ 0 ρ 0 ) = (1.02 ± 0.30 (stat) ± 0.22 (syst)) × 10 −6 with a fraction of longitudinal po- larization, f L = 0.21 +0.18 −0.22 (stat) ± 0.11 (syst). Having a significance of 2.9 standard deviations, an upper limit of B (B 0 → ρ 0 ρ 0 ) < 1.5 × 10 −6 at the 90% CL is pro- vided [19]. Since this mode is currently statistically (and systematically) limited and is found to decay dominantly into transversally polarized ρ 0 s (CP -even and odd), a measurement of the CP asymmetries has not been performed. However, the size of the amplitude of the decays into longitudinally polarized ρ 0 s from this measurement has been used in an isospin analysis together with world averages of B 0 → ρ + ρ − and B + → ρ + ρ 0 decays [20] (longitudinal polarization only). The resulting constraint consistent with the SM value is φ 2 = (91.0 ± 7.2) ◦ . The relatively small amplitude of B 0 → ρ 0 ρ 0 makes the isospin analysis in the B → ρρ less ambiguous. In addition, Belle reported the first evidence of B 0 → f 0 ρ 0 decays with a sigificance of 3.0 σ;
B (B 0 → f 0 ρ 0 ) = (0.86 ± 0.27 (stat) ± 0.15 (syst)) × 10 −6 . Distributions of the differ- ence of energy of the reconstructed signal B to the beam energy, ∆E and one of the helicty angles, each with the fit result on top, are shown in Fig. 4 together with the φ 2 scan from the isospin analysis.
Comparing these results with the ones obtained by BaBar, we find good agree-
ment in the branching fraction of B 0 → ρ 0 ρ 0 decays, while there is a 2.1σ discrep-
ancy in the fraction of longitudinal polarization; BaBar finds f L = 0.75 +0.11 −0.14 (stat) ±
0.04 (syst) [21]. Also the branching fraction of B 0 → f 0 ρ 0 decays is significantly
higher then the upper limit provided by BabBar; B (B 0 → f 0 ρ 0 ) < 0.34 × 10 −6 . Thus,
further studies at higher statistics would be very interesting and hopefully will solve
these tensions.
Events / (0.01)
50 100 150 200 250
E [GeV]
∆
-0.1 -0.05 0 0.05 0.1
ResidualsNormalised
-4 -2 0 2 4
Events / (0.1)
20 40 60 80 100
)
1Θ
H-1 -0.5 0 0.5 cos( 1
ResidualsNormalised
-4 -2 0 2 4
° )
2
(
0 30 60 90 120 150φ
1801 - CL
0 0.1 0.2 0.3 0.4 0.5 0.6 0.7 0.8 0.9 1
a) b) c)
Figure 4: Distributions of a) ∆E and b) cos Θ H with the fit result on top. The shaded red area and the long dashed orange histogram are the B 0 → ρ 0 ρ 0 and f 0 ρ 0 contributions, respectively. Furthermore, all four pion final states are shown in dashed cyan, the entire (BB) background in dashed green (dark green) and the full PDF in blue. c) scan of φ 2 from an isospin analysis in the B → ρρ system, the dashed line corresponds to the one σ level.
6 The Decay B 0 → a 1 (1260) ± π ∓
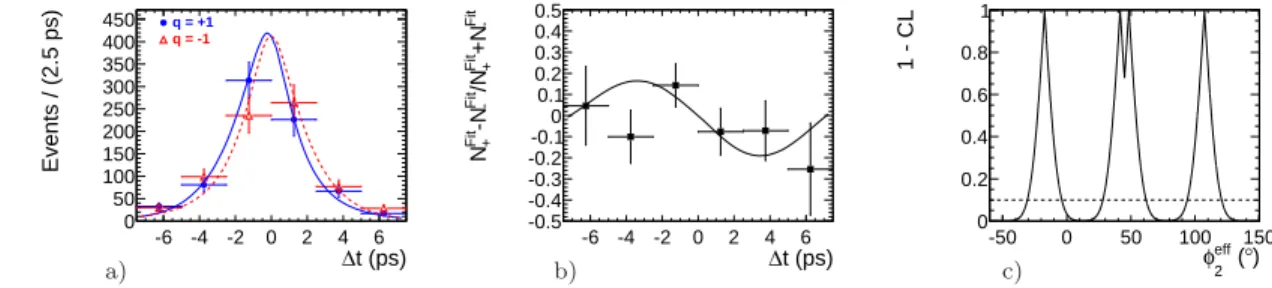
B 0 → a 1 (1260) ± π ∓ is another decay with a four charged pion final state sensitive to φ 2 , but is similiar to B 0 → D ∗± D ± , a decay into a non-CP eigenstate. Belle reported the first evidence of mixing induced CP violation in this mode with 3.1σ;
S CP = − 0.51 ± 0.14 (stat) ± (0.08) [22]. The amount of penguin pollution can in general be estimated by using SU (3) symmetry [23] but would need more input data. Therefore a scan of an effective angle φ ef f 2 has been presented, giving a fourfold solution for φ ef f 2 ∈ [ − 25.5 ◦ , − 9.1 ◦ ], [34.7 ◦ , 55.3 ◦ ] and [99.1 ◦ , 115.5 ◦ ], where the 2 nd interval contains two overlapping solutions. The scan (c) is shown together with the
∆t distribution (a) and the CP asymmetry (b) in Fig. 5:
t (ps)
-6 -4 -2 0 2 4∆
6Events / (2.5 ps)
0 50 100 150 200 250 300 350 400
450 q = +1
q = -1
t (ps)
-6 -4 -2 0 2 4∆
6 -Fit+N
+Fit/N
-Fit-N
+FitN
-0.5 -0.4 -0.3 -0.2 -0.1 0 0.1 0.2 0.3 0.4 0.5
° )
eff
( φ
2-50 0 50 100 150
1 - CL
0 0.2 0.4 0.6 0.8 1