Application of novel instrumental analytical approaches for the characterization of surface related phenomena in the
context of automotive manufacturing
Dissertation
zur Erlangung des Doktorgrades der Naturwissenschaften (Dr. rer. nat.)
der Fakultät für Chemie und Pharmazie der Universität Regensburg
vorgelegt von Stefan Viehbeck
aus Dingolfing
Die vorgelegte Dissertation entstand im Zeitraum von November 2014 bis Oktober 2018 in Kooperation des Instituts für Analytische Chemie, Chemo- und Biosensorik der naturwis- senschaftlichen Fakultät IV - der Universität Regensburg
und
der Technologie Werkstoff und Verfahrensanalytik der BMW AG.
Die Arbeit wurde angeleitet von: Prof. Dr. habil. Frank-Michael Matysik Das Promotionsgesuch wurde am 16.10.2018 eingereicht.
Das Kolloquium fand am 17.12.2018 statt.
Vorsitz des Prüfungsausschusses übernahm Prof. Dr. Robert Wolf. Erstgutachter war Prof. Dr. Frank-Michael Matysik, Zweitgutachter war Herr Prof. Dr. Rudolf Bierl und Drittprüfer war PD Dr. Hans-Heiner Gorris.
-„Scientia nihil aliud est quam veritatis imago“-
„Die Wissenschaft ist nichts als das Abbild der Wahrheit.“
Francis Bacon, 1561-1626
Table of contents
Table of contents
Table of contents... I List of publications ... IV Conference contributions ... VII Declaration of collaboration ... VIII List of abbreviations ... IX
Graphical Abstract ... 1
Introduction ... 2
1 Theory... 7
1.1 Materials... 7
1.1.1 Carbon Fiber Reinforced Plastics... 7
1.1.2 Adhesives ... 11
1.1.3 References ... 13
1.2 Analytical techniques... 14
1.2.1 Atomic Force Microscopy ... 14
1.2.2 Chemical Force Microscopy... 20
1.2.3 X-ray photolectron spectroscopy... 21
1.2.4 DART-Q-ToF-MS ... 23
1.2.5 References ... 26
1.3 Mechanical tests ... 30
1.3.1 Tensile-shear-test ... 30
1.3.2 Peel-test ... 31
1.3.3 References ... 32
2 Experimental ... 33
2.1 Chemicals and materials ... 33
Table of contents
3 Results&Discussion ... 35
3.1 Analytical approach for the formulation of a reference adhesive system ... 35
3.1.1 Introduction ... 35
3.1.2 Experimental Procedure ... 35
3.1.3 Results & Discussion... 38
3.1.4 Conclusion ... 39
3.1.5 References ... 39
3.2 Evaluation of industrial samples with various surface characterization tech- niques ... 40
3.2.1 Introduction ... 40
3.2.2 Application of direct analysis in real time (DART) and direct inlet probe (DIP-APCI) mass spectrometry in the context of industrial sample analysis ... 41
3.2.3 AFM ... 51
3.2.4 XPS... 55
3.2.5 References ... 58
3.3 Method development for self-assembled monolayer functionalization of atomic force microscope cantilevers ... 62
3.3.1 Introduction ... 62
3.3.2 Experimental Procedure ... 62
3.3.3 Results & Discussion... 64
3.3.4 Conclusion ... 66
3.3.5 References ... 67
3.4 Complementary analytical imaging techniques for the characterization of pretreated carbon fiber reinforced plastics ... 68
3.4.1 Graphical Abstract... 68
3.4.2 Abstract ... 68
3.4.3 Introduction ... 69
3.4.4 Experimental Procedure ... 71
3.4.5 Results & Discussion... 73
3.4.6 Conclusion ... 82
3.4.7 Appendix... 83
3.4.8 References ... 84
Table of contents
3.5 Characterization of environmental aging effects on industrial carbon fiber
reinforced plastic building parts ... 87
3.5.1 Introduction ... 87
3.5.2 Experimental Procedure ... 87
3.5.3 Results & Discussion... 87
3.5.4 Conclusion ... 92
3.5.5 References ... 93
3.6 Evaluation of an industrial approach for improving a surface protecting cavity wax with a combination of different analytical techniques ... 94
3.6.1 Introduction ... 94
3.6.2 Experimental Procedure ... 96
3.6.3 Results & Discussion... 99
3.6.4 Conclusion ... 102
3.6.5 References ... 103
3.7 Verifaction of urea as aldehyde diminishing component in a newly formu- lated industrial cavity wax ... 104
3.7.1 Introduction ... 104
3.7.2 Experimental Procedure ... 105
3.7.3 Results & Discussion... 105
3.7.4 Conclusion ... 106
3.7.5 References ... 106
4 Summary ... 107
5 Zusammenfassung in deutscher Sprache ... 109
6 List of Figures... 111
List of publications
List of publications
Peer reviewed articles
Application of direct analysis in real time (DART) and direct inlet probe (DIP-APCI) mass spectrometry in the context of industrial sample analysis
Stefan Viehbeck and Frank-Michael Matysik
Monatshefte für Chemie - Chemical Monthly (2016) 147:1349-1352
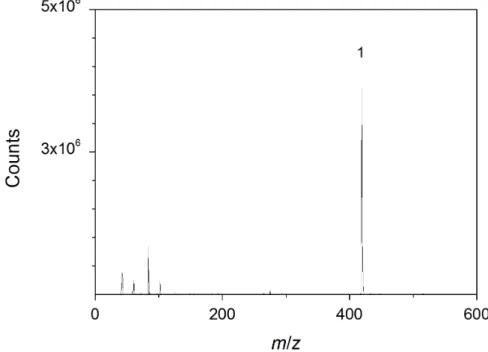
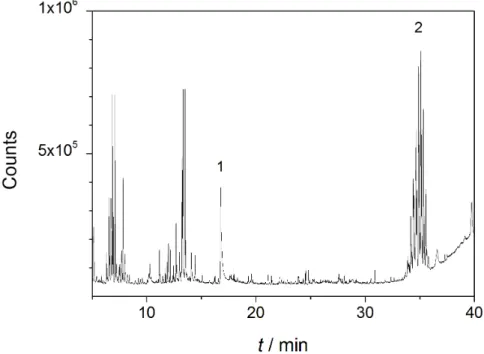
Abstract In today0s industry, quick and reliable analytical methods play an important role for quality control. On that account, two emerging techniques, namely direct inlet probe-atmospheric pressure chemical ionization (DIP-APCI) and direct analysis in real time (DART) mass spectrometry, are particularly promising. In case of a DIP-APCI source, small amounts of solid or liquid samples can be studied without sample pre-treatment.
A similar system is the DART ion source. In addition to the analysis of solid and liquid samples without preseparation, this ion source offers the possibility to scan the surface of a sample. A method for industrial sample analysis focusing on the study of delamination of coatings from a panel was developed using DIP-APCI-Q-ToF-MS and DART-Q-ToF-MS, respectively. Comparative studies based on the conventional pyrolysis-GC-MS were car- ried out.
Complementary analytical imaging techniques for the characterization of pretreated carbon fiber reinforced plastics
Stefan Viehbeck, Christian Iffelsberger and Frank-Michael Matysik Composites Part A: Applied Science and Manufacturing (2018) 113:32-39
Abstract In this work the complementary characterization of pretreatment techniques for adhesive bonding of carbon fiber reinforced plastics (CFRP) is presented. Industrial CFRP plates were pretreated with laser, plasma and corundum blasting abrasive tech- niques followed by chemical activation. The combined use of atomic force microscopy
List of publications
pretreated surfaces simulating the adhesive bond. Complementary measurements with scanning electrochemical microscopy and X-ray photoelectron spectroscopy supported the experimental findings and delivered additional information about the chemical structure of the surfaces. A comparison of experimental data of mechanical tensile shear strength measurements and the applied analytical methods revealed a valid correlation of micro- scopic and macroscopic techniques.
Corrosion protection agent and method for the preservation of a cavity
Stefan Viehbeck, Günther Mayer, Johann Troffer, BMW AG European Patent: EP3344708, published 11.07.2018
AbstractDie vorliegende Erfindung betrifft ein Korrosionsschutzmittel, das insbesondere in der Hohlraumkonservierung Anwendung findet, also in Hohlräumen, wie sie z.B. in Fahrzeugkarosserien vorzufinden sind. Darüber hinaus betrifft die vorliegende Erfindung auch ein Verfahren zum Konservieren eines Hohlraumes.
Hohlraumkonservierungen sind insbesondere aus dem Fahrzeugbau bekannt und bieten nach Applikation, beispielsweise auf ein metallisches Element, einen guten Schutz vor Korrosion, durch auf das metallische Element einwirkendes Wasser oder eine feuchtigkeits- haltige Umgebung. Übliche Hohlraumkonservierungsmittel enthalten Wachse oder Harze sowie Korrosionsschutzadditive, die durch Dispergieren in Lösungsmitteln applizierfähig gemacht werden. Nach dem Abtrocknen, Härten und ggf. Vernetzen des Hohlraumkon- servierungsmittels bildet das Hohlraumkonservierungsmittel auf der applizierten Ober- fläche einen vor Korrosion schützenden Film. Nachteilig an herkömmlichen Hohlraumkon- servierungsmitteln ist, dass sie eine lange Trocknungs- bzw. Vernetzungsdauer und oftmals eine nicht vollständige Durchtrocknung zeigen. Dies erhöht die Verfahrenskosten für die Konservierung und erfordert oftmals eine manuelle Nachbehandlung zur Entfernung von Resten der Hohlraumkonservierung.
Ausgehend von diesem Stand der Technik ist es Aufgabe der vorliegenden Erfindung, ein Korrosionsschutzmittel bereitzustellen, das sich durch eine hohe, und gezielt steuer- bare Trocknungs- bzw. Härtungsrate und Vernetzung auszeichnet. Darüber hinaus ist es
List of publications
und durch dessen Anwendung ohne aufwendige Nacharbeit ein gleichmäßiger Korrosions- schutzfilm erhalten werden kann.
Corrosion inhibitors
Stefan Viehbeck, Günther Mayer, Johann Troffer, BMW AG German Patent: DE102016210913A1, application 2017-12-21
AbstractDie vorliegende Erfindung betrifft ein Korrosionsschutzmittel, das insbesondere in der Hohlraumkonservierung Anwendung findet, also in Hohlräumen, wie sie beispiel- sweise in Fahrzeugkarosserien vorzufinden sind. Hohlraumkonservierungen sind ins- besondere aus dem Fahrzeugbau bekannt und bieten nach Applikation, beispielsweise auf ein metallisches Element, einen guten Schutz vor Korrosion wenn auf dieses metallische Element Wasser oder eine feuchtigkeitshaltige Umgebung einwirkt. Übliche Hohlraumkon- servierungen enthalten Wachse, Fette, Öle oder Harze, sowie Korrosionsschutzadditive, die durch Dispergieren in Lösungsmitteln applizierfähig gemacht werden. Gerade die ver- wendeten Wachse, Fette oder Öle werden z.B. durch oxidative Härtung haftend gemacht.
Hierbei entstehen Aldehyde als Spaltprodukte. Aufgrund der gesundheitsschädigenden und geruchsbeeinträchtigenden Wirkung der Aldehyde wären Korrosionsschutzmittel, die eine Freisetzung von Aldehyden verhindern oder zumindest reduzieren, von Vorteil. Aus- gehend von diesem Stand der Technik ist es somit Aufgabe der vorliegenden Erfindung, ein Korrosionsschutzmittel bereitzustellen, das sich durch eine niedrige Freisetzungsrate von Aldehyden auszeichnet und daher anwendungssicher, gesundheitsunbedenklich sowie geruchsoptimiert ist.
Conference contributions
Conference contributions
Oral presentations
ANAKON 2017, 3.-6.4.2017, Tübingen
Analytical characterization of lightweight car parts with chemical force microscopy and DART-Q-TOF-MS
Stefan Viehbeck and Frank-Michael Matysik
Modern analytical chemistry 2015, 22.-23.09.2015 Prague
Comparison of two direct ion sources coupled to a MS system (DART-MS and DIP-MS) Stefan Viehbeck and Frank-Michael Matysik
XPS User Meeting 2018, 14.-17.05.2018 Eibelstadt
Industrial application of XPS at an automotive company Stefan Viehbeck
Poster presentations
ANAKON 2015, 23.-26.3 2015, Graz, Austria
Comparison of two direct ion sources coupled to a MS system (DART-MS and DIP-MS) Stefan Viehbeck and Frank-Michael Matysik
Declaration of collaboration
Declaration of collaboration
Most of the theoretical and experimental work presented in this thesis was carried out solely by the author. In some cases, however, the practical implementation of concepts and the performance of measurements were carried out in collaboration with other researchers and individuals. In accordance with § 8 Abs. 1 Satz 7 of the Ordnung zum Erwerb des akademischen Grades eines Doktors der Naturwissenschaften (Dr. rer. nat.) an der Univer- sität Regensburg vom 18. Juni 2009 (Änderungssatzung vom 6. Februar 2014), this section details the nature of these collaborations. This list is sorted according the sections of this thesis.
3.4 Complementary analytical imaging techniques for the characterization of pretreated carbon fiber reinforced plastics
Experimental work regarding SECM was done in collaboration with Christian Iffelsberger at the facilities of University Regensburg. Further measurements and experiments such as AFM, CFM, XPS, macroscopic tests and optical microscopy were done solely by the author.
The authors contributed equally for interpretation and writing. The research was done under supervision and guidance of Prof. Dr. Frank-Michael Matysik.
3.6 Evaluation of an industrial approach for improving a surface protecting cavity wax with a combination of different analytical techniques
The experimental work was done in collaboration with Günther Mayer. Both authors contributed equally to the experimantal work and novelty of the invention. The research was done under supervision of Johann Troffer, Christian Lang and Prof. Dr. Frank-Michael Matysik.
3.7 Verifaction of urea as aldehyde diminishing component in a newly formulated in- dustrial cavity wax
The experimental work was done in collaboration with Günther Mayer. Both authors contributed equally to the experimantal work and novelty of the invention. The research was done under supervision of Johann Troffer, Christian Lang and Prof. Dr. Frank-Michael
List of abbreviations
List of abbreviations
AFM Atomic force microscopy CFRP Carbon fiber reinforced plastic DART Direct analysis in real time
DFCM Dynamic fluid compression molding
DIP-APCI Direct inlet probe - Atmospheric pressure ionization
ESCA Electron spectroscopy for chemical analysis, synonymous for XPS FT-IR Fourier-transform infrared Spectroscopy
GC Gas chromatography
HPLC High performance liquid chromatography PAN Polyacrylonitrile
PUR Polyurethane
Q-ToF-MS Quadrupole Time-of-flight mass spectrometry RTM Resin transfer molding
SECM Scanning electrochemical microscopy XPS X-ray photoelectron spectroscopy
Graphical Abstract
analytics composites lightweight
i nstrumental failure analysis
fibers
wet compression resin transfer
molding process DFCMepoxy resin
RTM
adhesive
surface characterization
Direct Analysis in Realtime Direct Inlet Probe
chromatography
X-ray Photoelectron Spectroscopy
Tensile shearstrength
plasma pretreatment topography
mapping
Microscopy
FTIR REM
SAM
wax
Introduction
Chemical analysis plays a major role in today’s society. With high demands on quality[1][2], increasing regulations[3], health issues[4] and environmental pollution[5][6][7], chemical analysis was implemented as a crucial supporting pillar in the identification and evalua- tion of the aforementioned issues. Besides applications in well known branches, such as food[8][9][10] or the pharmacy industry[11][12], other industries have a high demand for quality and quality control. Leading companies in the premium sector of the automotive industry have an especially high quality requirement[13][14][5]. This has been a consider- able challenge for analytical research with ever-increasing numbers of products[15][16][17].
It is enormously important to have fast and reliable analytical techniques to handle com- plex problem definitions, in addition to routine analysis. The task, however, gets more complex with the increasing diversity of materials installed in modern vehicles. Simple metal or plastic components may have unexpected behavior, due to the production process, adhesives or coatings, which may contribute to detechments and materials which lead to increased pollutant emission[18]. Even newly developed materials, such as fuel cells[19], battery technology[20] or composites[21] must have composition and functionality verified.
Thus, analysis and quality control are essential parts of the remediation, verification and identification of issues in the development and manufacturing process. As a result, the automotive industry is increasingly focused on analytical techniques of a broad range of materials with a focus on surface characterization. Typically, a laboratory is equipped with techniques from all fields of analysis. An important field is liquid and gas chromatography coupled with mass spectrometry for the analysis of materials and textiles, additives and coatings. Inductively coupled plasma - optical emission spectrometry (ICP-OES), or ion chromatography (IC), and fourier-transform infrared spectroscopy (FT-IR) are also used for the quality control of materials. Material evaluations of physical parameters are typically done with mechanical tests, such as tensile strength, peel tests or rheology measurements.
Introduction
With a broad selection of available analytical techniques, it is important to focus on the expedient methods and implement techniques that are complimentary to the correspond- ing task. It is crucial to adopt analytical techniques in industrial production, especially for newly developed materials.
Due to the variety of materials installed in a modern car, the attachment and joining of two substrates is an important factor. For coatings and adhesives, the surface of the material to which each is applied plays a vital role in the manufacturing process. To understand the complex mechanism of adhesion when joining diverse materials, many factors must be considered, such as roughness, technical cleanliness of the surface, as well as chemical interactions and mechanisms (from covalent bonding to weak bound- ary interactions)[22][23][24]. For these delicate mechanisms and interactions, analytical techniques with a high sensitivity and a capacity for detailed surface characterization are required. Thus, new methods, ideally with little sample preparation, must be inves- tigated. Here, the methods that should be taken into account include the field of direct ion sources coupled with mass spectrometry[25], atomic force microscopy[26] and chemi- cal characterization of the outer molecular layer of a surface using X-ray photoelectron spectroscopy[27].
Preliminary studies[28][29] have shown that atomic force microscopy in combination with chemically modified probing tips was promising for the evaluation of adhesion forces and material surfaces. Thus, a large part of this research is focused on the development of an atomic force microscopy (AFM) method for industrial automotive applications, along with an evaluation of the surface quality in composite bonding.
Introduction
References
[1] H. Yichen, K. Weijun, Y. Xihui, X. Liwei, W. Jing, and Y. Meihua, “GC-MS combined with chemometric techniques for the quality control and original discrimination of Curcumae longae rhizome: Analysis of essential oils,”Journal of Separation Science, vol. 37, no. 4, pp. 404–411, 2013.
[2] D. Doutre, B. Gariépy, J. P. Martin, and G. Dubé, “Aluminium Cleanliness Monitoring:
Methods and Applications in Process Development and Quality Control BT - Essential Readings in Light Metals: Volume 3 Cast Shop for Aluminum Production,” pp. 296–
304, Cham: Springer International Publishing, 2016.
[3] K. Ravindra, R. Sokhi, and R. Van Grieken, “Atmospheric polycyclic aromatic hydro- carbons: Source attribution, emission factors and regulation,”Atmospheric Environ- ment, vol. 42, no. 13, pp. 2895–2921, 2008.
[4] A. Le Cigne, L. Chieze, A. Beaussart, S. El-Kirat-Chatel, Y. F. Dufrene, S. Dedieu, C. Schneider, L. Martiny, J. Devy, and M. Molinari, “Analysis of the effect of LRP-1 silencing on the invasive potential of cancer cells by nanomechanical probing and adhesion force measurements using atomic force microscopy,”Nanoscale, vol. 8, no. 13, pp. 7144–7154, 2016.
[5] C. Moschet, I. Wittmer, J. Simovic, M. Junghans, A. Piazzoli, H. Singer, C. Stamm, C. Leu, and J. Hollender, “How a Complete Pesticide Screening Changes the Assess- ment of Surface Water Quality,”Environmental Science & Technology, vol. 48, no. 10, pp. 5423–5432, 2014.
[6] D. Ašperger, V. Tišler, M. Zrnˇci´c, D. Mutavdži´c Pavlovi´c, S. Babi´c, A. J. M. Horvat, and M. Kaštelan-Macan, “HPLC-DAD-FLD Determination of Veterinary Pharmaceu- ticals in Pharmaceutical Industry Wastewater with Precolumn Derivatization Using Fluorescamine,”Chromatographia, vol. 77, no. 15, pp. 1059–1066, 2014.
[7] S. L. Wright and F. J. Kelly, “Plastic and Human Health: A Micro Issue?,”Environmental Science & Technology, vol. 51, no. 12, pp. 6634–6647, 2017.
[8] E. Dorta, M. González, M. G. Lobo, C. Sánchez-Moreno, and B. de Ancos, “Screening of phenolic compounds in by-product extracts from mangoes (Mangifera indica L.)
Introduction
[9] E. Crawford and B. Musselman, “Evaluating a direct swabbing method for screening pesticides on fruit and vegetable surfaces using direct analysis in real time (DART) coupled to an Exactive benchtop orbitrap mass spectrometer,”Analytical and Bioana- lytical Chemistry, vol. 403, no. 10, pp. 2807–2812, 2012.
[10] X. He, J. Li, W. Zhao, R. Liu, L. Zhang, and X. Kong, “Chemical fingerprint analysis for quality control and identification of Ziyang green tea by HPLC,”Food Chemistry, vol. 171, pp. 405–411, 2015.
[11] S. Alipour, A. Mohammadi, and F. Ahmadi, “Captopril fast disintegrating tablets for children: formulation and quality control by HPLC,”Trends in Pharmaceutical Sciences, vol. 3, no. 3, 2017.
[12] M. Petrovi´c, B. Škrbi´c, J. Živanˇcev, L. Ferrando-Climent, and D. Barcelo, “Determina- tion of 81 pharmaceutical drugs by high performance liquid chromatography coupled to mass spectrometry with hybrid triple quadrupole-linear ion trap in different types of water in Serbia,”Science of The Total Environment, vol. 468-469, pp. 415–428, 2014.
[13] A. M. Beale, F. Gao, I. Lezcano-Gonzalez, C. H. F. Peden, and J. Szanyi, “Recent advances in automotive catalysis for NOx emission control by small-pore microporous materials,”Chem. Soc. Rev., vol. 44, no. 20, pp. 7371–7405, 2015.
[14] D. Hoyle, Automotive Quality Systems Handbook. Oxford: Elsevier Butterworth- Heinemann, 2 ed., 2005.
[15] B. D. Agarwal, L. J. Broutman, and K. Chandrashekhara,Analysis and performance of fiber composites. Wiley & Sons, 4 ed., 2018.
[16] Y. Li, J. Yang, and J. Song, “Design principles and energy system scale analysis technologies of new lithium-ion and aluminum-ion batteries for sustainable energy electric vehicles,”Renewable and Sustainable Energy Reviews, vol. 71, pp. 645–651, 2017.
[17] Y. Nakagawa, K.-i. Mori, and T. Maeno, “3D printing of carbon fibre-reinforced plastic parts,”The International Journal of Advanced Manufacturing Technology, vol. 91, no. 5, pp. 2811–2817, 2017.
[18] M. André and M. Rapone, “Analysis and modelling of the pollutant emissions from
Introduction
[19] S. P. Jiang, “Thermally and Electrochemically Induced Electrode/Electrolyte Interfaces in Solid Oxide Fuel Cells: An AFM and EIS Study,” 2015.
[20] M. Metzger, C. Marino, J. Sicklinger, D. Haering, and H. A. Gasteiger, “Anodic Oxidation of Conductive Carbon and Ethylene Carbonate in High-Voltage Li-Ion Batteries Quantified by On-Line Electrochemical Mass Spectrometry,”Journal of The Electrochemical Society, vol. 162, no. 7, pp. A1123–A1134, 2015.
[21] C. Unterweger, J. Duchoslav, D. Stifter, and C. Fürst, “Characterization of carbon fiber surfaces and their impact on the mechanical properties of short carbon fiber reinforced polypropylene composites,” Composites Science and Technology, vol. 108, pp. 41–47, 2015.
[22] A. Baldan, “Adhesion phenomena in bonded joints,”International Journal of Adhesion and Adhesives, vol. 38, pp. 95–116, 2012.
[23] A. V. Pocius,Adhesion and Adhesives Technology: An Introduction. Munich: Carl Hanser Verlag, 3 ed., 2012.
[24] J. Schultz and M. Nardin,Adhesion Promotion Techniques: Technological Applications.
New York: Marcel Dekker Inc., 2002.
[25] R. B. Cody, “Observation of Molecular Ions and Analysis of Nonpolar Compounds with the Direct Analysis in Real Time Ion Source,”Analytical Chemistry, vol. 81, no. 3, pp. 1101–1107, 2009.
[26] G. Binnig and C. F. Quate, “Atomic Force Microscope,”Physical Review Letters, vol. 56, no. 9, pp. 930–933, 1986.
[27] K. Siegbahn and K. Edvarson, “β-Ray spectroscopy in the precision range of 1 : 105,”
Nuclear Physics, vol. 1, no. 8, pp. 137–159, 1956.
[28] C. D. Frisbie, L. F. Rozsnyai, A. Noy, M. S. Wrighton, and C. M. Lieber, “Functional Group Imaging by Chemical Force Microscopy,”Science, vol. 265, no. 5181, pp. 2071–
2074, 1994.
[29] S. Raman, T. Utzig, T. Baimpos, B. Ratna Shrestha, and M. Valtiner, “Deciphering the
1 Theory
1.1 Materials
1.1.1 Carbon Fiber Reinforced Plastics
Carbon fiber composites have unique characteristics, when compared to other building materials of the automotive manufacturing process. The composites have a high ten- sile strength to weight ratio, a low coefficient of linear thermal expansion, high fatigue strengths and high thermal conductivity; all of which provide technical advancements for the automotive industry[1].
The polymeric fibers containing carbon have a diameter of 7 µm, made of polyacrylonitrile (PAN), petroleum, bitumen or cellulose. To manufacture the precursors, liquid monomeric acrylonitrile is first polymerized with co-monomers, such as methacrylic acid. Additional initiators and redox-systems control the polymerization. A typical PAN precursor has a molecular weight of 80000 - 100000 g/mol and 94 - 99 w.% of acrylonatirile with 3000 single acrylonitrile units per PAN molecule. In a spinning process (Fig. 1.1) the fibers are hardened and elongated and the PAN molecules are forced in the direction of the fibers. A spool of several 100 kg is produced as a result, with 1000 - 320000 single fibers in one string. The fabrication of carbon fibers begins with stabilizing the precursor fibers at 200 - 300◦C in air. A carbonation at 1300 - 1500◦C follows under inert conditions, and the graphitization process is completed at 1800◦C. Depending on the application, the surface is electrochemically activated and a finishing treatment is applied before the mechanical parameters can be influenced (shear strength, compatibility to matrix,
Materials Carbon Fiber Reinforced Plastics
Figure 1.1: Industrial manufacturing process of fibers - polymerization, spinning, washing, drying, elongating, spool, adapted from [2]
Apart from the fibers, the matrix system influences the properties of the composite. There are two different types of polymeric matrix systems used - thermoset and thermoplastic polymers. The most common thermosets for carbon composite materials are epoxy resins.
For industrial applications, the high flexibility in mechanical properties through the use of different chemical crosslinking in epoxy polymerization is a notable advantage. Crucial parameters of the matrix include the long-term performance, glass transition temperature, moisture absorption, robustness and stability.[2]
The supply of raw material is very important in the mass production of CFRP; thus, preforms are used in industrial manufacturing. These preorganized textile structures of fibers are already impregnated with resin and stored in stacks. The structure of the layer depends on the particular part. For optically visible parts, a tissue structure is used and for structural components, biaxial or multiaxial textiles are used. In addition to the visual appearance, the physical performance is also influenced by the woven fiber structure.
For more advanced composites, the industry developed preimpregnated reinforcements (also called prepreg). Different manufacturing techniques, such as compression molding, autoclave molding and vacuum bag molding use these semi-finished composite layers.
For the automotive sector, where reproducible and well-defined body parts are crucial to production, two techniques are used: resin transfer molding (RTM) and wet compression
Materials Carbon Fiber Reinforced Plastics
until the last possible moment”[3]. The RTM process uses the textile preforms in well defined stacks with specific textile structure (Fig. 1.2). The stacks are added into a press of the body part mold and formed under pressure while resin is injected through one or more channels into the mold. The reaction of the resin takes place at increased temperatures;
hence, the mold in the press is heated[2].
Figure 1.2:Resin transfer molding - industrial approach, adapted from [2]
Wet compression molding is used for less complex parts, where mass production and a fast process are the focus. Recently, an improved compression molding technique called dynamic fluid compression molding (DFCM)[4] was introduced. Standard wet compression is limited in its process and product complexity, whereas the DFCM technique produces RTM-like quality but with increased speed. Both production methods, standard and dynamic fluid compression molding, use similar steps: a wet fabric insertion, a molding process under pressure with curing time and a de-molding phase. Standard wet compression molding needs a resin overflow, but DFCM combines vaccum and dynamic mold pressure for void-free impregnation (Fig. 1.3). Thus, DFCM is an alternative to the RTM process[4].
Materials Carbon Fiber Reinforced Plastics
Figure 1.3:Wet compression molding - industrial approach, adapted from [2]
Materials Adhesives
1.1.2 Adhesives
Emulating nature’s genius, the practical use of adhesives has been known to mankind for many centuries. In 3000 B.C. glues consisting of herbal or animal pastes were used. Over time many different applications were discovered, and applicable adhesives for specific uses were formulated. Only since the 1940s has the development in technology and mech- anism of adhesives rapidly progressed[5]. An adhesive is the general term for a material that joins two substrates together when applied at the interface. An adhesive can take different forms, such as glue, paste, cement, tape etc.. Depending on the application, an adhesive may be liquid with one or two components, or a film with a reaction mechanism, such as acrylic adhesive, epoxy or urethane-based adhesives[5].
The concept of adhesion relies on the interaction of two boundaries in contact with similar or different compositions. The phase of the adhesive can be solid, liquid or gaseous. For the mechanism of adhesion, several different concepts must be understood[6][7][8]:
• Covalent bonding in a chemical reaction
• Mechanical interlocking
• Formation of an electrical double layer
• Adsorption or wetting
• Diffusion
• Weak boundary interactions
• Acid-base interactions
In most cases, the application of adhesives is in a liquid state, where a wetting of the surface occurs. Depending on the surface tension of the adhesive and the adherend, the molecules are adsorbed on the surface. While curing, the adhesive solidifies and the interface between adhesive and surface adheres. This mechanism is based on a physi- cal bond (e.g. adsorption, wetting, van-der-Waals interactions, electrostatic bonding), a chemical reaction (absorption - covalent bonding) and mechanical interlocking (depend-
Materials Adhesives
the polyaddition of a two-component polyurethane adhesive is regarded in Equation 1.1.
R 1
N C O +
H
O R 2 R 1 N C
O O
H R 2
(1.1)For industrial applications, a homogenous mixture of two separate components initiates the reaction. The first component is a prepolymeric polyol mixture with multiple additives and the second is a prepolymeric isocyanate component. Depending on the amount of alcohol and isocyanate functional groups as well as the chain length in the prepolymeric form, the reactivity and the physical parameters can be influenced, inlcuding elasticity, viscosity, reactivity, curing time and fracture strain. The formulation of an adhesive is adjusted to the individual area of application. For automotive manufacturing, adhesives are optimized regarding fracture strain and reactivity for curing in tightly-scheduled production. In most cases, the adhesives are boosted with an additional catalyst. The reaction is further enhanced and controlled with additional energetic injection. In some cases, infrared heaters are used as an indirect source of heat. The part is brought into contact with infrared heaters at the outer side and the applied adhesive reaction on the inner side is accelerated by the increase in temperature.
Materials Adhesives
1.1.3 References
[1] P. K. Mallick,Fiber-Reinforced Composites: Materials, Manufacturing, and Design, vol. 19.
CRC Press, 3 ed., 2007.
[2] H. Jäger and T. Hauke,Carbonfasern und ihre Verbundwerkstoffe. München: Moderne Industrie, 2010.
[3] K. Potter,Resin Transfer Moulding. London: Chapman & Hall, 1 ed., 1997.
[4] Huntsman, “Dynamic Fluid Compression Molding A new process for composite mass-production,” 2016.
[5] A. J. Kinloch,Adhesion and Adhesives: Science and Technology. New York: Chapman &
Hall, 1 ed., 1987.
[6] A. Baldan, “Adhesion phenomena in bonded joints,”International Journal of Adhesion and Adhesives, vol. 38, pp. 95–116, 2012.
[7] A. V. Pocius,Adhesion and Adhesives Technology: An Introduction. Munich: Carl Hanser Verlag, 3 ed., 2012.
[8] J. Schultz and M. Nardin,Adhesion Promotion Techniques: Technological Applications. New York: Marcel Dekker Inc., 2002.
Analytical techniques Atomic Force Microscopy
1.2 Analytical techniques
1.2.1 Atomic Force Microscopy
In 1982, Gerd Binnig and Heinrich Rohrer developed the scanning tunneling microscope (STM) - the first scanning probe microscope. This revolutionary microscopic technique was the first of its kind with an imaging resolution at atomic level[1][2]. Binning and Rohrer were rewarded with the Nobel Prize in Physics in 1986. In the following years, similar methods using a mechanical scanning tip over a surface were developed. Atomic force microscopy (AFM) was introduced by Binnig, Quate and Gerber in 1986. In contrast to the STM, the AFM is not limited to electrically conducting surfaces. It can scan insulating materials with a lateral resolution of 30 ˚A and a vertical resolution of 1 ˚A[3]. Resembling a phonograph, a sharp probing tip is scanned over a surface and the topography of the sample is recorded, measuring the deflection of the probing tip. For the AFM, this sharp probing tip is mounted at the end of a soft cantilever spring[4]. Distinguishing from other microscopic techniques the AFM tip is in contact with the surface. Atomic-range forces between the tip and the sample surface are measured by detecting the deflection of the cantilever. Due to the sensibility and the depth of information, different measurement modes are possible.
Scanning electron microscope (SEM) image of a monolithic silicon Tap-300 Al-G cantilever, force
Analytical techniques Atomic Force Microscopy
Due to its enormous variety of measuring modes, AFM has been applied in numerous scien- tific fields, including topographical mapping under atmospheric conditions[5] and highly complex measuring modes in a liquid medium for modern molecular and cell biology[6][7].
Further studies have analyzed materials on the molecular[8] or even submolecular level[9].
From electrical nanoimprinting with conducting atomic force microscopy[10] to force spectroscopic measurements to detect cardiovascular diseases in patients[11], many useful applications have been found.
Due to the ability to scan in X,Y and Z directions, the AFM extends the horizontal mea- suring range of optical or scanning microscopes. Compared to other techniques (Fig. 1.5), the AFM performs at length scales from sub-nanometer to 100 µm, and outperforms other imaging techniques in horizontal and especially in vertical scanning resolution. Optical microscopy often complements AFM, since the lower length-scale of optical microscopy overlaps with the maximum length-scale of the AFM. Hence a correlation results in a large dynamic range with a mm scale from the optical microscopic image to a µm scale with the AFM[12].
10 nm 10 µm 10 mm
AFM TEM
OpticalMicroscopy
SEM
Profilometry
Figure 1.5:Comparison of various microscopic techniques and the resolution (adapted from [12])
A modern AFM (e.g. Flex AFM, company Nanosurf) is illustrated in Fig. 1.6. A housing 1 isolates the device from environmental influences and an active vibration isolation platform2protects against vibration disturbances. On top of the isoplatform is an X,Y,Z- automatized sample stage 3. The main section of the AFM has two integrated optical
Analytical techniques Atomic Force Microscopy
transducer and a force transducer. The piezoelectric transducer converts electrical potential into mechanical motion and vice versa, resulting in an electrical potential when the piezo (piezoelectric transducer) receives a mechanical change. For the AFM, the piezo is generally made of synthetic ceramic material (or crystalline, amorphous or polymeric material). The AFM benefits from the sensitivity of the piezo element, since small changes in the geometry of the material (e.g. 0.1 nm) can be detected while applying a potential across two opposite sides of the piezo (e.g. 1 V). The force transducer detects the force between the AFM probe and the surface. Usually the cantilever with an integrated tip is used as the force transducer.
Due to the different force constant of the cantilever, the sensitivity of the interaction with the surface can be controlled. Additionally, an optical lever is installed, in this case a laser beam, which is reflected at the top end of the cantilever towards a photodetector. Thus, a deflection of the cantilever results in a change of the laser position on the detector. The high sensitivity of the AFM is due to a feedback controller, which regulates the movements between probe and surface. It reads the signal from the force transducers and drives the piezo to maintain the probe sample-distance.[12]
1 2
3
4
5 6
7
Figure 1.6: Scheme of a commercially available AFM (Flex AFM - company nanosurf)
Analytical techniques Atomic Force Microscopy
kelvin probe, nanoindentation and scanning thermal microscopy, the concepts rely on either static or dynamic oscillation of the AFM cantilever. For topographical measurements, the static deflection measurement is called contact mode and the oscillating measurement is called tapping mode.
With contact mode, high resolution topographical images can be produced in a short time.
Here, the deflection of the cantilever directly correlates with the topography of the sample.
In a force distance curve, the difference between contact mode and other static modes (e.g.
force spectroscopy) is illustrated in Figure 1.7. Depending on the distance and the strength of interaction forces, the probe is attracted by the surface. An accelerated contact to the surface occurs (snap-in), followed by a repulsive regime, as the cantilever is approached. A force is applied to the surface, such that an indentation occurs while the cantilever bends.
Accordingly, while retracting an attractive force (adhesion) withholds the cantilever until a deferred snap-off occurs. For contact mode, the setpoint is usually fixed in a repulsive regime, so the cantilever stays in contact with the surface.
Di st ance
Fo rc e / D ef le ct io n
0 nN attractive repulsivesetpoint-contactmode operation
retract approach
Figure 1.7:Force-distance curve with contact mode operation in repulsive region, showing cantilever deflection at each regime, adapted from [12]
Analytical techniques Atomic Force Microscopy
addition to the applied force, a lateral force acts on both the probe and the sample. The forces applied to the surface by the cantilever can be described by Hooke’s law (Equation 1.2:
F=−k∗D (1.2)
whereF=force[N],k=probe force constant[N/m],D=deflection distance[m].
For most topographical measurements, the oscillating mode is used (also referred to as the tapping mode or the intermittent contact mode). Here, an additional piezoelectric element oscillates the cantilever, and a calibration of the frequency is done before each measurement. Usually the frequency is set to the resonant frequency of the cantilever with a definable amplitude, depending on the roughness. While scanning over a surface, changes in the vibration amplitude, due to the topography of the sample are detected; i.e.
the vibration amplitude is reduced in close proximity to the surface. The set point is what defines the maximum amplitude while the cantilever oscillates close to the surface. To avoid damage to the probe or the sample, the set point and thus the vibration amplitude, should be set high, yet not too high so as to avoid artifacts and problems while recording small changes in amplitude. For material contrast, not only the change in amplitude is recorded but also the delay in the phase of the oscillation. IIdeally, with a completely homogeneous surface, only the interacting forces impact the probe and the phase does not change. In reality, different materials interact differently with the probe, such that a phase shift will be recorded when the surface material changes. Thus, differences in topography and composition of the surface can be imaged.
In the case of force spectroscopy, the additional information of the snap-in (Fig. 1.8 B), due to van der Waals interaction and adhesion forces (Fig. 1.8 D) are used, while approaching (Fig. 1.8 A to B) and retracting (Fig. 1.8 C to D) the cantilever. Each measuring spot is individually approached and retracted, thus the x- and y- positions stay constant, while the probe approaches and retracts in z-direction. The force data is used for spectroscopy, whereas the slope data is used for nanoindentation[12].
Analytical techniques Atomic Force Microscopy
Di st ance
Fo rc e / D ef le ct io n
0 nN attractive repulsiveB A C
D
retract adhesion
snap in approach
Figure 1.8:Force-distance curve for spectroscopic measurements, A to B approach, at B snap-in occurs, C user defined stop, in contact with sample untill D - snap-off occurs, adapted from [12]
Analytical techniques Chemical Force Microscopy
1.2.2 Chemical Force Microscopy
A variation of force spectroscopy with AFM - chemical force microscopy - was introduced in 1994 by Charles Lieber[13][14]. Lieber used chemically-modified probe tips and mea- sured the adhesive and friction forces between probe and organic monolayers. Since then, this method of modifying cantilevers has been used in several fields, such as material science[15] and bioanalysis[16][17][18]. The concept of CFM is to measure specific inter- actions between the probe and the sample. Since AFM detects even small changes in the attraction and adhesion forces, specific interactions can be measured. The measuring principle resembles force spectroscopy with AFM, however in this case the cantilever is modified with functional chemical groups. Depending on the type of interaction, different functional groups can be chosen, yet a stable bond between the probe and the chemical groups must be achieved. As a result, silane or gold cantilevers are chosen; recent studies have shown that nanocrystalline diamond tips can also be used[19]. In this case to gold coated cantilevers within a self-assembled monolayer process, thiol, thioether or disulfide molecules are able to bond to the gold surface[20]. The measured adhesion force is specific to the interaction between the surface molecules and the molecules on the cantilever. Fig- ure 1.9 illustrates CFM with an 11-mercapto-1-undecanol modified cantilever interacting with unknown surface molecules, R-X.
Distance
Force / Deflection 0 nN attractive repulsive
retract
specific adhesion snap in approach
RX RX RX RX OH
OH OH
specific adhesion
OH OH
S
Figure 1.9:Force-distance curve for spectroscopic measurements; illustration of a chemically modified cantilever and the interaction with the surface molecules R-X, adapted from [12]
Analytical techniques X-ray photolectron spectroscopy
1.2.3 X-ray photolectron spectroscopy
In modern surface analysis[21], x-ray photoelectron spectroscopy (also known as ESCA or electron spectroscopy for chemical analysis) is an important technique for chemical compo- sition characterization[22], chemical state analysis and determining the electronic state of elements[23]. Essentially, all electrons from the core to the valence level can be studied[24].
The first XPS spectrum was recorded by Kai Siegbahn in 1954[25] who later was rewarded with the Nobel Prize[26] for his contributions[27].
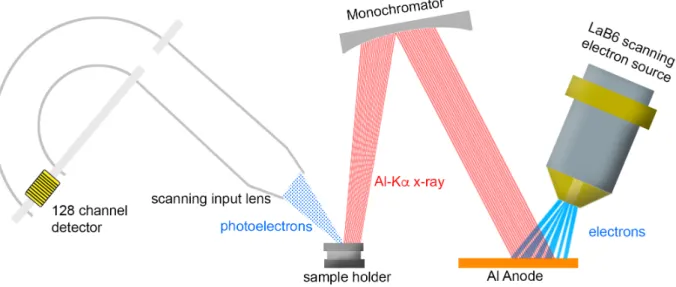
A focused electron beam from a LaB6 scanning electron source creates X-rays on an aluminum anode. The aluminum Kα X-rays are refocused using an ellipsoidal-shaped quartz crystal monochromator and directed towards the sample. While focusing the electron beam on the aluminum anode, the X-ray beam scans over the surface of the sample (Figure 1.10).
Figure 1.10: XPS set up of commercially available Ulvac Phi - Versa Probe II
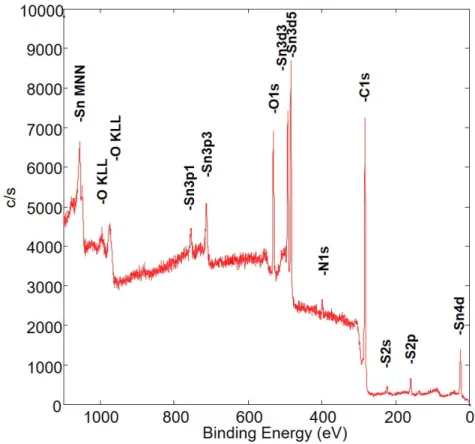
The X-ray beam irradiates the sample and photoelectrons are generated (Figure 1.11). An XPS spectrum consists of a plot of the total of detected electrons per energy interval versus kinetic energy. Thus, for each element, a representative and individual spetrum is recorded [28].
Analytical techniques X-ray photolectron spectroscopy
1s (K) 2s (L) 2p (L)
X-ray Efermi
EB
photoelectron
Figure 1.11:Photoelectronic effect, formation of a photoelectron with an X-ray and a 1s electron (adapted from [28])
For qualitative analysis, the binding energy of the electrons is specific to a particular element and the ratio of the signals identifies the element. To determine the binding energy (EB) of the photoelectrons, the kinetic energy (EK) is measured and substracted from the Al-KαX-ray energy (Ephoton =1486.7 eV). Additionally, a spectrometer-dependent work function is subtracted from the energy of the X-ray photons, as in Equation 1.3. The energy of the fermi level corresponds with a binding energy of zero.
EB =Ephoton−(EK+φ) (1.3)
For depth profiling, an argon ion gun is used, particularly for inorganic materials. The voltage can be set between 5 V and 5 kV.
Analytical techniques DART-Q-ToF-MS
1.2.4 DART-Q-ToF-MS
In 2001, Laramée and Cody developed the first thermal atmospheric ion source in the labo- ratories of JEOL USA Inc. In the following years it resulted in the DART-Ion source, which has a high sensitivity for gaseous molecules[29]. Additionally, all ioniziable substances, which can be desorbed from a surface, could be analyzed. The DART-Ion source offers a broad field of application for solid, liquid and gasous samples[30][31][32]. The ionization process takes place without elaborate sample pretreatments. Hence, the DART-Ion source delivers results in sort of real time. It also requires a high-resolution mass spectrometer as a detector, since the lack of preliminary separation leads to a large amount of information simultaneously.
The DART-Ion source is an atmospheric pressure ion source and consists of a tube where a continuous gas stream flows through (either nitrogen or helium). It is seperated into different chambers, as shown in Figure 1.12. In the first chamber, an electrical potential of several kilovolts between a needle electrode and a counter electrode initiates an electrical glow discharge producing ions, electrons and the electronic excited-state species of helium or vibronic nitrogen molecules. When exiting the glow discharge chamber, the gas passes through a tube containing a perforated intermediate electrode, a gas heater and a grid electrode behind an insulating cap[33].
Analytical techniques DART-Q-ToF-MS
Figure 1.12:DART-Ion source functional principle; first chamber: energetic excitement of the gas to a metastable state through glow discharge, second chamber: filtering charged gas molecules, and third chamber: heating process up to 550◦C
The exiting gas flow can be aimed at a 45◦angle towards the sample surface or directly towards the inlet of the mass spectrometer. Usually a discharge needle potential between 1 kV and 5 kV is set. The potentials of the second perforated electrode and the grid electrode are biased to positive potentials for positive-ion detection and to negative potentials for negative ion detection[33].
As the excited and heated gas flow hits the sample, it desorbs molecules from the surface.
Different competing reactions can occur, depending on the parameter settings and the presence or absence of solvents. One such reaction is the Penning Ionisation[34] (Equation 1.4), in which a metastable, excited-state neutral atom or molecule N∗transfers energy to an analyte molecule M, resulting in the formation of a molecular ion M+•and an electron.
The reaction will occur if the analyte molecule M has an ionization energy that is lower than the internal energy of the excited neutral N∗. The long-lived helium 23S state has an internal energy of 19.8 eV, which is higher than the ionization energies of common
Analytical techniques DART-Q-ToF-MS
atmospheric gases and organic molecules. [33]
N∗+M→N+M+•+e− (1.4)
The ionisation process is assisted by the atmospheric conditions and the humidity in the air. The excited helium in the 23S state ionizes the humidity, and protonated water clusters will be formed (Equation 1.5).
He(23S) +nH2O→[(H2O)n−1+H]++OH•+He(11S) (1.5) Proton transfer to produce the protonated molecule [M + H]+ will occur if the analyte molecule M has a higher proton affinity than the ionized water clusters (Equation 1.6) [33].
M+ [(H2O)n+H]+ →[M+H]++nH2O (1.6) An inlet tube assists the formed ions into the mass spectrometer.
Analytical techniques DART-Q-ToF-MS
1.2.5 References
[1] G. Binnig, H. Rohrer, C. Gerber, and E. Weibel, “Surface studies by scanning tunneling microscopy,”Physical review letters, vol. 49, no. 1, pp. 57–61, 1982.
[2] G. Binnig and H. Rohrer, “Scanning tunneling microscopy,”Surface Science, vol. 126, no. 1-3, pp. 236–244, 1983.
[3] G. Binnig and C. F. Quate, “Atomic Force Microscope,”Physical Review Letters, vol. 56, no. 9, pp. 930–933, 1986.
[4] D. Rugar and P. Hansma, “Atomic Force Microscopy,” 1990.
[5] S. Tualu, A. J. Ghazai, S. Stach, A. Hassan, Z. Hassan, and M. Tualu, “Characterization of surface roughness of Pt Schottky contacts on quaternary n-Al0.08In0.08Ga0.84N thin film assessed by atomic force microscopy and fractal analysis,”Journal of Materials Science: Materials in Electronics, vol. 25, no. 1, pp. 466–477, 2014.
[6] Y. F. Dufrêne, T. Ando, R. Garcia, D. Alsteens, D. Martinez-Martin, A. Engel, C. Gerber, and D. J. Müller, “Imaging modes of atomic force microscopy for application in molecular and cell biology,”Nature Nanotechnology, vol. 12, no. 4, pp. 295–307, 2017.
[7] K. Haase and A. E. Pelling, “Investigating cell mechanics with atomic force mi- croscopy,”Journal of The Royal Society Interface, vol. 12, no. 104, 2015.
[8] B. Schuler, G. Meyer, D. Peña, O. C. Mullins, and L. Gross, “Unraveling the Molecular Structures of Asphaltenes by Atomic Force Microscopy,” Journal of the American Chemical Society, vol. 137, no. 31, pp. 9870–9876, 2015.
[9] C. Moreno, O. Stetsovych, T. K. Shimizu, and O. Custance, “Imaging Three- Dimensional Surface Objects with Submolecular Resolution by Atomic Force Mi- croscopy,”Nano Letters, vol. 15, no. 4, pp. 2257–2262, 2015.
[10] S. Goswami, S. Nandy, A. N. Banerjee, A. Kiazadeh, G. R. Dillip, J. V. Pinto, S. W.
Joo, R. Martins, and E. Fortunato, “Electro-Typing on a Carbon-Nanoparticles-Filled Polymeric Film using Conducting Atomic Force Microscopy,” Advanced Materials, vol. 29, no. 47, pp. 1–9, 2017.
Analytical techniques DART-Q-ToF-MS
[11] A. F. Guedes, F. A. Carvalho, I. Malho, N. Lousada, L. Sargento, and N. C. Santos,
“Atomic force microscopy as a tool to evaluate the risk of cardiovascular diseases in patients,”Nature Nanotechnology, vol. 11, no. 8, pp. 687–692, 2016.
[12] P. Eaton and P. West,Atomic Force Microscopy. New York: Oxford University Press Inc., 2010.
[13] C. D. Frisbie, L. F. Rozsnyai, A. Noy, M. S. Wrighton, and C. M. Lieber, “Functional Group Imaging by Chemical Force Microscopy,”Science, vol. 265, no. 5181, pp. 2071 LP – 2074, 1994.
[14] A. Noy, D. V. Vezenov, and C. M. Lieber, “Chemical Force Microscopy,”Annual Review of Materials Science, vol. 27, no. 3, pp. 381–421, 1997.
[15] J. Wu, F. Liu, G. Chen, X. Wu, D. Ma, Q. Liu, S. Xu, S. Huang, T. Chen, W. Zhang, H. Yang, and J. Wang, “Effect of Ionic Strength on the Interfacial Forces between Oil/Brine/Rock Interfaces: A Chemical Force Microscopy Study,”Energy and Fuels, vol. 30, no. 1, pp. 273–280, 2016.
[16] S. Iliafar, K. Wagner, S. Manohar, A. Jagota, and D. Vezenov, “Quantifying Interac- tions between DNA Oligomers and Graphite Surface Using Single Molecule Force Spectroscopy,”The Journal of Physical Chemistry C, vol. 116, no. 26, pp. 13896–13903, 2012.
[17] D. J. Müller and Y. F. Dufrêne, “Atomic force microscopy: a nanoscopic window on the cell surface,”Trends in Cell Biology, vol. 21, no. 8, pp. 461–469, 2011.
[18] L. N. Poloni, X. Zhong, M. D. Ward, and T. Mandal, “Best practices for real-time in situ atomic force and chemical force microscopy of crystals,”Chemistry of Materials, vol. 29, no. 1, pp. 331–345, 2017.
[19] M. E. Drew, A. R. Konicek, P. Jaroenapibal, R. W. Carpick, and Y. Yamakoshi,
“Nanocrystalline diamond AFM tips for chemical force spectroscopy: fabrication and photochemical functionalization,”Journal of Materials Chemistry, vol. 22, no. 25, p. 12682, 2012.
[20] A. Ebner, L. Wildling, R. Zhu, C. Rankl, T. Haselgrübler, P. Hinterdorfer, and H. J.
Analytical techniques DART-Q-ToF-MS
[21] P. Dietrich, K. Beblo-Vranesevic, M. Kjærvik, W. Unger, K. Schwibbert, K. Hardie, and J. Brown, “XPS surface analysis of bacterial samples,” 2018.
[22] V. Gong and R. França, “Nanoscale chemical surface characterization of four different types of dental pulp-capping materials,”Journal of Dentistry, vol. 58, pp. 11–18, 2017.
[23] G. Corro, E. Vidal, S. Cebada, U. Pal, F. Bañuelos, D. Vargas, and E. Guilleminot,
“Electronic state of silver in Ag/SiO2 and Ag/ZnO catalysts and its effect on diesel particulate matter oxidation: An XPS study,” Applied Catalysis B: Environmental, vol. 216, pp. 1–10, 2017.
[24] J. M. Hollander and W. L. Jolly, “X-Ray Photoelectron Spectroscopy,”Accounts of Chemical Research, vol. 3, no. 6, pp. 193–200, 1970.
[25] K. Siegbahn and K. Edvarson, “β-Ray spectroscopy in the precision range of 1 : 105,”
Nuclear Physics, vol. 1, no. 8, pp. 137–159, 1956.
[26] K. Siegbahn, “Electron spectroscopy for atoms, molecules, and condensed matter,”
1981.
[27] K. Siegbahn, C. Nordling, and A. Fahlman, “ESCA, atomic, molecular and solid state structure studied by means of electron spectroscopy,” tech. rep., Almqvist and Wiksell, Uppsala, 1967.
[28] P. E. S. J. F. Moulder, W. F. Stickle and K. D. Bomben,Handbook of X-ray Photoelectron Spectroscopy. Chigasaki: ULVAC-PHI and Physical Electronics, 3 ed., 1992.
[29] R. B. Cody, J. A. Laramée, and H. D. Durst, “Versatile New Ion Source for the Analysis of Materials in Open Air under Ambient Conditions,”Analytical Chemistry, vol. 77, no. 8, pp. 2297–2302, 2005.
[30] M. J. Pavlovich, B. Musselman, and A. B. Hall, “Direct analysis in real timeâ ˘AˇTMass spectrometry (DART-MS) in forensic and security applications,”Mass Spectrometry Reviews, vol. 37, no. 2, pp. 171–187, 2016.
[31] T.-H. Chen, H.-Y. Hsu, and S.-P. Wu, “The detection of multiple illicit street drugs in liquid samples by direct analysis in real time (DART) coupled to Q-orbitrap tandem
Analytical techniques DART-Q-ToF-MS
[32] E. S. Chernetsova, P. O. Bochkov, M. V. Ovcharov, S. S. Zhokhov, and R. A.
Abramovich, “DART mass spectrometry: a fast screening of solid pharmaceuticals for the presence of an active ingredient, as an alternative for IR spectroscopy,”Drug Testing and Analysis, vol. 2, no. 6, pp. 292–294, 2010.
[33] R. B. Cody, “Observation of Molecular Ions and Analysis of Nonpolar Compounds with the Direct Analysis in Real Time Ion Source,”Analytical Chemistry, vol. 81, no. 3, pp. 1101–1107, 2009.
[34] F. M. Pennig, “Über Ionisation durch metastabile Atome,”Naturwissenschaften, vol. 15, p. 818, 1927.
Mechanical tests
1.3 Mechanical tests
In modern industrial applications, the evaluation and quality control of an adhesive is essential, since small changes in the formulation, contamination or aging effects drastically influence the physical parameters. Hence, quick tests are used to ensure the performance of the adhesive and approve new adhesives through standardized methods. Mechanical tests evaluate an adhesive and the strength of the compound[1].
1.3.1 Tensile-shear-test
A tensile shear test[2][3][4] indicates the maximum strength applicable in parallel to the bond (Fig 1.13). Usually, two types of detatchments are found: a cohesive failure within the adhesive and an adhesive failure in the intersection between the adhesive and substrate.
Additionally, the tractive distance and the maximum strength are recorded. Ideally, there is a cohesive failure with a high tensile strength.
cohesive failure adhesive failure tensile shearstrength adhesive
Figure 1.13: Scheme of the tensile shear test
Mechanical tests
1.3.2 Peel-test
A second test, the peel test[5][6] (Fig. 1.14), evaluates the quality of the adhesive by applying a vertical force. Here, the test is done manually by slicing the outer end of the adhesive with a knife. The adhesive is evaluated based on the failure mechanism; a cohesive failure is desired.
adhesive
adhesive failure cohesive failure
peeltest traction
Figure 1.14:Scheme of the peel test
Mechanical tests
1.3.3 References
[1] A. Ching and B. Oral, “Peel and Shear Fracture Characterization of Debonding in FRP Plated Concrete Affected by Moisture,”Journal of Composites for Construction, vol. 10, no. 1, pp. 35–47, 2006.
[2] P. E. C. Cardoso, R. R. Braga, and M. R. O. Carrilho, “Evaluation of micro-tensile, shear and tensile tests determining the bond strength of three adhesive systems,” Dental Materials, vol. 14, no. 6, pp. 394–398, 1998.
[3] S. A. Meguid and Y. Sun, “On the tensile and shear strength of nano-reinforced com- posite interfaces,”Materials & Design, vol. 25, no. 4, pp. 289–296, 2004.
[4] W. Zhang, C. Cotton, J. Sun, D. Heider, B. Gu, B. Sun, and T.-W. Chou, “Interfacial bonding strength of short carbon fiber/acrylonitrile-butadiene-styrene composites fabricated by fused deposition modeling,” Composites Part B: Engineering, vol. 137, pp. 51–59, 2018.
[5] S. Teixeira de Freitas, M. D. Banea, S. Budhe, and S. de Barros, “Interface adhesion assessment of composite-to-metal bonded joints under salt spray conditions using peel tests,”Composite Structures, vol. 164, pp. 68–75, 2017.
[6] Y. Wei and J. W. Hutchinson, “Interface strength, work of adhesion and plasticity in the peel test BT - Recent Advances in Fracture Mechanics: Honoring Mel and Max Williams,” pp. 315–333, Dordrecht: Springer Netherlands, 1998.
2 Experimental
2.1 Chemicals and materials
Adhesive
In chapter 3.1. the formulation of the reference adhesive is described. For all experiments this adhesive was used. The chemical composition is listed in the chapter, as well as the experimantal procedure.
AFM tip modification
The procedure for chemical modification of AFM cantilevers is described in chapter 3.3.
For the self assembled monolayer process 11-mercapto-1-undecanol was used (Fig. 2.1).
All chemicals and the experimental procedure are described in the corresponding experi- mental part of the chapter.
1
2 3
4 5
6 7
8 9
10 11
HO SH
Figure 2.1: For self assembled monolayer process 11-mercapto-1-undecanol was used
Carbon fiber reinforced plastic
All experiments regarding CFRP pretreatment are described in chapter 3.4.. The CFRP plates were industrially manufactured in a RTM process (comparable products available at Rhein Composite GmbH).
Measurements
Cavity wax
The cavitx wax used in the chapter 3.6. and 3.7. is a commercially available product. For all experiments water based cavity wax was used.
2.2 Measurements
FT-IR
All IR measurements were done with a commercial FT-IR (Thermo - nicolet is50). A macro was programmed to record the reaction process of adhesives over time. Here a FT-IR spectrum was recorded every 30 seconds for 800 minutes. Resulting in a 3D time resolved FT-IR spectrum. For the evaluation of the reaction speed the signal at 2261 cm−1 was plotted over time.
DART-Q-ToF-MS
For the analysis with the DART-SVP ion source (IonSense/KR-Analytical), a sample was introduced directly into the excited and heated helium stream. Based on preceding measurements, it was found that 350◦C is an appropriate temperature for the study of volatile components used in industrial manufacturing.
AFM
The AFM experiments were done with the Flex AFM system from Nanosurf AG. The topographical measurements were done in tapping mode with Tap300Al-G cantilevers and the force measurements were done with Tap300GB-G and HQ:NSC19/Cr-Au can- tilevers.
XPS
All XPS measurements were done with a Ulvac PHI - Versa Probe II. For all experiments the procedure is comparable. At first the samples were stored in a prevacuum chamber till they reached a pressure of 10−5Pa. Afterwards they were transfered to the main chamber of the system (pressure 10−7Pa). The X-ray setting for the survey spectrum was chosen at 25 W, 15 kV with 100 µm. Afterwards a high resolution spectrum was recorded for the respective elements with 100 W, 20 kV and a diameter of 100 µm and a scanning area of 1400 µm. For depth profiling argon sputtering was set to 2x2 kV for 35 minutes and 15
3 Results & Discussion
3.1 Analytical approach for the formulation of a reference adhesive system
3.1.1 Introduction
In the automotive sector, raw materials and supply characteristics must ensure large- scale production. This is especially true in emerging sectors, where many suppliers offer similar products. However, most of the knowledge on the product is kept in secret, and this is particularly true for the production of adhesives[1] for automotive applications[2][3]. Hence, for detailed analytical approaches, reference substances must be used[4]. Therefore, different attempts at formulating a two-component polyurethane adhesive will be regarded and an analytical approach[5][6] to qualify the product will be investigated[7].
3.1.2 Experimental Procedure
For all experiments, a two-component polyurethane adhesive was formulated with a com- position resembling the isocyanate component containing methylenediphenyl diisocyanate, hexamethylene diisocyanate and bulking agent (e.g. soot).
Formulation A
A prepolymeric alcohol functionalized polybutadiene mixture (52.12 w.%, Polyvest EP HT, EVONIK Resource Efficiency GmbH, Marl, Germany) was used as the reactive polyol.
Analytical approach for the formulation of a reference adhesive system
obtained from Sigma-Aldrich. Dimethoxypolysiloxane (0.07 w.%, Sigma-Aldrich) was used as an antifoaming agent (Table 3.1)[7].
Table 3.1: System A: Polyol formulation
System A: Polyol Amount in w.%
Polyvest 52.12
Thiodiethanol 9.2
Kaolin 37.94
Trimethoxysilane 0.66 Dimethoxypolysiloxane 0.07
All components were homogenized with a Thinky Mixer ARE 250 (Thinky corp., Tokyo, Japan) for two minutes at 2000 RPM.
Formulation B
To improve the crosslinking, 2.0 w.% of pentaerythrit (Sigma-Aldrich) was mixed into Formulation A.
Formulation C
To increase the reaction speed, zirconium(IV)acetylacetonate was used as a catalyst (Sigma- Aldrich)[8]; 0.4 w.% was mixed into Formulation B.
Fourier-Transform Infrared Microspectroscopy (FT-IR)
The reaction of a two-component polyurethane (PUR) adhesive was seen by the decrease in signal from the isocyanate antisymmetric valence stretching at 2250-2300 cm−1 (Fig.
3.2). A macro was created to record the reaction process of the adhesive over time. An FT-IR spectrum was recorded every 30 seconds for 800 minutes. This resulted in a 3D time-resolved FT-IR spectrum. For the evaluation of the reaction speed, the signal at 2261 cm−1was plotted over time (Fig. 3.2).
Analytical approach for the formulation of a reference adhesive system
Figure 3.1:Thermo - nicolet is50
Figure 3.2: FT-IR isocyanate signal and reaction over time
![Figure 1.1: Industrial manufacturing process of fibers - polymerization, spinning, washing, drying, elongating, spool, adapted from [2]](https://thumb-eu.123doks.com/thumbv2/1library_info/3853552.1516248/20.892.166.738.173.377/figure-industrial-manufacturing-process-polymerization-spinning-washing-elongating.webp)
![Figure 1.7: Force-distance curve with contact mode operation in repulsive region, showing cantilever deflection at each regime, adapted from [12]](https://thumb-eu.123doks.com/thumbv2/1library_info/3853552.1516248/29.892.104.771.601.979/figure-distance-contact-operation-repulsive-showing-cantilever-deflection.webp)
![Figure 1.11: Photoelectronic effect, formation of a photoelectron with an X-ray and a 1s electron (adapted from [28])](https://thumb-eu.123doks.com/thumbv2/1library_info/3853552.1516248/34.892.230.650.169.506/figure-photoelectronic-effect-formation-photoelectron-ray-electron-adapted.webp)