A Study on R&D Tax Incentives
FINAL REPORT
TAXUD/2013/DE/315
FWC No. TAXUD/2010/CC/104
CPB Netherlands Bureau for Economic Policy Analysis (Consortium leader)
In consortium with:
CAPP CASE
CEPII ETLA
IFO IFS
IHS
The Hague, 28 November 2014
A Study on R&D Tax Incentives
November 2014 2 Prepared by:
CPB
Bas Straathof (project leader) Elina Gaillard-Ladinska
Henk Kox Remco Mocking CASE
Itzhak Goldberg Camilla Jensen Peter Lindholm Maciej Sobolewski ETLA
Birgitta Berg-Andersson Hannu Kaseva
Petri Rouvinen Tarmo Valkonen IHS
Richard Sellner Karin Schönpflug Iain Paterson
Disclaimer
The information and views set out in this report are those of the author(s) and do not necessarily reflect the official opinion of the Commission. The Commission does not guarantee the accuracy of the data included in this study. Neither the Commission nor any person acting on the Commission’s behalf may be held responsible for the use which may be made of the information contained therein.
CPB Netherlands Bureau for Economic Policy Analysis Van Stolkweg 14
P.O. Box 80510
2508 GM The Hague, the Netherlands
Telephone +31 70 338 33 80
Telefax +31 70 338 33 50
Internet www.cpb.nl
A Study on R&D Tax Incentives
November 2014 3
A Study on R&D Tax Incentives
A Study on R&D Tax Incentives
November 2014 4
A Study on R&D Tax Incentives
November 2014 5
Summary
Interest in the effectiveness of tax incentives for Research and Development (R&D) has spurred in the aftermath of the financial crisis - and for two different reasons.
First, the financial crisis obliged many governments to introduce tough fiscal consolidation measures. This has increased the urgency to balance expenditure on innovation policy against expenditure on other policies. Another reason is that the drop in economic activity put even more emphasis on the need to find new sources of growth.
R&D tax incentive schemes are widely adopted in advanced economies, including innovation leaders like the United States and Japan. Within the EU, only Germany and Estonia currently do not have a tax policy aimed directly at stimulating innovation.
Although tax incentives are common, they are far from homogeneous and differ substantially across the 33 countries surveyed in this report,
1with most countries offering more than one type of instrument. R&D tax credits are the most popular type of incentive (present in 21 countries), followed by enhanced allowances (sixteen countries) and accelerated depreciation (thirteen countries).
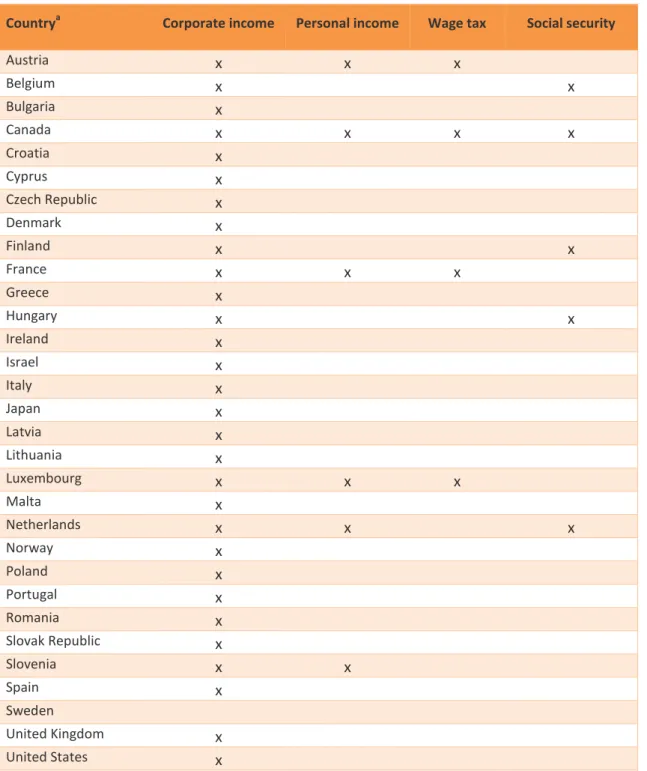
The vast majority of tax incentives are based on corporate income taxes, while eight countries have (additional) incentives that apply to social contributions and/or wage taxes. Tax benefits applying to income from innovation (mostly patent boxes) are proliferating. At the moment of writing, eleven EU member states offered corporate tax reduction for income resulting from to intellectual property.
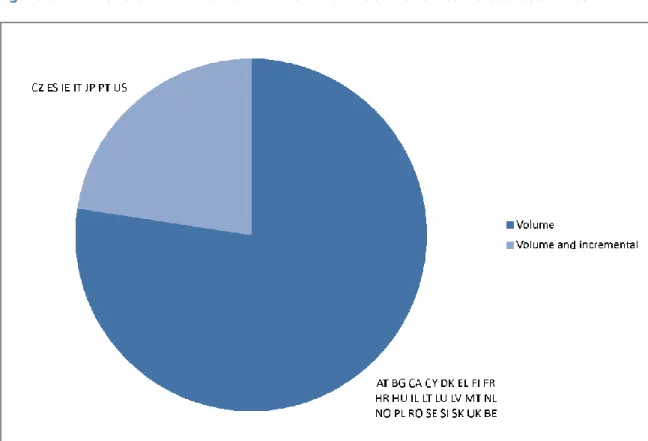
In the past fifteen years countries have shifted from tax incentives that only apply to increments in a firm’s R&D expenditure (incremental schemes) towards incentives that apply to total R&D expenditure (volume-based schemes). Currently, only seven countries have incremental tax incentives, usually in combination with a volume-based scheme, and for two of them - Ireland and United States - this design element is phasing out.
While tax incentives are essentially a generic policy instrument, targeting to specific groups of firms is quite common. Ten countries explicitly target small- and medium- sized enterprises. Six countries target young companies. In ten countries, tax incentives are also differentiated according to the legal status of firms. For example, some schemes have smaller tax benefits for foreign-owned companies as is the case in Canada. Most countries put a ceiling on the amount that firms can receive and in five countries the generosity of the scheme decreases with the size of a firm’s R&D expenditure.
Do R&D tax incentives work?
The widespread use of R&D tax incentives in times of economic slowdown raises the question of how effective these policy instruments are. The vast majority of studies surveyed in this report conclude that R&D tax credits are effective in stimulating investment in R&D. The estimates of the size of this effect are widely diverging and are not always comparable across countries due to differences in methodology.
Studies that are more rigorous find that one euro of foregone tax revenue on R&D tax credits raises expenditure on R&D by less than one euro.
Whether R&D tax incentives work ultimately depends on how many innovative products, services, and production processes they induce. Unfortunately, the impact of
1
Besides the member states of the European Union also Canada, Israel, Japan,
Norway, and the United States were analysed.
A Study on R&D Tax Incentives
November 2014 6 R&D tax incentives on innovation and productivity is less studied. The limited evidence seems to point towards a positive impact of R&D tax incentives on innovation.
The effects of R&D tax incentives on R&D expenditure vary across sub-groups of firms, with most studies focusing on firm size. In some of the countries analysed, small and medium sized enterprises (SMEs) tend to respond more strongly to the support for R&D, while the reverse was found in other countries. These seemingly contradictory results make it difficult to draw general conclusions. There is some evidence that the impact for start-up firms can exceed the average impact.
Recent evidence suggests that knowledge spillovers of large firms exceed those of small firms. This finding weakens the case for targeting tax incentives towards SMEs - even when SMEs would increase their R&D expenditure more strongly in response to incentives.
The impact of R&D tax credits may be highly sensitive to their design and organization, but empirical studies on the effects of design and organizational features are scarce. One aspect that is relatively well-studied is whether incremental schemes perform better than volume-based schemes. Both kinds of designs have been found to result in additional R&D expenditure, but the evidence on which type of scheme is more effective is mixed.
Do patent boxes work?
A large body of literature has identified that multinational firms engage in profit- shifting activities in order to decrease their overall tax liabilities. Intangible assets, like patents, play an important role as their location of origin can be quite arbitrary. Tax incentives for income generated by R&D, mostly patent boxes, can result in large decreases in tax revenue for all governments, including those engaging in such a policy.
Tax incentives for R&D expenditure reward firms for the societal benefits from innovation that they themselves are unable to appropriate. It is hard to make the argument that a patent box serves the same purpose: patent boxes introduce a preferential rate for income from innovations that are already protected by Intellectual Property Rights (IPR’s). IPR’s enable firms to capture a large part of the societal benefits, such that the need for a tax incentive for protected innovations becomes unclear. The impact on innovation of patent boxes is difficult to evaluate empirically as tax planning and tax competition induce measurement error in innovation indicators.
What is good practice?
In the absence of comparable evidence on the performance of specific R&D tax incentives, more than 80 tax incentives in 31 countries have been benchmarked. The benchmarking is based on twenty principles of best practice, which are divided over three categories: 1) scope of the instrument: how does the tax incentive work, which expenditures are eligible, 2) targeting: does the instrument target specific types of firms, explicitly or implicitly, and 3) organizational practice: how does the application procedure work and is the tax incentive evaluated?
One of the best practice principles proposed in this report is that volume-based R&D
tax credits are preferred over incremental ones. Incremental R&D tax incentives may
trigger firms to change the timing of their R&D investment plans. For example,
incremental schemes make it more attractive for firms to gradually increase their R&D
investment than to do a single large investment now if profits from these investments
will materialize later in time. Also, incremental schemes result in higher administrative
and compliance costs. As incremental schemes probably are not more effective than
volume-based schemes, the higher costs of incremental schemes make volume-based
schemes a better practice. The vast majority of instruments are volume-based.
A Study on R&D Tax Incentives
November 2014 7 Another good practice principle proposed in this report is that tax incentives should only be aimed at R&D activities that are likely to contribute to the world-wide stock of knowledge, rather than support activities limited to advancement in firm’s own state of expertise. The impact of a tax incentive on innovation will depend strongly on the strictness of its novelty requirement. Without any novelty requirement, a tax incentive could stimulate imitation, rather than innovation. Especially for countries close to the technology frontier, such a scheme could reduce innovation instead of promote it.
Countries that are lagging in terms of innovation might catch up faster if they allow for imitation of foreign innovations. A number of R&D tax incentive schemes have strict novelty requirements, including in Canada and the United Kingdom.
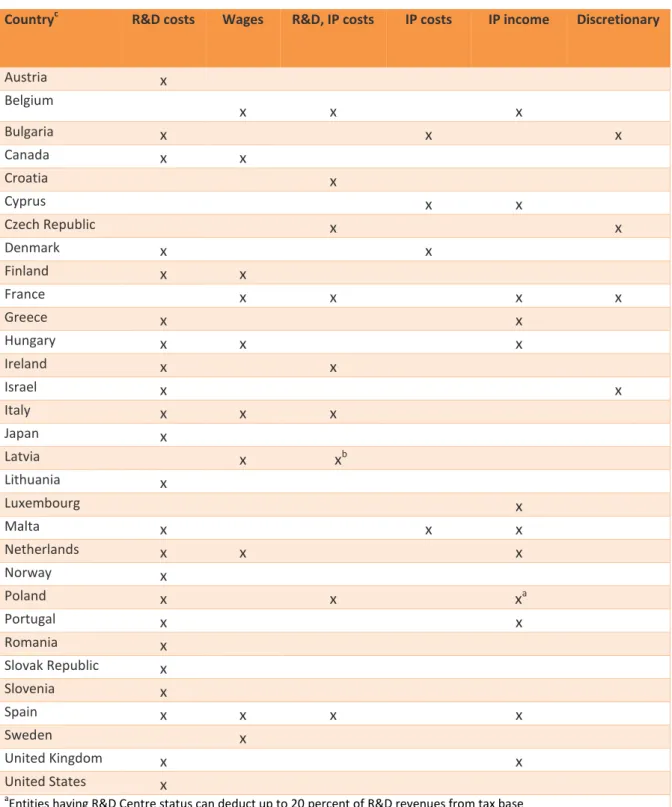
Tax incentives should ideally apply to those types of expenditures that bring about strong knowledge spillovers. Tax incentives based on the wage bill paid to researchers can be considered best practice in this context, for example because they are likely to generate higher knowledge spillovers than other types of R&D expenditure:
researchers move from one employer to another and take their former’s employers knowledge with them. A practical advantage of tax incentives for R&D wages is that they have lower administration and compliance costs. Tax credits for researcher wages can be found in The Netherlands and Belgium, amongst others (see Table 5.2 for an overview).
Young companies, rather than SMEs in general, are probably more likely to bring the innovations that challenge large incumbent firms. A favourable environment for entrepreneurs might not only contribute to a country’s innovativeness but also to the flexibility of its economy. Targeting young companies can be considered a better practice than targeting SMEs. A scheme which has been identified as a good practice and explicitly targets young firms is the French tax credit for young innovative enterprises (Jeunes Entreprises Innovantes).
As R&D expenditure may precede revenue generated by innovation by several years, it is good practice to provide a carry-over facility and an option to receive the benefit even in case a company is not profitable (cash refunds). Such features offer firms more flexibility and certainty for investment decisions. This is especially relevant for young companies that typically are not profitable in the first years of operations. While most of the R&D tax incentives analysed offer a carry forward facility, cash refunds are available only in nine countries.
With respect to the organization of a tax incentive it is good practice to have a one- stop, online application procedure. This is already in place in majority of the countries.
In addition, the time it takes for tax authorities to make a decision on eligible expenses should be as short as possible, not exceeding a year. Several countries have already introduced an option to receive an immediate refund for smaller companies, as these firms are typically more liquidity constrained.
Systematic evaluations are also recommended. High-quality firm-level data is
indispensable for a rigorous quantitative evaluation and should be collected according
to international standards. For seventeen countries no evaluation study has been
found. Currently, only few countries have frequent evaluations, for example The
Netherlands and France. The quality of evaluation studies is mixed and in many cases
does not meet the standards of peer-reviewed academic journals.
A Study on R&D Tax Incentives
November 2014 8 A ranking of R&D tax incentives
The scores of tax incentives on the twenty best practice principles are used to compute an overall index. The instrument that has the highest overall benchmarking score is the French tax credit for young innovative enterprises (Jeunes Entreprises Innovantes). It provides generous support to young SMEs for which R&D expenditure represents at least fifteen percent of total costs. The novelty requirement of R&D is according to best practice (“new to the world”). The immediate refund option and short response time means that firms can obtain the funding faster.
The Norwegian SkatteFUNN tax credit comes second. This largely generic scheme only offers a preferential rate to SMEs. The application procedure of the R&D tax credit is quite simple: firms can apply online, one-stop agency is available and several guides are available. The introduction of the policy involved a public consultation and it has been evaluated various times. The third position is taken by the Accelerated amortization in Denmark, which has a good organizational practice and does not target specific groups of firms.
Overall, the eighty R&D tax incentives show substantial heterogeneity in their designs
and organizational practice. In part this reflects differences in country characteristics
(like innovation systems and tax rates), but there are also substantial opportunities
for improving R&D tax incentives across the European Union - in particular with
respect to the organization and scope of the tax incentives.
A Study on R&D Tax Incentives
November 2014 9
Résumé
L'intérêt quant à l'efficacité des incitants fiscaux en Recherche et Développement (R&D) a été stimulé à la suite de la crise financière - pour deux raisons différentes. En premier lieu, la crise financière a contraint de nombreux gouvernements à mettre en place des mesures de consolidations fiscales rigoureuses. Cela a accru l’urgence d'équilibrer les dépenses en matière d'innovation par rapport aux dépenses liées à d'autres domaines d'actions publiques. La seconde raison est que la baisse de l'activité économique souligne encore plus le besoin de trouver de nouvelles sources de croissance.
Les schémas d'incitants fiscaux en R&D sont largement adoptés dans les économies avancées, y compris par les leaders de l'innovation comme les États-Unis et le Japon.
Au sein de l'UE, seules l'Allemagne et l'Estonie n'ont actuellement aucune politique fiscale visant directement la stimulation de l'innovation. Bien que les incitants fiscaux soient communs, ils sont loin d'être homogènes et diffèrent beaucoup á travers les 33 pays observés dans ce rapport,
2la plupart des pays offrant plus d'un type d'instrument. Les crédits d'impôts en R&D sont le type d'incitant le plus populaire (présent dans 21 pays), suivi par les régimes de déduction plus favorables (seize pays) et la dépréciation accéléré (treize pays).
La majorité des incitants fiscaux se fondent sur les impôts sur les revenus professionnels, tandis que huit pays proposent des incitants (supplémentaires) qui s'appliquent aux cotisations sociales et/ou à l'impôt sur le salaire. Les avantages fiscaux s'appliquant aux revenus d'innovation (le plus souvent les patent boxes) sont en plein essor. Au moment de l'écriture de ce rapport, onze membres de l'UE proposaient une réduction de la taxe professionnelle pour les revenus attribuables à la propriété intellectuelle.
Au cours des quinze dernières années, les pays sont passés d’incitants fiscaux qui s'appliquent uniquement aux augmentations des dépenses en R&D de l'entreprise (incitants incrémentaux) à des incitants qui s'appliquent aux dépenses en R&D totales (incitants basés sur le volume). Actuellement, seuls sept pays ont des incitants fiscaux incrémentaux, et dans deux d'entre eux - l'Irlande et les États-Unis - cet élément disparaît progressivement. Les incitants fiscaux en R&D sont également devenus plus généreux pendant la crise économique, plusieurs pays ayant accru le taux des bénéfices et élargi la définition des dépenses éligibles.
Tandis que les incitants fiscaux sont essentiellement un instrument stratégique générique, cibler des groupes spécifiques d'entreprises est assez commun. Dix pays visent explicitement les petites et moyennes entreprises. Six pays visent les jeunes entreprises. Dans dix pays, les incitants fiscaux sont également différentiés en fonction du statut légal des entreprises. Par exemple, certains incitants ont des bénéfices fiscaux moins importants pour les entreprises sous contrôle étranger. La plupart des pays fixe une limite au montant que les entreprisse peuvent recevoir et dans cinq pays, la générosité de l’incitant diminue au fur et à mesure que les dépenses en R&D d'une entreprise augmentent.
Est-ce que les incitants fiscaux en R&D fonctionnent ?
L'utilisation largement répandue des incitants fiscaux en R&D, à une époque de ralentissement économique, soulève la question de savoir à quel point ces instruments politiques sont efficaces. La grande majorité des études analysées dans le cadre de ce rapport arrive à la conclusion que les crédits d'impôts en R&D sont efficaces pour
2
En plus des États membres de l'Union Européenne, le Canada, Israël, le Japon, la
Norvège et les États-Unis ont été également analysés.
A Study on R&D Tax Incentives
November 2014 10 stimuler les investissements en R&D. Les estimations de l’importance de leur impact sont très variées, et ne sont pas toujours comparables entre les pays en raison des différences de méthode. Des études plus approfondies révèlent qu'une perte de recette fiscale d'un euro sur les crédits d'impôts en R&D, entraine une dépense en R&D de moins d'un euro.
L'efficacité des incitants fiscaux en R&D dépend surtout du nombre de produits, services et processus de production innovants qu’ils entraînent. Malheureusement, l'impact des incitants fiscaux en R&D sur l'innovation et la productivité a été moins étudié. Les preuves limitées semblent indiquer un impact positif des incitants fiscaux en R&D sur l'innovation.
Les effets des incitants fiscaux en R&D sur les dépenses en R&D varient selon les classes d'entreprise. La plupart des études se concentrent sur la taille des entreprises.
Dans certains des pays analysés, les petites et moyennes entreprises (PME) réagissent plus fortement à l'aide dans le domaine de R&D, alors que l'inverse a été trouvé dans d’autres pays. Ces résultats, apparemment contradictoires, rendent une conclusion générale difficile. Certains résultats montrent que l'impact pour les start-ups peut dépasser l'impact moyen.
Des résultats récents suggèrent que les diffusions de connaissances de grandes entreprises dépassent celles de petites entreprises. Cette résultat constatation limite entraîne que les incitants fiscaux sont moins accordés aux PME - même si les PME augmentaient plus fortement leurs dépenses en R&D comme réaction aux incitants.
L'impact des crédits d'impôts en R&D peut être très sensible à leur conception et à leur organisation, mais les études empiriques sur les effets des caractéristiques de concept et d'organisation sont rares. Un aspect relativement bien étudié est celui de savoir si les incitants incrémentaux sont plus efficaces que les incitants basés sur le volume. Il s'avère que les deux sortes d’incitants entraînent des dépenses en R&D supplémentaires, mais les preuves permettant de savoir quel type d’incitant est le plus efficace sont mitigées.
Est-ce que les patent boxes fonctionnent ?
De nombreux documents ont identifié que des entreprises multinationales s'engagent dans des activités de transfert de bénéfices afin de diminuer leur dette fiscale générale. Les actifs immatériels, comme les brevets, jouent un rôle important car l'endroit où ils ont été créés peut être arbitraire. Les incitants fiscaux pour les revenus générés en R&D, le plus souvent les patent boxes, peuvent résulter en des réductions importantes des revenus d'impôts pour tous les gouvernements appliquant une telle politique.
Les incitants fiscaux pour les dépenses en R&D forment un dédommagement pour les entreprises des avantages sociaux de l'innovation qu'ils sont eux-mêmes incapables d'attribuer. Il est difficile de présenter l'argument qu'une patent box sert à la même chose : les patent boxes mettent en place un taux préférentiel pour le revenu des innovations déjà protégées par les droits de propriété intellectuelle. Ces droits permettent aux entreprises de profiter d'une large partie des bénéfices sociaux, de sorte que le besoin d'un incitant fiscal pour les innovations protégées n'est pas très clair. L'impact sur l'innovation des patent boxes est difficile à évaluer de manière empirique, car la planification et la concurrence fiscales impliquent des erreurs de mesure dans les indicateurs d'innovation.
Qu'est-ce que la bonne pratique ?
En l'absence de données de comparaison sur l'efficacité des incitants fiscaux
spécifiques au R&D, plus de 80 incitants fiscaux ont été comparés dans 31 pays. La
comparaison se fonde sur vingt principes de bonnes pratiques, qui sont divisés en trois
A Study on R&D Tax Incentives
November 2014 11 catégories : 1) étendue de l'instrument : comment est-ce que l'incitant fiscal fonctionne, quelles dépenses sont concernées, 2) cible : est-ce que l'instrument cible certains types spécifiques d'entreprise, explicitement ou implicitement, et 3) pratique organisationnelle : comment est-ce que la procédure de requête fonctionne et l'incitant fiscal est-il évalué ?
L'un des principes de meilleures pratiques proposés dans ce rapport est que les crédits d'impôt en R&D basés sur le volume sont préférés aux incitants incrémentaux. Les incitants fiscaux en R&D incrémentaux peuvent pousser les entreprises à modifier le calendrier de leurs projets d'investissement en R&D. Par exemple, les incitants incrémentaux incitent les entreprises à augmenter progressivement leur investissement en R&D, plutôt que de faire un seul investissement important immédiatement, si les bénéfices de ces investissements se matérialiseront plus tard.
De plus, les incitants incrémentaux impliquent des frais administratifs et de conformité plus élevés. Les frais plus élevés des incitants progressifs ne sont apparemment pas compensés par une efficacité plus importante comme les simulations récentes le montrent - même pour une croissance faible de l'entreprise. La majorité des instruments se fondent sur le volume.
Une autre bonne pratique proposée dans ce rapport est que les incitants fiscaux doivent uniquement viser les activités R&D pouvant potentiellement contribuer aux connaissances mondiales, plutôt que de promouvoir les activités limitées à accroître l'expertise propre de l'entreprise. L'impact d'un incitant fiscal sur l'innovation dépend fortement de la rigueur de cette exigence de nouveauté. Sans aucune exigence de nouveauté, un incitant fiscal peut stimuler l'imitation plutôt que l'innovation.
Notamment pour les pays proches de la frontière technologie, un tel incitant pourrait réduire l'innovation au-lieu de la promouvoir. Les pays en retard en termes d'innovation peuvent rattraper leur retard plus vite s'ils permettent l’imitation d’innovations étrangères. Quelques schémas d'incitants fiscaux en R&D comportent des exigences d'innovation strictes, comme au Canada et au Royaume-Uni.
Les incitants fiscaux devraient s'appliquer idéalement aux types de dépenses qui entraînent de fortes diffusions de connaissances. Les incitants fiscaux basés sur le salaire payé aux chercheurs peuvent être considérés comme un exemple de bonne pratique dans ce contexte. Par exemple, parce qu'ils mènent probablement à une meilleure diffusion de connaissances que les autres types de dépenses en R&D : les chercheurs passent d'un employeur à l'autre et emportent avec eux les connaissances de leurs anciens employeurs. L'un des avantages pratiques des incitants fiscaux pour les salaires en R&D est qu'ils impliquent des frais administratifs et de conformité moins importants. Des crédits d'impôts pour les salaires des chercheurs sont proposés notamment aux Pays-Bas et en Belgique (voir tableau 5.2 pour un aperçu).
Les jeunes entreprises, plutôt que les PME en général, ont plus de chances de fournir des innovations qui concurrenceront les grandes entreprises. Un environnement favorable aux entrepreneurs contribuera non seulement aux innovations du pays, mais également à la flexibilité de son économie. Cibler de jeunes entreprises peut être considéré comme une meilleure pratique que cibler des PME. Un incitant qui a été identifié comme une bonne pratique et qui vise explicitement les jeunes entreprises, est le crédit fiscal français pour les Jeunes Entreprises Innovantes.
Comme les dépenses en R&D viennent plusieurs années avant les revenus générés par
l’innovation, ce serait une bonne pratique de fournir une facilité de crédit-pont, et une
possibilité de recevoir une allocation, même si l’entreprise n’est pas encore rentable
(remboursements en espèces). De telles fonctions offrent aux entreprises une plus
grande flexibilité et une meilleure assurance pour les décisions d'investissement. Cela
est notamment important pour les jeunes entreprises qui ne sont en général pas
rentables aux cours des premières années d’exercice. Alors que la plupart des
A Study on R&D Tax Incentives
November 2014 12 incitants fiscaux de R&D analysés proposent un crédit-pont, les remboursements en espèces sont uniquement proposés dans neuf pays.
En ce qui concerne l'organisation d'un incitant fiscal, une procédure unique de requête en ligne est une bonne pratique. Elle est déjà appliquée dans la majorité des pays. De plus, la durée de prise de décision des autorités fiscales sur les dépenses concernées doit être aussi courte que possible et ne pas dépasser une année. Plusieurs pays ont déjà mis en place l'option de recevoir un remboursement immédiat pour les petites entreprises car la liquidité de celles-ci est souvent limitée.
Des évaluations systématiques sont également recommandées. Des données de haute qualité sont indispensables au niveau des entreprises pour une évaluation quantitative rigoureuse. Elles doivent être collectées en respect de normes internationales. Dans dix-sept pays, aucune étude d'évaluation n'a été trouvée. Actuellement, seuls quelques pays font l'objet d'évaluations fréquentes, par exemple, les Pays-Bas et la France. La qualité des études d'évaluation est mitigée et dans de nombreux cas, elle ne satisfait pas les normes des publications universitaires spécialisées.
Classement des incitants fiscaux en R&D
Les scores des incitants fiscaux sur les vingt principes de meilleures pratiques ont été utilisés pour mettre au point un indice général. L’instrument qui a obtenu le score le plus élevé lors du benchmarking est le crédit d’impôt français pour les Jeunes Entreprises Innovantes. il fournit un soutien généreux à de jeunes PME, pour lesquelles les dépenses en R&D représentent au moins quinze pourcents des coûts totaux. La nécessité d’innovation en R&D est conforme à la meilleure pratique (« nouveau dans le monde »). L’option de remboursement immédiat et de temps de réponse court signifie que les entreprises peuvent recevoir plus rapidement un remboursement.
Le crédit d’impôt norvégien SkatteFUNN arrive en seconde position. Cet incitant, d’ordre surtout générique, offre un taux d’imposition préférentiel aux PME. La procédure de requête de crédit d’impôt en R&D est assez simple : les entreprises peuvent s’inscrire en ligne, une agence est disponible ainsi que plusieurs manuels.
L’introduction de la politique a impliqué une consultation publique, et elle a été évaluée à plusieurs reprises. La troisième position est occupée par les amortissements accélérés au Danemark, qui a obtenu des scores élevés pour la pratique organisationnelle, et qui ne cible pas un groupe spécifique d’organisations.
Au total, les quatre-vingt incitants fiscaux en R&D présentent une grande
hétérogénéité dans leurs formats et leurs pratiques organisationnelles. Cela reflète en partie les différences entre les caractéristiques des pays (comme les systèmes
d’innovation et les taux d’imposition) mais il y a également des opportunités
conséquentes d’amélioration des incitants fiscaux en R&D dans l’Union Européenne –
en particulier en ce qui concerne l’organisation et l’étendue de ces incitants.
A Study on R&D Tax Incentives
November 2014 13
Table of Contents
Summary ... 5
Résumé ... 9
1 Introduction ...17
1.1 R&D tax incentives and the innovation policy mix ...18
1.2 Main findings from the overview of R&D tax incentives ...20
1.3 Main findings from the literature survey ...20
1.4 Main findings on best practices ...22
1.5 Earlier surveys ...24
1.6 Outline ...25
2 Impact of R&D tax credits and allowances ...27
2.1 Impact on R&D expenditure ...27
2.1.1 Structural approach ...27
2.1.2 Direct approach ...31
2.1.3 Incremental and volume-based schemes ...34
2.1.4 Impact on wages ...35
2.1.5 Behavioural impact ...35
2.1.6 Impact heterogeneity ...36
2.2 Impact on innovation and productivity ...37
2.2.1 Innovation ...37
2.2.2 Productivity ...38
2.3 Tax incentives versus direct subsidies ...39
2.3.1 What policy instruments do firms choose? ...39
2.3.2 Effectiveness of direct subsidies ...39
2.3.3 Multiple treatments ...40
2.4 General welfare effects ...40
2.4.1 Evidence on private and social rates of return to R&D ...40
2.4.2 Social cost-benefit analysis ...41
2.4.3 Aggregate impact and stability ...41
3 Corporate taxation and the location of R&D activity and patents ...43
3.1 Sensitivity of location to corporate taxation ...43
3.2 Patent boxes ...45
4 Challenges for evaluation ...47
4.1 Challenge 1: methodology ...47
4.1.1 Reverse causality ...47
4.1.2 Selection bias ...48
4.1.3 Adjustment costs ...48
4.1.4 Re-labelling and changes in input prices ...48
4.1.5 Multiple treatments ...49
4.1.6 Publication bias ...49
4.2 Challenge 2: gaps in the literature ...49
5 R&D tax incentives in the EU and selected OECD countries ...51
5.1 Scope ...51
5.1.1 Type of R&D tax incentive ...51
5.1.2 Incremental and volume-based schemes ...54
5.1.3 Incentive base ...55
5.1.4 Tax base ...58
5.1.5 Novelty of R&D outcome ...59
5.2 Targeting ...60
5.2.1 Explicit targeting ...60
5.2.2 Implicit targeting ...62
5.3 Organization ...64
5.3.1 Generosity...64
5.3.2 Administration ...69
A Study on R&D Tax Incentives
November 2014 14
5.4 Clustering analysis ...71
6 Benchmarking R&D tax incentive designs ...73
6.1 Principles of good practice ...73
6.1.1 Scope ...75
6.1.2 Targeting ...77
6.1.3 Organization ...79
6.2 Methodology ...81
6.3 Benchmarking results ...83
6.4 Data availability ...89
6.5 Limitations of benchmarking ...91
6.6 Summary of good practice cases ...91
7 Conclusions ...95
References...99
Annex 1. Methodology ... 107
Hierarchical Clustering ... 107
Robustness of benchmarking results to choice of weights ... 107
Annex 2. Detailed scores on scope ... 109
Annex 3. Detailed scores on targeting ... 112
Annex 4. Detailed scores on organization... 115
Annex 5. Complete ranking of R&D tax incentives ... 118
Annex 6. Average benchmark score per country ... 121
Annex 7. Ratings for 10 countries ranked highest by overall score ... 122
A Study on R&D Tax Incentives
November 2014 15
List of figures
Figure 1.1 Gross domestic expenditure on R&D (% of GDP) ...18
Figure 5.1 Description of different types of R&D tax incentives ...52
Figure 5.2 Use of incremental and volume-based schemes across countries ...54
Figure 5.3 Definition of novelty for R&D tax incentives across countries ...59
Figure 5.4 Targeting of schemes across countries ...61
Figure 5.5 Business R&D intensity and government support to R&D, 2011 ...65
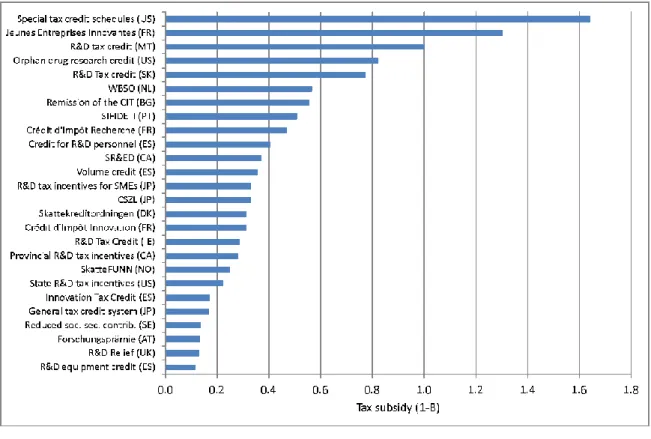
Figure 5.6 Tax subsidy rates on R&D expenditure for OECD countries, 2013 ...65
Figure 5.7 Tax subsidy rates volume-based R&D tax credits ...66
Figure 5.8 Tax subsidy rates for untargeted volume-based R&D tax credits ...67
Figure 5.9 Tax subsidy rates for R&D tax credits targeted at SMEs and start-ups ...68
Figure 5.10 Effective corporate tax rates for income derived from patents ...68
Figure 5.11 Dendrogram of country similarity for R&D tax incentives ...71
Figure 6.1 Histogram of benchmarked 3r scores ...83
Figure 6.2 Dispersion of benchmark scores per country ...84
Figure 6.3 Benchmark scores for R&D tax credits ...87
Figure 6.4 Benchmark scores for enhanced allowances for R&D ...88
Figure 6.5 Benchmark scores accelerated depreciation ...89
List of tables Table 2.1 Estimates of the user cost of R&D capital elasticity ...30
Table 2.2 Direct estimates of treatment effects of R&D tax incentives ...33
Table 2.3 Mean user cost elasticities for volume-based and incremental schemes .34 Table 5.1 Popularity of R&D tax incentive instruments ...53
Table 5.2 Incentive bases used across countries ...56
Table 5.3 Detailed incentive base across countries ...57
Table 5.4 Tax bases used across countries ...58
Table 5.5 Implicit targeting ...63
Table 5.6 Government expenditure on R&D tax incentives (mln EUR) ...69
Table 5.7 Administrative features among countries ...70
Table 6.1. Summary of principles of good practice ...74
Table 6.2 Ranking of R&D tax incentives - top 10 ...85
Table 6.3 Average benchmark score per type of tax incentive ...87
Table 6.4 Data availability per country ...90
Table 6.5 Summary of selected good practice cases...94
A Study on R&D Tax Incentives
November 2014 16
A Study on R&D Tax Incentives
November 2014 17
1 Introduction
Europe 2020, the strategy for growth set out by the European Commission, puts investment in research and development (R&D) as one of the five priorities for Europe to become more competitive.
3By the year 2020, European investment in R&D should reach at least three percent of gross domestic production (GDP). The target of three percent is ambitious given that expenditure on R&D was about 2.1 percent in 2012.
However, progress has been made, as in the period before 2007 expenditure was 0.3 percentage point smaller than it currently is.
The financial crisis has impacted the course for reaching the target in various ways.
First, the financial crisis obliged many governments to introduce tough fiscal consolidation measures, prioritizing other issues over R&D. In 2012 the share of public R&D expenditure in total government spending was lower than in 2007 for half of the EU member states
4. The urgency to balance expenditure on innovation against expenditure on other policies, calls for clarity on the performance of the different innovation policy instruments.
Second, the drop in economic activity put even more emphasis on the need to find new sources of growth. Innovation is such a source - and one which is underutilized in Europe: recent evidence suggests that European firms have significantly lower rates of return in R&D than American firms (Cincera and Veugelers, 2014).
The conviction that innovation policy can reduce budget deficits by stimulating economic growth is part of the “smart consolidation” approach. This approach considers innovation policy to be part of the solution rather than part of the problem.
For smart consolidation to work, innovation policy needs to be very effective in increasing innovation - otherwise other policies (including reducing taxes) might be preferable. In addition, innovation policy needs to be effective in the context of a severe recession, which raises the bar as firms are challenged by a lack of demand for their (new) products. The gap of innovative performance between the member states is closing. However, there are still significant differences. Traditionally, the most innovative countries - Sweden, Denmark, Germany and Finland - are performing around three times better than the least innovative states (European Commission, 2014). These countries also have the highest gross domestic expenditure on R&D relative to GDP (see Figure 1.1 below).
The scope for policies to support more innovation in the high-performing countries might be limited, but there could be substantial opportunities for the other Member States to catch-up, as shown by the example of Slovenia and Estonia.
Catching-up of countries with low R&D expenditures is also crucial for Europe as a whole to reach the goals set out in the Europe 2020 strategy. This requires that especially under-performing countries need to revise their policies regarding innovation. Learning from the experiences of other countries can be valuable for upgrading innovation policy.
3
The other targets relate to employment, climate change and energy sustainability, education, and poverty and social exclusion
4
Eurostat data on “Share of government budget appropriations or outlays on research and development as % of total general government expenditure”, available at:
http://epp.eurostat.ec.europa.eu/tgm/table.do?tab=table&init=1&language=en&pcod
e=tsc00007&plugin=0
A Study on R&D Tax Incentives
November 2014 18 Figure 1.1 Gross domestic expenditure on R&D (% of GDP)
Source: Eurostat, Gross domestic expenditure on R&D, 2014
The foregone tax revenue of R&D fiscal incentives is substantial. Thus, understanding the effectiveness of this policy instrument is ever more important in times when governments look for ways to balance budgets and find new sources of growth. This study aims to facilitate this task and motive better policy by:
1. providing insight in the effectiveness of R&D tax incentives 2. giving an overview of existing R&D tax incentives, and 3. identifying good practices and benchmarking policies.
1.1 R&D tax incentives and the innovation policy mix
Why should governments have policies that stimulate innovation? It is widely agreed that technological change is an important contributor to long-term growth (Aghion and Howitt, 1992; Romer, 1990). New ideas translate in new and better products and improved productivity, which eventually increases general welfare. But markets left on their own will probably generate less innovation than would be desirable from society’s point of view. The reason is that knowledge is not completely excludable: ideas can be easily copied and used by other firms. Non-excludability discourages firms to invest in research since the returns to investment will not entirely accrue to the firm. The social rate of return on R&D is thus higher than the private rate of return. This externality leads to suboptimal outcomes for society (Arrow, 1962).
A second reason why markets might fail to deliver sufficient innovation is that investments in research are more risky. This makes it more difficult for investors and banks to monitor innovative firms: information asymmetry between the innovator and the investor is large. As a result, firms will find it difficult to obtain funding. Especially
0 0.5 1 1.5 2 2.5 3 3.5 4
FI SE DK DE AT FR BE EU 28 NL NO LU SL CZ IE ES PT IT EE HU LT HR EL LV PL MT RO SK BG CY
GERD (% o f GD P )
2012
2007
A Study on R&D Tax Incentives
November 2014 19 young innovative enterprises suffer from this problem as they lack collateral and track record.
5R&D tax incentives are one of the most popular innovation policy tools. Essentially, they reduce taxes for firms that have R&D expenditure (input-related R&D tax incentives) or for firms that have income from commercializing intellectual property rights (output-related R&D tax incentives). Input-related R&D tax incentives decrease the price of R&D inputs faced by firms, which makes it more attractive to engage in R&D. Output-related R&D tax incentives increase the returns from innovative products that are protected by IPR. This should motivate firms to invest in innovation or to attract foreign R&D firms.
In the recent years, R&D tax incentives have gained attention. Currently, 26 EU and 27 OECD member states provide fiscal incentives for R&D.
6The advantage of R&D tax incentives lies in their generic nature: decisions on R&D investments are left to the market and are not steered by the government. In general, profit-maximizing agents are more likely to make more efficient allocations than central authorities (a general reference is Hart et al. (1997)).
A drawback of R&D tax incentives is that firms will first invest in projects with highest private, rather than social returns (Hall and Van Reenen, 2000). Public research and subsidies for private research do not have this bias towards private returns as the government can directly influence the type of supported projects.
Public research and subsidies for private research could also be more effective than R&D tax incentives when the commercialization of products is extremely difficult to keep exclusive to the firm, like education or health. These types of projects do not provide attractive investment opportunities, no matter how low the offered tax rate would be. Innovation of this kind can be considered a public good
7and will only be provided if it is financed directly by the government.
8Direct government funding for private research has several disadvantages vis-à-vis R&D tax incentives. First, it results in substantially larger administrative costs.
Furthermore, government do not have an information advantage as to which projects will succeed or potentially bring highest social returns. Besides, the quality of decisions on subsidies can be eroded by short-term political goals and impacted by lobbying (Hall and Van Reenen, 2000).
More pragmatically, R&D tax incentives can be effective tools to reach the targets set under the Europe 2020 strategy as foregone tax revenue accounts is considered government expenditure on R&D policy. They can also be used to attract international footloose R&D (OECD and World Bank, 2014).
9Yet, innovation does not happen in a closed system but in an open environment. Thus, whether instruments targeted at raising the level of R&D, like R&D tax incentives, will result in more innovation depends on framework conditions. Framework conditions include the availability of skilled labour, infrastructure, universities, competition
5
Although tax incentives and subsidies might reduce the need for external finance, they do not mitigate the underlying problem of information asymmetry
6
Based on the finding of this report and OECD (2013) OECD Science, Technology and Industry Scoreboard 2013, OECD Publishing.
7
A good that is both non-rival and non-excludable is known as a public good (Cornes and Sandler, 1986).
8
Alternative ways to finance public goods are advertising and crowd-sourcing.
9
World Bank and OECD: Innovation Policy Platform: Fiscal Measures. Available at:
https://www.innovationpolicyplatform.org/ipp/filters/result-page?topic-filters=12308
A Study on R&D Tax Incentives
November 2014 20 environment, as well as the strength of intellectual property rights. Policies targeted to those elements can have a very strong impact on the type and amount of R&D performed by firms.
1.2 Main findings from the overview of R&D tax incentives
The overview of R&D tax incentive schemes presented in this report shows that 26 EU member states currently have some type of fiscal encouragement for R&D investments. The OECD countries selected for this study (Canada, USA, Japan, Israel and Norway) offer fiscal advantages for R&D activities as well. Most of the countries surveyed have more than one R&D tax incentive in place. The design and implementation of policy instruments varies substantially across countries – and sometimes within countries as well.
The majority of tax incentives apply to corporate income taxes, yet in eight countries benefit is (additionally) set against social contributions and/or wage taxes. R&D tax credits are the most popular type of R&D tax incentive (introduced in 21 countries), followed by enhanced allowances for expenditure on R&D (sixteen countries) and accelerated depreciation (thirteen countries). In the past years tax benefits for income from innovation, patents boxes, have also gained popularity: currently, eleven EU member states offer such an incentive.
In the past fifteen years R&D tax incentives that apply to the total R&D expenditure (volume-based schemes) have become considerably more common than tax benefits that apply only to the increment of R&D expenditure (incremental schemes). As of today, only seven countries offer incremental tax incentives in addition to volume- based, and in Ireland and the United States the ‘incremental’ part of the design is phasing out.
R&D tax incentives are frequently targeted to specific groups of firms. The most widespread form of targeting, is to offer a more generous tax advantage to SME’s:
currently ten countries have such a practice. In six countries the benefit is higher for young firms and in several countries the legal status of the applicant is important (in Canada, for example, foreign-owned companies receive a less generous tax reduction). In order to limit the government costs and indirectly provide more generous (marginal) support to smaller firms, five countries have the generosity of the scheme decreasing with the size of a firm’s R&D expenditure. In addition, most countries put a ceiling on the amount that firms can receive. In terms of organization of the R&D tax incentives, most countries offer firms an online application procedure and a one-stop agency (one institution, where all relevant matters can be settled).
Evaluations of the tax instruments have been carried out in fourteen countries, yet only in six countries they are embedded in the legal system.
1.3 Main findings from the literature survey
The report covers a large body of literature assessing the impact of R&D tax credits.
The vast majority of studies surveyed concludes that R&D tax credits spur investment in R&D. The estimates of the size of this effect are widely diverging and not always comparable across methodologies. The wide range of results probably reflects differences in methodology as well as differences between countries and policies, but is difficult to disentangle those effects. Studies that are more rigorous econometrically and yield more precise estimates find that one euro of foregone tax revenue on R&D tax credits raises expenditure on R&D by less than one euro (Cornet and Vroomen, 2005; European Commission, 2008; Lokshin and Mohnen, 2012; Mulkay and Mairesse, 2013).
The impact of R&D tax credits on R&D expenditure is informative on the effectiveness
of R&D tax credits, but this is only a part of the puzzle. A second piece of the puzzle is
A Study on R&D Tax Incentives
November 2014 21 the answer to the question whether R&D tax credits make firms more innovative and productive. The impact of R&D tax incentives on innovation and productivity by firms receiving those benefits, however, is less studied. R&D tax incentives appear to have a positive impact on innovation, although none of the studies has used exogenous variation to verify the causality of the relation.
Payroll withholding tax credits may have an upward effect on the wages of R&D workers Cornet and Vroomen (2005) and Lokshin and Mohnen (2013). Goolsbee (1998) found the same effect for the total government expenditure on R&D in the United States. This is additional evidence of the effectiveness of tax credits: a rise in demand is expected to lead to higher prices in most markets.
The effects of R&D tax incentives vary across sub-groups of firms, with most studies focusing on firm size. The results seem to differ across countries, which makes it difficult to draw clear conclusions. In some of the countries analysed, SME’s tend to respond more strongly to the support for R&D, while the reverse was found in other countries. It is not clear whether differences in outcomes are due to tax incentive characteristics, other country characteristics, methodology, or something else. There is some evidence that the impact for start-up firms can exceed the average impact, but in general, there is not much evidence on how effectiveness of tax incentives varies with firm age. There is a clear literature gap in identifying whether the impact differs across firms with different legal status.
Estimates of the social rate of return to R&D are variable and imprecise but tend to exceed estimates of the private rate of return to R&D (Hall et al., 2009). This indicates that there is a scope for innovation policy to raise welfare. Recent evidence suggests that knowledge spillovers of large firms exceed those of small firms (2013). This finding provides an argument against targeting tax incentives towards SMEs. On the other hand, SMEs tend to respond more strongly to R&D tax incentives. This suggests that targeting on SMEs still could be efficient.
Social cost-benefit analyses for The Netherlands, Canada and Japan showed that R&D tax credits can have positive welfare effects but that this outcome is highly sensitive to assumptions (Parsons and Phillips, 2007; Russo, 2004; Ghosh, 2007; Mohnen and Lokshin, 2008; Cornet, 2001; Diao et al., 1999).
The impact of R&D tax credits may be highly sensitive to their design and implementation. The different results found for SMEs across countries are indicative of this. However, evidence on the effects of design features is inconclusive for some features, while for evidence is lacking altogether for other features. An important aspect of R&D tax credits is whether they apply to incremental R&D expenditure or whether they are “volume-based”. Both kinds of designs have been evaluated, and both of them have been found to result in additional R&D expenditure. The variation in estimates across studies is too large to be able to conclude that there is a statistically significant difference between the effectiveness of incremental and volume-based schemes.
Lester and Warda (2014) oppose the general perception that only volume-base R&D tax schemes result in dead-weight loss. They simulate different policy scenarios on different types of firms and find that even at low levels of growth the cost effectiveness of the two types of schemes will be the same.
Whether R&D tax incentive schemes targeted at cooperation between firms or public research institutes lead to higher additionality, is understudied. Research cooperation between competitor companies is shown to lead to collusive outcomes in the product market (Duso T. et al., 2014).
A large body of literature has identified that multinational firms increasingly engage in
profit-shifting activities in order to decrease the overall tax liabilities. Intangible
A Study on R&D Tax Incentives
November 2014 22 assets, like patents, play an important role as they are relatively easy to move from one location to other. In addition, for large firms innovation often is an international activity: firms may perform R&D in one country, patent the product in another and commercialize it in a third one. Studies show that a strong negative relation persists between corporate income tax and the number of patents registered in a country.
Patents with a higher potential profitability appear to be especially sensitive to corporate income taxes.
Patent boxes can result in large decreases in tax revenue for all governments engaging in such a policy (Griffith et al., 2014). Furthermore, it is hard to make the argument why a patent box would reduce market failure caused by knowledge spillovers: patent boxes introduce a preferential rate for income from innovations that are already protected by IPR. The impact on innovation of patent boxes is difficult to evaluate empirically as tax planning and tax competition induce measurement error in innovation indicators.
Comparing the effectiveness of R&D tax incentives across countries is a challenging task. Most R&D tax incentives have not been evaluated quantitatively, making it impossible to compare them directly. When an evaluation study is available, it is difficult to compare the results with other evaluations as evaluation studies differ wildly in their methodology. Moreover, similar R&D tax incentives might have very different impacts due to differences in framework conditions.
1.4 Main findings on best practices
In the absence of comparable evidence on the performance of specific R&D tax incentives, more than 80 tax incentives in 31 countries
10have been benchmarked. The benchmarking is based on twenty principles of best practice, which are divided over three categories: 1) scope of the instrument: how does the tax incentive work, which expenditures are eligible, 2) targeting: does the instrument target specific types of firms, explicitly or implicitly, and 3) organizational practice: how does the application procedure work and is the tax incentive evaluated?
One of the best practice principles proposed in this report is that volume-base R&D tax credits are preferred over incremental ones. Incremental R&D tax incentives may distort optimal investment planning and result in higher administrative and compliance costs. These higher costs of incremental schemes are probably not offset by a greater effectiveness of incremental schemes as recent simulations indicate - even for low levels of firm growth. The vast majority of instruments are volume-based.
Another principle proposed in this report is that tax incentives should only be aimed at R&D activities that are likely to contribute to the world-wide stock of knowledge, rather than support activities limited to advancement in firm’s own state of expertise.
The impact of a tax incentive on innovation will depend strongly on the strictness of its novelty requirement. Without any novelty requirement, a tax incentive could stimulate imitation, rather than innovation. Such a scheme could reduce innovation instead of promoting it. A number of R&D tax incentive schemes have strict novelty requirements (see Table 5.3 for an overview of novelty requirements across countries).
Tax incentives should ideally apply to those types of expenditures that bring about strong knowledge spillovers. Tax incentives based on the wage bill paid to researchers can be considered best practice in this context, for example because researchers move from one employer to another. A practical advantage of tax incentives for R&D wages
10
Note that in total 33 countries were included in the analysis of the report. However,
two EU countries- Estonia and Germany- do not offer R&D tax incentives. Thus, those
two countries were not included in the benchmarking
A Study on R&D Tax Incentives
November 2014 23 is that they have lower administration and compliance costs. Tax credits for researcher wages can be found in The Netherlands and Belgium, amongst others (see Table 5.2 for an overview).
Young companies, rather than SMEs in general, are probably more likely to bring the innovations that challenge large incumbent firms. Targeting young companies can be considered a better practice than targeting SMEs. A scheme that explicitly targets young firms is the French Jeunes Entreprises Innovantes. An overview of all countries can be found in Figure 5.4.
As R&D expenditure may precede revenue generated by innovation by several years, it is good practice to provide a carry-over facility and an option to receive the benefit even in case a company is not profitable (cash refunds). Such features offer firms more flexibility and certainty for investment decisions. This is especially relevant for young companies that typically are not profitable in the first years of operations. While most of the R&D tax incentives analysed offer a carry forward facility, cash refunds are available only in nine countries (see full list in Table 5.5).
With respect to the organization of a tax incentive it is good practice to have a one- stop, online application procedure. This is already in place in majority of the countries.
In addition, the time it takes for tax authorities to make a decision on eligible expenses should be as short as possible, not exceeding a year. Several countries have already introduced an option to receive an immediate refund for smaller companies, as these firms are typically more liquidity constrained.
Systematic evaluations are also recommended. High-quality firm-level data is indispensable for a rigorous quantitative evaluation and should be collected according to international standards. Currently, only few countries have frequent evaluations, for example, The Netherlands and France.
The scores of tax incentives on the twenty best practice principles are used to compute an overall index. The instrument that has the highest overall benchmarking score is the French tax credit for young innovative enterprises (Jeunes Entreprises Innovantes), due to high scores on scope and organizational practice. The Norwegian SkatteFUNN tax credit comes second, mainly because of its first place for organization.
The third position is taken by the Accelerated amortization in Denmark, with high scores on targeting and organization.
Overall, the eighty R&D tax incentives show substantial heterogeneity in their designs and organizational practice. Tax credits distinguish themselves from enhanced allowances and facilities for accelerated depreciation primarily because of their higher score on scope. Patent boxes have the smallest average score on scope. The heterogeneity of practices not only is present between types of tax incentives;
differences among schemes of the same type are also large.
Heterogeneity in the features of tax incentives is likely to reflect differences in country
characteristics (like innovation systems and tax rates), but also within countries there
is sometimes a large discrepancy between the highest ranked instrument and the
instrument with the lowest rank. This suggests that there are substantial opportunities
for improving R&D tax incentives across the European Union - in particular with
respect to the organization and scope of the tax incentives.
A Study on R&D Tax Incentives
November 2014 24 1.5 Earlier surveys
Several reports and academic articles provide overviews of R&D tax incentives and their effectiveness.
11Köhler et al. (2012) conclude that R&D tax incentives have a positive impact on R&D expenditure, although estimates vary substantially and mostly represent schemes that were in place in the 1980s and 1990s. They note that a positive impact is found for all types of R&D tax incentives and that volume-based incentives and R&D tax credits appear to have the largest effects on R&D expenditure.
Köhler et al. indicate that the impact on outcomes other than R&D expenditure are less studied and little can be said about the long-run welfare effects of R&D tax incentives.
Köhler et al. make several policy recommendations: schemes should be differentiated by firm size or the amount of R&D expenditure (e.g., by introducing caps). This report surveys new evidence that questions the targeting of SMEs: Bloom et al. (2013) which suggest that large firms generate larger spillovers than small firms. Köhler et al.
further propose that for firms that have used the the R&D tax scheme for some time, a lower rate should be applied.
Ientile and Mairesse (2009) also conclude that the impact of R&D tax credits on R&D investment is quite heterogenous, likely sensitive to the country analysed and methodology used. They noted that while the R&D tax incentives appear to be efficient in Norway and France, evaluations for Spain and The Netherlands provide less convincing results. They also encourage more research on the impact on second- and third-order effects, like impact on productivity, innovation outputs and the welfare effects. Ientile and Mairesse further suggest that a comparability between the studies should be enhanced through aligning on the addressed questions, methodologies used and ways the results are presented.
More technical surveys of the empirical evidence and methdologies used in the evaluations of R&D tax incentives are provided in Hall and Van Reenen (2000) and the European Commission (2008). Both explain the different approaches undertaken in the evaluations, their advantages and benefits. The survey by Hall and Van Reenen is the only one that gives a quantitative assessment of how much additional R&D expenditure is induced by R&D tax credits. They conclude that one dollar spent on R&D tax credits translates in about one additional dollar spent in private R&D. Based on evidence presented in more recent studies this report concludes that the impact of R&D tax credits probably is smaller.
The report of European Commission (2008) discusses the advantages and shortcomings of each evaluation method. They conclude that there is no one ‘perfect’
way how to assess the effectiveness of the schemes and that the evaluation is challenged by various data and methodological limitations. To increase our understanding about the impact of R&D tax incentive designs, comparability across studies should be promoted through exploiting similar data and methodologies.
Lokshin and Mohnen (2008) and Hall and Van Reenen (2000) note that measuring the bang-for-the-buck (BFTB) is important, but that this does not replace social cost- benefit analysis. Even if the BFTB lies below one, the scheme may still result in generating higher welfare due to the positive spillover effects.
11