SFB 649 Discussion Paper 2008-033
Are CEOs in Family Firms Paid Like Bureaucrats?
Evidence from Bayesian and Frequentist Analyses
Jörn Hendrich Block*
* Technische Universität München, Germany
This research was supported by the Deutsche
Forschungsgemeinschaft through the SFB 649 "Economic Risk".
http://sfb649.wiwi.hu-berlin.de ISSN 1860-5664
SFB 649, Humboldt-Universität zu Berlin Spandauer Straße 1, D-10178 Berlin
S FB
6 4 9
E C O N O M I C
R I S K
B E R L I N
Are CEOs in Family Firms Paid Like Bureaucrats?
Evidence from Bayesian and Frequentist Analyses
JÖRN HENDRICH BLOCK Technische Universität München
Dr. Theo Schöller Chair in Technology and Innovation Management Arcisstr. 21, D-80333 München
Tel: 0049 89-28925746 Fax: 0049 89-28925742 e-mail: block@wi.tum.de
ABSTRACT
The relationship between CEO pay and performance has been much analyzed in the management and economics literature. This study analyzes the structure of executive compensation in family and non-family firms. In line with predictions of agency theory, it is found that the share of base salary is higher with family-member CEOs than it is with non- family member CEOs. Furthermore, family-member CEOs receive a lower share of option pay. The paper’s findings have implications for family business research and the executive compensation literature. To make the findings robust, the statistical analysis is performed with both Bayesian and classical frequentist methods.
JEL Codes: G30, J30, M52
Keywords: Executive compensation, family firms, stock options, agency theory, Bayesian analysis
* I would like to thank Thomas Daffner, Andreas Riemann, Gaurav Rishi, Frank Spiegel, and Marc Weiglein for excellent research assistance. All remaining errors are mine. This research was supported by the Deutsche Forschungsgemeinschaft through the SFB 649 “Economic Risk”.
The relationship between CEO pay and performance has been a central and recurrent issue in the management and economics literatures alike (e.g., Frey and Osterloh, 2005; Hall and Liebman, 1998; Jensen and Murphy, 1990a; Tosi et al., 2000). In 1990, Jensen and Murphy argued that executive pay is virtually independent of performance and that, on average, most CEOs are paid like bureaucrats (Jensen and Murphy, 1990b). With the strong increase of stock options in CEO pay over the last decades, however, the situation has changed: the link between executive pay and performance has become much stronger (Hall and Liebmann, 1998; Hall, 2003). The discussion in the media and the academic literature has also turned and now concerns as well the adverse effects of an overly strong link between executive pay and firm performance (e.g., Frey and Osterloh, 2005; Useem, 2003; The Economist, 2006). The claim gets made that an overly strong link between executive pay and stock performance leads managers to focus too strongly on short-term profits at the expense of long-term opportunities (Fuller and Jensen, 2002) and that they neglect to pay dividends to the firm’s shareholders (Lambert, Lanen, and Larcker, 1989). So far, however, the discussion has largely ignored the fact that a sizeable number of publicly listed firms in the U.S. and other industrialized countries are family owned or family managed.1 This paper aims to close this gap and analyzes the structure of executive pay in family firms, in particular its respective shares of base salary, annual bonus, long-term incentive plans, stock, and stock options. The main focus of this paper is on the role of incentive pay. From an agency theory perspective, it is unclear whether family firms have a higher or a lower share of incentive pay.
On the one hand, standard principal-agent theory predicts a low share of incentive pay.
Family-managed firms often resemble owner-managed firms, in which an agency conflict between owners and management is unlikely to occur. Bonding mechanisms to solve such an
1 In the U.S., depending on the exact definition used, the share of family firms among the Fortune 500 firms ranges from 7 to 37% (Villalonga and Amit, 2006). For an international comparison on the importance of family firms, see La Porta, Lopez-De-Silanes, and Shleifer (1999).
agency conflicts are, therefore, not necessary in the first place (Jensen and Meckling, 1976).2 On the other hand, when executive pay in general and incentive pay in particular are regarded more as a potential source rather than a solution to an existing agency problem (Bebchuk and Fried, 2003), an alternative view is possible. Clever executives have the power to manipulate the remuneration process to benefit themselves at the expense of the company (Bebchuk, Fried, and Walker, 2002). In particular, stock-based pay is being criticized as being vulnerable to manipulation (Dechow, Hutton, and Sloan, 1996). Family executives are in a strong position to manipulate the remuneration process. Since they have known the business for a long time (they have often grown up with the business), they have a strong information advantage over non-family board directors. Furthermore, due to their relatively strong position in the firm (they are often important shareholders themselves), they have a strong influence on the composition of the remuneration board. Thus, a family CEO might use his or her firm as a vehicle to generate private benefits of control, which are to the detriment of the company and its less powerful shareholders (Claessens et al., 2002; Morck and Yeung, 2003).
The findings of this paper support the argument that agency conflicts between owners and management are lower in family firms versus non-family firms. It is found that both family management and the degree of family ownership increase the share of base salary. In addition to this, a negative relationship between family management and the share of stock option pay is found. There seems to be a strong alignment of interests between a family CEO and the firm for which he or she works. An alternative interpretation is that family managers are intrinsically more strongly motivated to behave in the firm’s best interest. With its findings, the paper contributes to the discussion on the motivation of family CEOs to act in the interest of the firm (e.g., Corbetta and Salvato, 2004). The main contribution of this paper
2 Schulze et al. (2001) take a different view and argue that private ownership and owner-management do not eliminate the agency conflict but just create another type of agency conflict. In their view, family firms are exposed to a self-control problem caused by the altruism of family managers towards members of their own family. In such a situation, bonding mechanisms would then help to better align the interests of a family manager with the interests of the firm and its non-family shareholders.
is to show that family firm characteristics actually make a difference in regards to the structure of executive pay. Thus far, the discussion about the use and effectiveness of stock options has not taken into account family business variables (e.g., Dittmann and Maug, 2007).
Finally, the paper also contributes to the discussion on using Bayesian methods in management research (e.g., Hahn and Doh, 2006). In contrast to other disciplines, management research rarely employs Bayesian methods. This paper shows that Bayesian methods can provide a useful robustness check. Unlike classical methods, the Bayesian approach does not rely on statistical tests and asymptotic theory. The results are, therefore, more robust when multicollinearity and other problems affecting the quality of statistical tests are present (Leamer, 1973), as they often are in management research.
The remainder of the paper is constructed as follows. Section 2 derives hypotheses about the structure of executive pay in family firms. The next section then describes the data and introduces the methods used, in particular the Bayesian approach. Section 4 reports the results of the statistical analysis. Finally, Section 5 discusses implications of the findings from a research and management perspective and gives a brief conclusion.
THEORY AND HYPOTHESES
One of the main goals of CEO pay is to align the interests of a CEO with the interests of a firm’s shareholders. A large theoretical literature has analyzed how a manager’s compensation contract should be designed to accomplish this goal. Most of these articles rely on some kind of principal-agent model to derive their conclusions. One of the important assumptions underlying most of these contributions is that the interests of the CEO and the interests of the shareholders of a firm differ to a substantial degree. To solve this problem, incentives should be given to align the interests of the two groups. Or, as Jensen and Murphy (1990b) put it, managers should be paid not like bureaucrats but like value-maximizing entrepreneurs. Generally, aside from problems related to performance measurement (Baker,
1992), cooperation and coordination (Gibbons, 1998) or multitasking (Holmstrom and Milgrom, 1991), the more the interests of the two groups differ, the larger the sensitivity of pay to performance should be. An interesting case emerges with family management, though.
For many reasons, the situation of a manager with kinship ties to the business-owning family differs from that of a non-family manager. What are these differences, and how do they relate to the structure of executive pay?
Family management and the structure of executive pay
Family CEOs differ from other CEOs in a number of respects. First, for family CEOs, the firm is not just an employer that can be left easily. The firm symbolizes the heritage and tradition of their family and is likely to be part of their identity. That is why family CEOs are unlikely to act strongly against the interests of the firm; in the end, doing so would harm also themselves. This becomes even more evident when family CEOs bear the firm’s name; in such cases, their reputation in the public is linked to the well-being of the firm (Dyer and Whetten, 2006; Uhlaner, Goor-Balk, and Masurel, 2004; Wiklund, 2006). Besides this high value of integrity, strong feelings of identity lead family managers to seek self-actualization in terms of achieving firm goals rather than individual goals (Corbetta and Salvato, 2004; Davis, Schoorman, and Donaldson, 1997). Second, one of the main goals of family managers is to pass the firm on to the family’s next generation (Casson, 1999; James, 1999). To achieve this goal, they pursue long-term oriented business strategies such as investing in R&D (Block and Thams, 2007; Le Breton-Miller and Miller, 2006) or keeping good relations with the firm’s employees (Block, 2008), strategies that, in some cases, may not be well perceived by the stock market (because, for example, they might cut dividends to make necessary investments in R&D). Third, and linked to the first two aspects, is the fact that the goals of family managers are often non-financial by nature (Donckels and Frohlich, 1991; Harris and Martinez, 1994; Tagiuri and Davis, 1992). For example, it is difficult to express a goal such as
preserving the family’s craft and reputation in monetary terms. The same is true for the goal of transferring the firm to the next generation or the goal of independence.
To summarize, the interests of a family CEO are often strongly aligned with the firm’s long-term interests. For the several reasons given above, family CEOs are intrinsically strongly motivated to act in the firm’s best interest. Giving high-powered incentives in such a situation may not be a good idea. Individuals might shift their locus from the activity itself to the reward or sanction; intrinsic motivation might be crowded out (Deci and Ryan, 2000; Frey and Osterloh, 2005). The importance of non-financial goals for non-family CEOs creates another problem. It is difficult to design a compensation contract contingent on non-financial goals since, in most cases, such goals are difficult to observe or measure (e.g., consider the goal of keeping good relations with employees or suppliers or the goal of independence).
Based on these two arguments, the compensation contract of a non-family CEO should be low-powered (i.e., it should include only a low level of incentives). Accordingly, the following five hypotheses should hold:
Hypothesis 1a. There is a positive relationship between the CEO being a member of the founding family and the share of base salary in total pay.
Hypothesis 1b. There is a negative relationship between the CEO being a member of the founding family and the share of annual bonus in total pay.
Hypothesis 1c. There is a negative relationship between the CEO being a member of the founding family and the share of payment due to long-term incentive plans in total pay.
Hypothesis 1d. There is a negative relationship between the CEO being a member of the founding family and the share of stock pay in total pay.
Hypothesis 1e. There is a negative relationship between the CEO being a member of the founding family and the share of stock option pay in total pay.
Family ownership and the structure of executive pay
I expect the level of family ownership and the share of incentive pay to be negatively related for the following reasons.
Agency theory states that, in a situation in which the principal has information to verify the agent’s behavior, then the agent is more likely to behave in the interests of the principal (Eisenhardt, 1989; Jensen and Meckling, 1976). Agency theory further states that, in a situation in which the principal has information about the behavior of the agent, an outcome- based contract is suboptimal because it needlessly transfers risk to the agent (Eisenhardt, 1989). Hence, in a situation of low information asymmetry between shareholders and management, the fixed component of pay should be high, and incentive pay should be low.
Referring to the discussion of family versus non-family owners, one can argue that family owners know their firm and the underlying business model better than non-family owners do.
In contrast to non-family owners, family owners have often grown up with the firm and know the business and its management team very well (Ward, 2004). The following five hypotheses should apply:
Hypothesis 2a. There is a positive relationship between the extent of family ownership and the share of base salary in total pay.
Hypothesis 2b. There is a negative relationship between the extent of family ownership and the share of annual bonus in total pay.
Hypothesis 2c. There is a negative relationship between the extent of family ownership and the share of payment due to long-term incentive plans in total pay.
Hypothesis 2d. There is a negative relationship between the extent of family ownership and the share of stock pay in total pay.
Hypothesis 2e. There is a negative relationship between the extent of family ownership and the share of stock option pay in total pay.
DATA AND METHOD
Sample Construction
The Standard & Poor’s 500, as of July 31, 2003, was used as a starting point for constructing a sample of family and non-family firms.3 Starting from this basis, more detailed data about the ownership structures and management compositions of the companies were collected from corporate proxy statements submitted to the U.S. Securities and Exchange Commission for the years 1993-2002.4 In the next step, information from Hoover’s Handbook of American Business, Gale Business Resources, the Twentieth Century American Business Leaders Database at Harvard Business School, Forbes’ Lists of 400 Richest Americans, Marquis Who’s Who in America, as well as the websites of the companies was used to check and expand the dataset. In a final step, the dataset was merged with Standard & Poor’s ExecuComp database, which provides annual data on executive pay. The final estimation sample covers 2,578 observations from 393 firms.
Measures
Dependent variables. This study analyzes the structure of executive pay and its relation to family management and the level of family ownership. Accordingly, the following measures were used as dependent variables: share of base salary, share of annual bonus, share of payment due to long-term incentive plans, share of stock payment, and share of stock option payment (all in percent of total pay). Table A1 gives more details about the ExecuComp data items that were used.
Independent variables. To test the hypotheses, two variables with regard to family firms were constructed. The variable family CEO is an indicator variable that equals one if a member of the founding family is CEO and zero otherwise. The variable ownership by family
3 This particular date was chosen since an issue of BusinessWeek indicates the family firms in the S&P 500 at this date (BusinessWeek, 2003). This issue of the BusinessWeek provides helpful qualitative information about the ownership structure and the management composition of the family firms covered.
4 The Securities Exchange Act of 1934 requires officers, directors, and five-percent owners to disclose their holdings. This information was collected from the definitive proxy statements (DEF 14A).
gives the percentage of stock owned by the founding family. To distinguish family ownership from other types of owners, two further ownership variables were constructed. The variable ownership by financial investors measures the percentage of stock owned by large banks (e.g., Citigroup or JP Morgan), insurance companies (e.g., The Prudential Insurance Company or AXA), mutual funds (e.g., Fidelity Investments or Putnam Investments), private equity firms (e.g., KKR or Permira) or large individual financial investors (e.g., Warren Buffet, Kirk Kirkorian, or Philipp Anschutz). The variable ownership by employees measures the percentage of stock owned by employees through various types of employee stock ownership plans (ESOP). To control for other firm-, industry-, and time-specific influences, many more variables were constructed and included in the regression models. Table A1 in the appendix provides more details.
Method
A random effects panel data model was used to test the hypotheses.5 Somewhat unusually, this paper uses both a classical frequentist approach and a Bayesian approach to estimate the econometric models. As will become clear in the results section, the inclusion of the Bayesian approach makes the results more robust and provides some additional insights for theory. To familiarize the reader with Bayesian analysis, the approach is described below.
Bayesian analysis relies on Bayes’ theorem of probability (Bayes, 1763). This theorem is given by
) Pr(
) Pr(
)
| ) Pr(
|
Pr( y
y y θ θ
θ = , (1)
5 A Breusch-Pagan Lagragian Multiplier Test (Breusch and Pagan, 1980) is used to determine whether a random effects model should be preferred to a pooled OLS model. Typically, in a next step, a Hausman specification test (Hausman, 1978) should be used to decide whether a random effects or a fixed effects model is more appropriate. However, since the variable family CEO is to a substantial degree time-invariant (in 61 of the 393 firms, a change happened), and since the industry variables are completely time-invariant, a fixed-effects model makes little sense. That is why a random effects model is used in this paper.
where θ represents the set of unknown parameters and y represents the data. Pr(θ)is the prior distribution of the parameter θ, which may be derived from theory or other sources.
)
|
Pr(y θ is the likelihood function, which is the probability of the data y given the unknown parameter θ. Pr(y) is the marginal distribution of the data y, and, finally, Pr(θ |y) represents the posterior distribution, which is the probability of the parameter θ given the data y. To test theory, Bayesian analysis proceeds from here to the following three steps: first, a priori beliefs about the relationship of interest are formulated (the prior distribution, Pr(θ)). Next, a probability of occurrence of the data given these a priori beliefs is assumed (the likelihood function, Pr(y|θ)). In a final step, data are then used to update the a priori beliefs. The result is the posterior distribution, Pr(θ | y), which is a probability density function of the unknown parameters. Unlike with the result of classical econometrics, the result of Bayesian analysis allows for statements in terms of likely and unlikely parameter values. This latter aspect results in a fundamental difference in regards to testing theory. In contrast to classical frequentist econometrics, Bayesian analysis does not rely on asymptotic theory and statistical tests to test a hypothesis. Rather, the result is simply a statement about whether a particular a priori defined relationship between two variables has become more likely or not given the data. The reason to use a Bayesian approach as an additional element in the statistical analysis of this paper is that the main variables of interest, family CEO and family ownership, are correlated to a substantial degree with each other as well as with some other independent variables (see Table A2 in the appendix), thus reducing the efficiency of the estimates given by classical econometrics. Generally, Bayesian analysis is more robust to problems of multicollinearity and other problems affecting the efficiency of the estimates since it does not rely on asymptotic theory and statistical tests to test theory (Leamer, 1973). For the Matlab code used to run the Bayesian regressions, please contact the author.
RESULTS
Descriptive statistics and univariate analysis
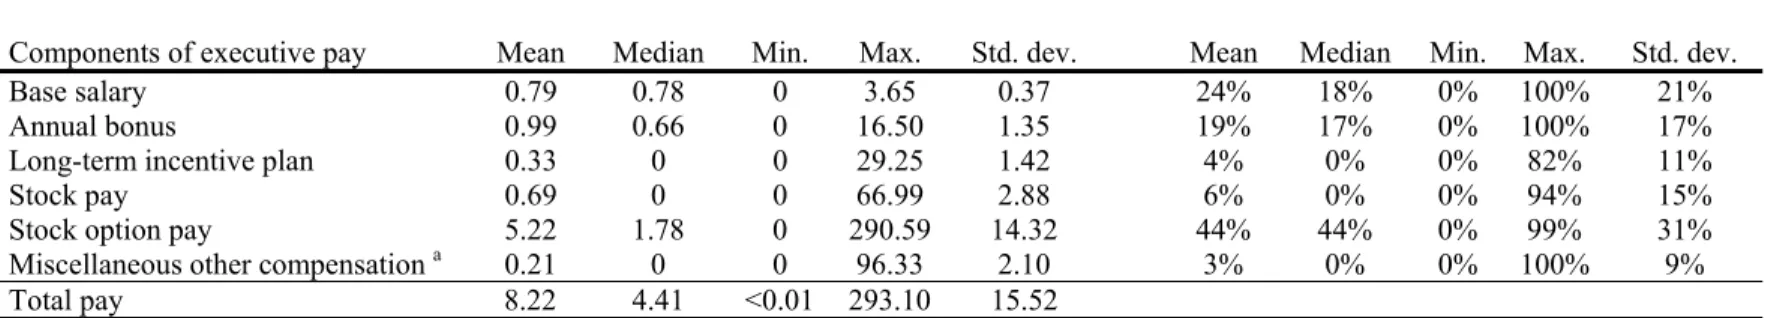
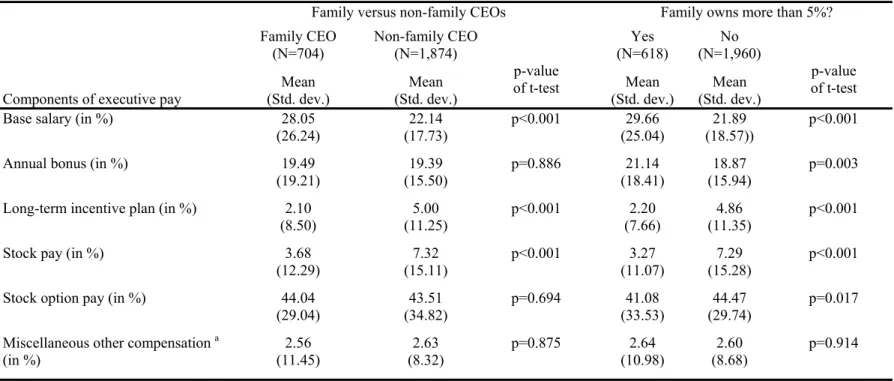
Table 1a gives some descriptive statistics about the level and structure of executive pay in our sample. A median CEO earns $4.4 million (mean: $8.2 million). Yet, with the lowest CEO pay at $0.001 million and the highest CEO pay at $293 million, the range of executive pay is large (the standard deviation is $15.52 million). Regarding the components of executive pay, the results are as follows: the median CEO base salary is $0.78 million (about 18% of total pay), his or her annual bonus is $0.66 million (about 17% of total pay), and his or her median stock option pay is $1.78 million (about 44% of total pay). Compared to the other components of executive pay, stock pay and pay due to long-term incentive plans seem to be of lesser importance. Most of the variance in executive pay seems to come from stock option pay (coefficient of variation is 2.74). Table 1b uses t-tests to compare the structure of executive pay in family versus non-family firms. In regard to family management, it is found that, on average, family CEOs have a higher share of base salary (28% vs. 22%, with p<0.001), a lower share of stock pay (4% vs. 7%, with p<0.001) and a lower share of pay due to long-term incentive plans (2% vs. 5%, with p<0.001). Regarding family ownership, it is found that, in firms where a family shareholder is present who has 5% or more of shares, CEOs have a higher share of base salary (30% vs. 22%, with p<0.001) and a higher share of annual bonus (21% vs. 19%, with p=0.003). Furthermore, it is found that CEOs in firms with a family shareholder have a lower share of pay due to long-term incentive plans (2% vs. 5%, with p<0.001), a lower share of stock pay (3% vs. 7%, with p<0.001) and a lower share of stock option pay (41% vs. 44%, with p=0.017).
Multivariate analysis
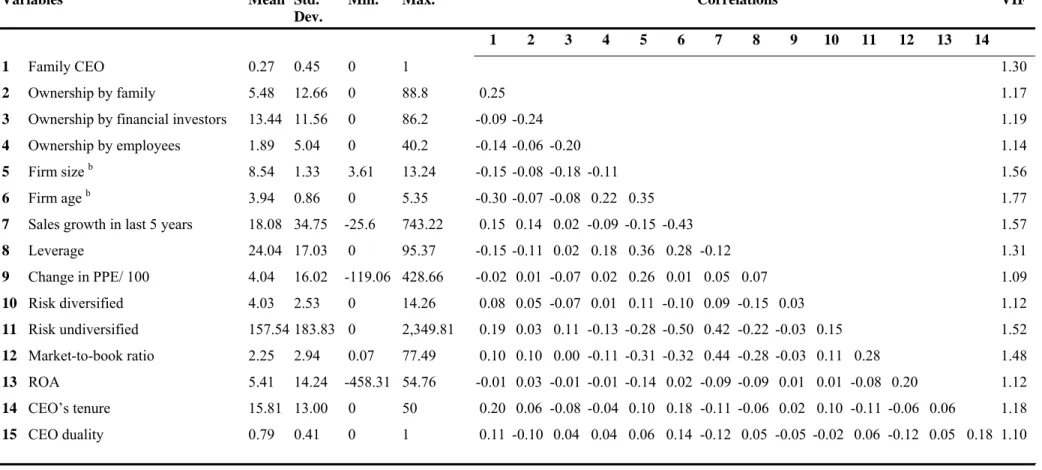
Table A2 in the appendix shows the correlation matrix and the corresponding variance inflation factors. Not surprisingly, the variables family CEO and ownership by family are
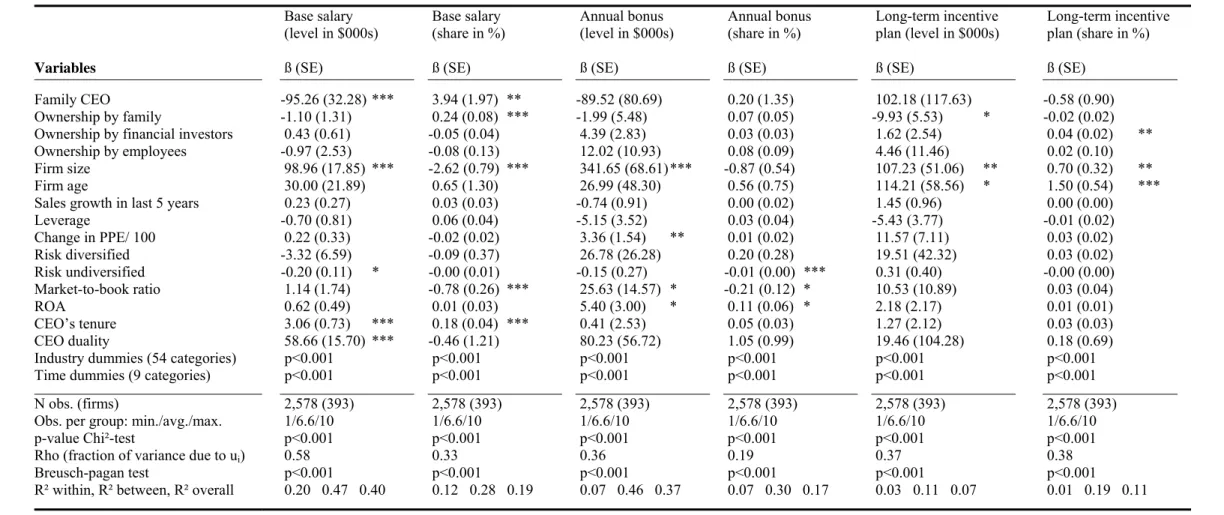
positively correlated (r=0.25). Furthermore, the variable family CEO is negatively correlated with the variable firm age (r=-0.3) and positively correlated with the variable CEO tenure (r=0.2). The variable ownership by family is negatively correlated with the variable ownership by financial investors (r=-0.24). Table 2 shows a random effects model on total pay. The coefficients of most covariates are as expected, e.g., firm size and a high market-to-book ratio increase CEO pay. With regard to the variables family CEO and ownership by family, an interesting difference emerges. The variable family CEO seems not to have an impact on total CEO pay (β=512.81 with p>0.1), whereas the variable ownership by family is found to have a negative impact on CEO pay (β=-58.21, with p<0.1). The impact of the latter effect, however, does not differ strongly from the effect of the variable ownership by financial investors (β=- 49.07, with p<0.05). Regarding the structure of executive pay, Table 3 displays random effects regressions on the share of the respective components in total pay. In addition to this, Table 4 shows the results of the same regression models estimated using a Bayesian method.
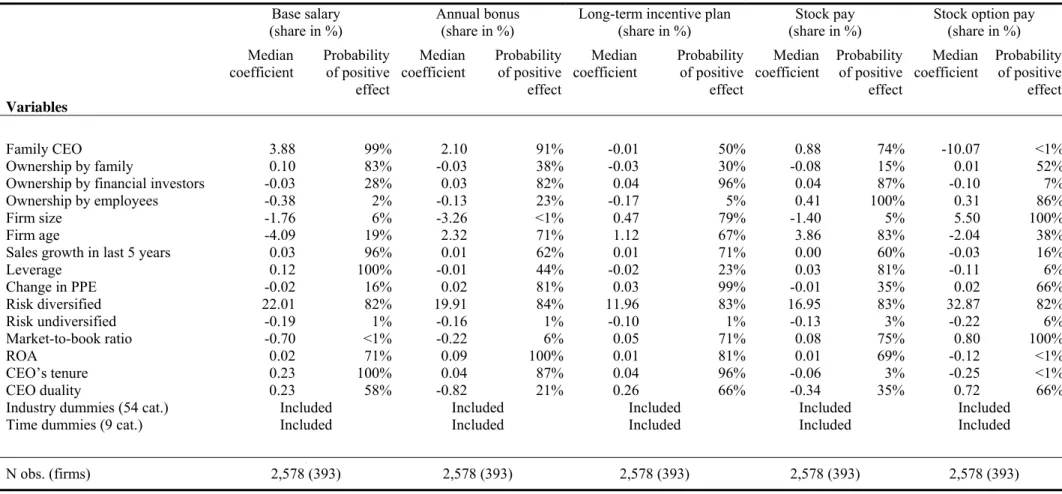
Base salary. Both in the Bayesian and in the classical regression model, the share of base salary in total pay is found to be about four percentage points higher with family CEOs than with non-family CEOs. The median coefficient of the variable family CEO in the Bayesian model is 3.88; the probability of a positive impact of the variable is 99%. With the variable ownership by family, the results differ to some degree between the Bayesian and the classical regression. In both models, the coefficient of the variable ownership by family is found to be positive, yet the size of the coefficient differs. Estimated with a classical method, the effect is found to be 0.24, with p<0.016; estimated with a Bayesian method, the median coefficient is found to be only 0.1. Nevertheless, despite the differences in the size of the coefficients, both the classical and the Bayesian model predict a positive relationship between family ownership and the share of base salary, thereby supporting hypothesis 1a and 2a.
6 That is, a 10% increase in family ownership increases the share of base salary by 2.4 percentage points.
Annual bonus. For the share of annual bonus in total pay, the results of the classical and the Bayesian model are found to differ. In the Bayesian model, the median coefficient of the variable family CEO is 2.1; the probability of a positive effect is 91%. In the classical model, the coefficient is 0.2, with p>0.1. With the variable ownership by family, the median coefficient in the Bayesian model is -0.03; the probability of a positive effect is 38%.
Estimated in the classical way, the coefficient of the variable ownership by family is 0.07, with p>0.1. Hypothesis 1b and 2b are both not supported.
Long-term incentive plan. With the share of payment due to long-term incentive plans, neither the classical nor the Bayesian model finds evidence for a strong effect of family management or degree of family ownership. In the classical model, the coefficients of both variables are statistically insignificant (p>0.1); in the Bayesian model, the probability of a positive effect is 50% for the variable family CEO and 30% for the variable ownership by family. Both hypothesis 1c and 2c are not supported.
Stock pay. With regard to the share of stock pay in total pay, the results of the classical and the Bayesian model go in the same direction. With both approaches, family management seems not to have a strong impact on the share of stock pay (classical regression: ß=-0.39, with p>0.1; Bayesian regression: median coefficient=0.88, with a 74% probability of a positive effect). Interestingly, however, both models predict a negative relationship between family ownership and the share of stock pay. In the classical regression, the coefficient of the variable ownership by family is -0.07, with p<0.1. The Bayesian model yields a median coefficient of -0.08; the probability of a positive effect is 15%. Hypothesis 1d is not supported, whereas hypothesis 2d is supported.
Stock option pay. Regarding the share of stock option pay in total pay, the results of the classical and the Bayesian model are found to differ to some degree. Both models predict a negative relationship between family management and the share of stock option pay in total pay. In the classical model, the coefficient of the variable family CEO is -4.61, with p<0.1;
estimated with the Bayesian method, the median coefficient of the variable family CEO becomes -10.07, with a probability of a positive effect below 1%. Despite the differences in the size of the coefficient, both models predict a negative relationship between family management and share of stock option pay. With the variable ownership by family, however, the situation is different. The classical regression yields a coefficient of -0.24, with p<0.01;
estimated using a Bayesian method, the coefficient is 0.01, with a probability of a positive effect of 52%. Hypothesis 1e is supported; hypothesis 2e not.
Summarizing the results of the multivariate regressions, hypothesis 1a (positive relationship between family management and the share of base salary in total pay), hypothesis 2a (positive relationship between family ownership and the share of base salary), hypothesis 2d (negative relationship between family ownership and the share of stock pay), and hypothesis 1e (negative relationship between family management and the share of stock option pay) are strongly supported by the data. In all these cases, both the classical and the Bayesian regression model yield similar results.
DISCUSSION
Implications for practice
From a practical perspective, this paper’s main contribution is to show that there exist great differences between family and non-family firms regarding the structure of executive pay. The share of stock-based pay in family firms is found to be lower, and the share of base salary is found to be higher than in comparable non-family firms. This is an important result for members of remuneration boards and executive pay consultants to consider. This paper’s interpretation is that intrinsic motivation plays an important role for family CEOs.
Accordingly, offering family CEOs an overly high-powered compensation contract might not be a good idea since it is likely to crowd out (intrinsic) motivation.
Implications for theory
Our findings have a number of important implications for family business research and the executive pay literature.
With regard to family business research, this paper contributes to the discussion of whether members of the founding family use their firm to extract private benefits of control (Claessens et al., 2002; Morck and Yeung, 2003). The results of this paper do not support this view. In line with prior studies (Gomez-Meija, Larraza-Kintana, and Makri, 2003;
McConaughy, 2000), family CEOs are not found to have a higher salary than non-family CEOs. Moreover, after controlling for firm and industry characteristics, the share of stock option pay is lower for family than it is for non-family CEOs. This is an interesting result because executive pay scandals and their coverage in the media often have addressed the exorbitant value of stock option pay (e.g., The Economist, 2006; Useem, 2003). It should be noted, however, that it cannot be ruled out that members of the founding family seek private benefits of control. They might simply use means other than manipulating the remuneration process to extract personal rents.7 In addition to this, this paper contributes to the understanding of the motivation of family CEOs to act in line with the firm’s interests. The finding that, relative to non-family CEOs, family CEOs receive a lower share of incentive- based pay supports the idea that family CEOs are intrinsically more strongly motivated to act in line with the firm’s goals than are non-family CEOs. Thus, family managers can be seen as stewards who act in the best interests of their firm (Chrisman et al., 2007; Corbetta and Salvato, 2004). Still, the share of incentive-based pay is sizeable. Even with cautious estimates (i.e., not considering annual bonus), the average share of incentive pay is about 50%. This finding supports the idea that a CEO’s altruism towards the members of his or her own family creates agency costs (Schulze et al., 2001; Schulze, Lubatkin, and Dino, 2003),
7 For a discussion of the various types of private benefits of control, see Dyck and Zingales (2004). For an example of an unusual and “creative” way to extract rents from shareholders, see Liu and Yermack (2007).
which can be reduced by bonding mechanisms. An alternative interpretation is that non-family shareholders such as mutual funds do not believe that family CEOs behave in the firm’s best interest and therefore prefer to tie executive pay to performance.
The main contribution of this paper to the executive compensation literature is to show that the structure of executive pay is different in family firms versus non-family firms, in particular the share of stock options and base salary. This result is important for the literature that analyzes the use and effectiveness of executive options (e.g., Dittmann and Maug, 2007;
Feltham and Wu, 2001; for a summary, see Arnold and Gillenkirch, 2007). This paper argues that the great differences between family and non-family CEOs are attributable to the former’s stronger intrinsic motivation. An alternative explanation would be to see options as a form of hidden compensation that is not perceived by the market (Dechow et al., 1996), a view that then might lead to a principal-agent problem concerning the remuneration process (Bebchuk and Fried, 2003). Further research will have to decide which of the two explanations is better suited to explaining this paper’s findings regarding the lower share of stock-option pay in family-managed firms. In a similar vein, this paper contributes to the literature analyzing the pay-to-performance relationship (Jensen and Murphy, 1990a; 1990b; for a summary, see Tosi et al., 2000). Considering intrinsic motivation (in the case of family CEOs) as a factor might help to explain why firm performance is found to account for only a small portion of the variance in CEO pay (Tosi et al., 2000). Family management and the degree of family ownership might actually be an important moderator variable for this literature (see also McConaughy, 2000). Previous literature on executive pay in family firms has been mainly about a comparison of the absolute level of executive pay and its determinants (e.g., Gomez- Meija et al., 2003). To the author’s best knowledge, this study is the first that analyses in detail the relationship between family firm attributes and the structure of executive pay.
Finally, this paper contributes to the discussion of how the use of Bayesian methods can provide additional insights for management research (Hahn and Doh, 2006). In this paper,
the comparison of the results from the Bayesian and the classical approach allowed the author to be very cautious about the results. Only the findings confirmed by both types of models were considered to be robust. In this way, the Bayesian approach is a useful robustness check.
I believe that such a robustness check could be a useful additional tool in many empirical studies in management science, in particular in cases where the dataset is small and it is difficult to obtain precise estimates.
Generalizability
This paper analyzes a topic that, so far, has received little attention. As usual, in the interpretation of the results, some limitations apply. The generalization of our results is limited in that we regard only large public U.S. firms.8 Small to medium-sized firms, as well as private firms, are not part of our sample. It would be interesting to see if the paper’s results also hold for a sample of private or small to medium-sized family firms. An argument in support of this view is that financial market pressures should be lower for these types of firms compared to this paper’s sample of large publicly listed family firms.
Conclusion
Turning back to the question of whether CEOs in family firms are paid like bureaucrats, the evidence presented in this paper provides a mixed picture. On the one hand, it is found that family management and the degree of family ownership increase the share of base salary in total pay. Furthermore, it is found that family management decreases the level of stock option pay. Thus, the idea that CEOs in family firms are paid more like bureaucrats is supported. On the other hand, the share of incentive pay in family firms is still very high. For example, the mean share of stock-option pay of a family CEO is about 44%. The mean share of annual bonus of a family CEO is about 19%. In conclusion, the link between pay and performance
8 For a study on executive pay in small to medium-sized family firms, see Schulze et al. (2003).
seems to be less strong in family firms than in non-family firms. Nevertheless, a large amount of pay is still dependent on performance. The discussion of the structure of executive pay and the exorbitant value of stock option pay in the media and the academic literature should take into account differences between family and non-family firms.
REFERENCES
Arnold, M. C., & Gillenkirch, R. M. 2007. Leistungsanreize durch Aktien oder Optionen?
Eine Diskussion des State of the Art. Zeitschrift für Betriebswirtschaft, 77 (1): 75-99.
Baker, G. P. 1992. Incentive contracts and performance measurement. Journal of Political Economy, 100 (3): 598-614.
Bayes, T. 1763. An essay towards solving a problem in the doctrine of chances. Philosophical Transaction of the Royal Society of London, 53: 370-418.
Bebchuk, L. A., Fried, J. M., & Walker, D. I. 2002. Managerial power and rent extraction in the design of executive compensation. The University of Chicago Law Review, 69 (3): 751- 846.
Bebchuk, L. A. & Fried, J. M. 2003. Executive compensation as an agency problem. Journal of Economic Perspectives, 17 (3): 71-92.
Block, J. H. 2008. Family management, family ownership, and downsizing: evidence from S&P 500 Firms, SSRN working paper.
Block, J. H., & Thams, A. 2007. Long-term orientation in family firms: a Bayesian Analysis of R&D spending. SSRN working paper.
Breusch, T. S., & Pagan, A. R. 1980. The Lagrange multiplier test and its application to model specification in econometrics. Review of Economic Studies, 47 (1): 239-253.
BusinessWeek. 2003. Family Inc. November 10: 111-114.
Casson, M. 1999. The economics of the family firm. Scandinavian Economic History Review, 47 (1): 10-23.
Chrisman, J. J., Chua, J. H., Kellermanns, F. W., & Chang, E. P. C. 2007. Are family managers agents or stewards? An exploratory study in privately held family firms. Journal of Business Research, 60 (10): 1030-1038.
Claessens, S., Djankov, S., Fan, J. P. H., & Lang, L. H. P. 2002. Disentangling the incentive and entrenchment effects of large shareholdings. The Journal of Finance, 57 (6): 2741-2771.
Corbetta, G., & Salvato, C. 2004. Self-serving or self-actualizing? Models of man and agency costs in different types of family firms: a commentary on “comparing the agency costs of
family and non-family firms: conceptual issues and exploratory evidence. Entrepreneurship Theory and Practice, 28 (4): 335-354.
Davis, J. H., Schoorman, F. D., & Donaldson, L. 1997. Toward a stewardship theory of management. Academy of Management Review, 22 (1): 20-47.
Deci, E. L., & Ryan, R. M. 2000. The “what” and “why” of goal pursuits: human needs and the self-determination of behavior. Psychological Inquiry, 11 (4): 227-268.
Dechow, P. M., Hutton, A. P., & Sloan, R. G. 1996. Economic consequences of accounting for stock-based compensation. Journal of Accounting Research, 34 (Supplement): 1-20.
Donckels, R. &, Frohlich, E. 1991. Are family businesses really different? European experiences from STRATOS. Family Business Review, 4 (2): 149-160.
Dittmann, I., & Maug, E. 2007. Lower salaries and no options? On the optimal structure of executive pay. Journal of Finance, 62 (41): 303-343.
Dyck, A., & Zingales, L. 2004. Private benefits of control: an international comparison.
Journal of Finance, 59 (2): 537-600.
Dyer, W. G., & Whetten, D. A. 2006. Family firms and social responsibility: preliminary evidence from the S&P 500. Entrepreneurship Theory and Practice, 30 (6): 785-802.
Eisenhardt, K. 1989. Agency theory: An assessment and review. Academy of Management Review, 14 (1): 57-74.
Feltham, G. A., & Wu, M. G. H. 2001. Incentive Efficiency of Stock versus Options. Review of Accounting Studies, 6 (1): 7-28.
Frey, B. S., & Osterloh, M. 2005. Yes, managers should be paid like bureaucrats. Journal of Management Inquiry, 14 (1): 96-111.
Fuller, J., & Jensen, M. 2002. Just say no to Wall Street: Putting a stop to the earnings game.
Journal of Applied Corporate Finance, 14 (4): 41-46.
Gibbons, R. 1998. Incentives in organizations. Journal of Economic Perspectives, 12 (4):
115-132.
Gomez-Meija, L. R., Larraza-Kintana, M., & Makri, M. 2003. The determinants of executive compensation in family-controlled public corporations. Academy of Management Journal, 46 (2): 226-237.
Hall, B. J., & Liebman, J. B. 1998. Are CEOs really paid like bureaucrats? Quarterly Journal of Economics, 113 (3): 653-691.
Hall, B. J. 2003. Six challenges in designing equity-based pay. Journal of Applied Corporate Finance, 15 (3): 21-33.
Hausman, J. A. 1978. Specification tests in econometrics. Econometrica, 46 (6): 1251-1271.
Holmstrom, B., & Milgrom, P. 1991. Multitask principal-agent analyses: incentive contracts, asset ownership, and job design. Journal of Law, Economics, & Organization, 7 (Special Issue): 24-52.
James, H. S. 1999. Owner as manager, extended horizons and the family firm. International Journal of the Economics of Business, 6 (1): 41-55.
Jensen, M. C., & Meckling, W. H. 1976. Theory of the firm: managerial behavior, agency costs and ownership structure. Journal of Financial Economics, 3 (4): 305-360.
Jensen, M. C., & Murphy, K. J. 1990a. Performance pay and top management incentives.
Journal of Political Economy, 98 (2): 225-264.
Jensen, M. C., & Murphy, K. J. 1990b. CEO incentives: It’s not how much you pay, but how.
Harvard Business Review, 68 (3): 138-153.
La Porta, R., Lopez-De-Silanes, F., & Shleifer, A. 1999. Corporate ownership around the world. Journal of Finance, 54 (2): 471-517.
Lambert, R. A., Lanen, W. N., & Larcker, D. F. 1989. Executive stock option plans and corporate dividend policy. Journal of Financial and Quantitative Analysis, 24 (4): 409-425.
Leamer, E. E. 1973. Multicollinearity: a Bayesian interpretation. Review of Economics and Statistics, LV (3): 371-380.
Le Breton-Miller, I., & Miller, D. 2006. Why do some family businesses out-compete?
Governance, long-term orientation, and sustainable capability. Entrepreneurship Theory and Practice, 30 (6): 731-746.
Liu, C., & Yermack, D. 2007. Where are the shareholder’s mansions? CEOs home purchases, stock sales, and subsequent company performance. SSRN working paper.
Hahn, J., & Doh, J. P. 2006. Using bayesian methods in strategy research: an extension of Hansen et al.. Strategic Management Journal, 27 (8): 783-798.
Harris, D., & Martinez, J. 1994. Is strategy different for family-owned business? Family Business Review, 7 (2), 159-174.
McConaughy, D. L. 2000. Family CEOs vs. nonfamily CEOs in the family-controlled firm: an examination of the level and sensitivity of pay to performance. Family Business Review, 13 (2), 121-131.
Morck, R., & Yeung, B. 2003. Agency problems in large family business groups.
Entrepreneurship Theory and Practice, 27 (4): 367-382.
Schulze, W. S., Lubatkin, M. H., Dino, R. N., & Buchholtz, A. K. 2001. Agency relationships in family firms: theory and evidence. Organization Science, 12 (2): 99-116.
Schulze, W. S., Lubatkin, M. H., & Dino, R. N. 2003. Toward a theory of agency and altruism in family firms. Journal of Business Venturing, 18 (4): 473-490.
Tagiuri, R., & Davis, J. A. 1992. On the goals of successful family businesses. Family Business Review, 5 (1): 43-62.
Tosi, H. L., Werner, S., Katz, J.P., & Gomez-Mejia, L. R. 2000. How much does performance matter? A meta-analysis of CEO pay studies. Journal of Management, 26 (2): 301-339.
The Economist. Taking stock of options. July 22: 13.
Uhlaner, L. M., Goor-Balk, H. J. M., & Masurel, E. 2004. Family business and corporate social responsibility in a sample of Dutch firms. Journal of Small Business and Enterprise Development, 11 (2): 186-194.
Useem, J. 2003. Have they no shame? Fortune, 147: 56-64.
Villalonga, B., & Amit, R. 2006. How do family ownership, control and management affect firm value? Journal of Financial Economics, 80 (2): 385-417.
Ward, J. 2004. Perpetuating the family business. Family Enterprise Publishers: Marietta, GA.
Wiklund, J. 2006. Commentary: “family firms and social responsibility: preliminary evidence from the S&P 500”. Entrepreneurship Theory and Practice, 30 (6): 803-808.
Tables to be inserted in the text:
Table 1a: Level and structure of executive pay
Level of executive compensation (in million $)
Structure of executive compensation (share in %)
Components of executive pay Mean Median Min. Max. Std. dev. Mean Median Min. Max. Std. dev.
Base salary 0.79 0.78 0 3.65 0.37 24% 18% 0% 100% 21%
Annual bonus 0.99 0.66 0 16.50 1.35 19% 17% 0% 100% 17%
Long-term incentive plan 0.33 0 0 29.25 1.42 4% 0% 0% 82% 11%
Stock pay 0.69 0 0 66.99 2.88 6% 0% 0% 94% 15%
Stock option pay 5.22 1.78 0 290.59 14.32 44% 44% 0% 99% 31%
Miscellaneous other compensation a 0.21 0 0 96.33 2.10 3% 0% 0% 100% 9%
Total pay 8.22 4.41 <0.01 293.10 15.52
N=2,578 obs. from 393 firms; Std. dev. = Standard deviation
a Miscellaneous other compensation includes the ExecuComp data items ALLOTHPD (all other paid) and OTHANN (other annual).
Table 1b: Structure of executive pay: family versus non-family firms
Family versus non-family CEOs Family owns more than 5%?
Family CEO
(N=704) Non-family CEO
(N=1,874) Yes
(N=618) No
(N=1,960) Components of executive pay Mean
(Std. dev.) Mean (Std. dev.)
p-value
of t-test Mean
(Std. dev.) Mean (Std. dev.)
p-value of t-test
Base salary (in %) 28.05
(26.24) 22.14
(17.73) p<0.001 29.66
(25.04) 21.89
(18.57)) p<0.001
Annual bonus (in %) 19.49
(19.21) 19.39
(15.50) p=0.886 21.14
(18.41) 18.87
(15.94) p=0.003 Long-term incentive plan (in %) 2.10
(8.50) 5.00
(11.25) p<0.001 2.20
(7.66) 4.86
(11.35) p<0.001
Stock pay (in %) 3.68
(12.29)
7.32 (15.11)
p<0.001 3.27 (11.07)
7.29 (15.28)
p<0.001 Stock option pay (in %) 44.04
(29.04)
43.51 (34.82)
p=0.694 41.08 (33.53)
44.47 (29.74)
p=0.017 Miscellaneous other compensation a
(in %) 2.56
(11.45) 2.63
(8.32) p=0.875 2.64
(10.98) 2.60
(8.68) p=0.914 N=2,578; Std. dev. = Standard deviation; p-values refer to a two sided t-test.
a Miscellaneous other compensation includes the ExecuComp data items ALLOTHPD (all other paid) and OTHANN (other annual).
Table 2: Random effects regression on total pay
Total compensation (in $000s)
Variables ß (SE)
Family CEO 512.81 (988.19)
Ownership by family -58.21 (31.34) * Ownership by financial investors -49.07 (19.34) **
Ownership by employees -8.81 (83.47)
Firm size 3,835.41 (580.89) ***
Firm age -603.29 (669.66)
Sales growth in last 5 years -32.89 (19.04) *
Leverage 92.84 (30.84) ***
Change in PPE/ 100 33.51 (36.61) Risk diversified 198.74 (247.37)
Risk undiversified 22.20 (8.51) ***
Market-to-book ratio 868.50 (517.20) *
ROA 15.18 (28.55)
CEO’s tenure -71.31 (19.82) ***
CEO duality 1,443.24 (695.97) **
Industry dummies (54 categories) p<0.001 Time dummies (9 categories) p<0.001
N obs. (firms) 2,578 (393)
Obs. per group: min./avg./max. 1/6.6/10 p-value Chi²-test p<0.001 Rho (fraction of variance due to ui) 0.23 Breusch-pagan test p<0.001
R² within, R² between, R² overall 0.10 0.39 0.21
* p<0.1 ** p<0.05 *** p<0.01
Standard errors (SE) are robust and clustered; Two-sided tests are used.
Table 3: Random effects regressions on the level and structure of executive pay (1)
Base salary
(level in $000s) Base salary
(share in %) Annual bonus
(level in $000s) Annual bonus
(share in %) Long-term incentive
plan (level in $000s) Long-term incentive plan (share in %) Variables ß (SE) ß (SE) ß (SE) ß (SE) ß (SE) ß (SE)
Family CEO -95.26 (32.28) *** 3.94 (1.97) ** -89.52 (80.69) 0.20 (1.35) 102.18 (117.63) -0.58 (0.90) Ownership by family -1.10 (1.31) 0.24 (0.08) *** -1.99 (5.48) 0.07 (0.05) -9.93 (5.53) * -0.02 (0.02) Ownership by financial investors 0.43 (0.61) -0.05 (0.04) 4.39 (2.83) 0.03 (0.03) 1.62 (2.54) 0.04 (0.02) **
Ownership by employees -0.97 (2.53) -0.08 (0.13) 12.02 (10.93) 0.08 (0.09) 4.46 (11.46) 0.02 (0.10) Firm size 98.96 (17.85) *** -2.62 (0.79) *** 341.65 (68.61)*** -0.87 (0.54) 107.23 (51.06) ** 0.70 (0.32) **
Firm age 30.00 (21.89) 0.65 (1.30) 26.99 (48.30) 0.56 (0.75) 114.21 (58.56) * 1.50 (0.54) ***
Sales growth in last 5 years 0.23 (0.27) 0.03 (0.03) -0.74 (0.91) 0.00 (0.02) 1.45 (0.96) 0.00 (0.00) Leverage -0.70 (0.81) 0.06 (0.04) -5.15 (3.52) 0.03 (0.04) -5.43 (3.77) -0.01 (0.02) Change in PPE/ 100 0.22 (0.33) -0.02 (0.02) 3.36 (1.54) ** 0.01 (0.02) 11.57 (7.11) 0.03 (0.02) Risk diversified -3.32 (6.59) -0.09 (0.37) 26.78 (26.28) 0.20 (0.28) 19.51 (42.32) 0.03 (0.02) Risk undiversified -0.20 (0.11) * -0.00 (0.01) -0.15 (0.27) -0.01 (0.00) *** 0.31 (0.40) -0.00 (0.00) Market-to-book ratio 1.14 (1.74) -0.78 (0.26) *** 25.63 (14.57) * -0.21 (0.12) * 10.53 (10.89) 0.03 (0.04) ROA 0.62 (0.49) 0.01 (0.03) 5.40 (3.00) * 0.11 (0.06) * 2.18 (2.17) 0.01 (0.01) CEO’s tenure 3.06 (0.73) *** 0.18 (0.04) *** 0.41 (2.53) 0.05 (0.03) 1.27 (2.12) 0.03 (0.03) CEO duality 58.66 (15.70) *** -0.46 (1.21) 80.23 (56.72) 1.05 (0.99) 19.46 (104.28) 0.18 (0.69) Industry dummies (54 categories) p<0.001 p<0.001 p<0.001 p<0.001 p<0.001 p<0.001 Time dummies (9 categories) p<0.001 p<0.001 p<0.001 p<0.001 p<0.001 p<0.001
N obs. (firms) 2,578 (393) 2,578 (393) 2,578 (393) 2,578 (393) 2,578 (393) 2,578 (393) Obs. per group: min./avg./max. 1/6.6/10 1/6.6/10 1/6.6/10 1/6.6/10 1/6.6/10 1/6.6/10 p-value Chi²-test p<0.001 p<0.001 p<0.001 p<0.001 p<0.001 p<0.001
Rho (fraction of variance due to ui) 0.58 0.33 0.36 0.19 0.37 0.38
Breusch-pagan test p<0.001 p<0.001 p<0.001 p<0.001 p<0.001 p<0.001
R² within, R² between, R² overall 0.20 0.47 0.40 0.12 0.28 0.19 0.07 0.46 0.37 0.07 0.30 0.17 0.03 0.11 0.07 0.01 0.19 0.11
* p<0.1 ** p<0.05 *** p<0.01; Standard errors (SE) are robust and clustered; Two-sided tests are used.
Table 3: Random effects regressions on the level and structure of executive pay (2)
Stock pay
(level in $000s) Stock pay
(share in %) Stock option pay
(level in $000s) Stock option pay (share in %) Variables ß (SE) ß (SE) ß (SE) ß (SE)
Family CEO -14.78 (198.18) -0.39 (1.12) 706.96 (952.90) -4.61 (2.42) * Ownership by family -11.71 (6.85) * -0.07 (0.04) * -32.54 (27.82) -0.24 (0.08) ***
Ownership by financial investors -0.50 (4.15) 0.04 (0.03) -54.36 (17.86) *** -0.07 (0.06) Ownership by employees -22.82 (22.21) 0.13 (0.10) 0.65 (67.26) -0.16 (0.14) Firm size 270.16 (93.06) *** 0.21 (0.48) 2,755.13 (562.64) *** 2.35 (1.03) ***
Firm age 84.02 (101.79) 1.99 (0.76) *** -976.21 (640.70) -5.29 (1.58) ***
Sales growth in last 5 years 2.04 (1.88) -0.00 (0.01) -33.18 (18.47) * -0.01 (0.05) Leverage -5.71 (6.10) 0.04 (0.03) -76.14 (28.83) *** -0.10 (0.06) * Change in PPE/ 100 -7.23 (7.84) -0.02 (0.02) 40.33 (34.19) 0.04 (0.04) Risk diversified 2.25 (33.70) -0.03 (0.20) 165.56 (242.60) -0.06 (0.51) Risk undiversified 0.50 (0.52) 0.00 (0.00) 20.84 (8.39) ** 0.02 (0.01) **
Market-to-book ratio 22.08 (23.22) 0.10 (0.07) 810.29 (485.56) * 0.90 (0.33) ***
ROA 6.14 (3.72) * 0.01 (0.01) 0.36 (24.37) -0.12 (0.06) **
CEO’s tenure -9.39 (5.17) * -0.06 (0.04) * -58.65 (17.59) *** -0.17 (0.06) ***
CEO duality 210.67 (127.28) * 0.35 (0.89) 1,008.85 (661.45) 0.72 (1.75) Industry dummies (54 categories) p<0.001 p<0.001 p<0.001 p<0.001 Time dummies (9 categories) p<0.001 p<0.001 p<0.001 p<0.001
N obs. (firms) 2,578 (393) 2,578 (393) 2,578 (393) 2,578 (393) Obs. per group: min./avg./max. 1/6.6/10 1/6.6/10 1/6.6/10 1/6.6/10 p-value Chi²-test p<0.001 p<0.001 p<0.001 p<0.001 Rho (fraction of variance due to ui) 0.27 0.28 0.22 0.28 Breusch-pagan test p<0.001 p<0.001 p<0.001 p<0.001
R² within, R² between, R² overall 0.02 0.41 0.16 0.02 0.41 0.17 0.08 0.36 0.18 0.12 0.33 0.21
* p<0.1 ** p<0.05 *** p<0.01; Standard errors (SE) are robust and clustered; Two-sided tests are used.
Table 4: Random effects Bayesian regressions on the structure of executive pay a
Base salary
(share in %) Annual bonus
(share in %) Long-term incentive plan
(share in %) Stock pay
(share in %) Stock option pay (share in %)
Variables
Median
coefficient Probability of positive
effect
Median
coefficient Probability of positive
effect
Median
coefficient Probability of positive
effect
Median
coefficient Probability of positive effect
Median
coefficient Probability of positive effect
Family CEO 3.88 99% 2.10 91% -0.01 50% 0.88 74% -10.07 <1%
Ownership by family 0.10 83% -0.03 38% -0.03 30% -0.08 15% 0.01 52%
Ownership by financial investors -0.03 28% 0.03 82% 0.04 96% 0.04 87% -0.10 7%
Ownership by employees -0.38 2% -0.13 23% -0.17 5% 0.41 100% 0.31 86%
Firm size -1.76 6% -3.26 <1% 0.47 79% -1.40 5% 5.50 100%
Firm age -4.09 19% 2.32 71% 1.12 67% 3.86 83% -2.04 38%
Sales growth in last 5 years 0.03 96% 0.01 62% 0.01 71% 0.00 60% -0.03 16%
Leverage 0.12 100% -0.01 44% -0.02 23% 0.03 81% -0.11 6%
Change in PPE -0.02 16% 0.02 81% 0.03 99% -0.01 35% 0.02 66%
Risk diversified 22.01 82% 19.91 84% 11.96 83% 16.95 83% 32.87 82%
Risk undiversified -0.19 1% -0.16 1% -0.10 1% -0.13 3% -0.22 6%
Market-to-book ratio -0.70 <1% -0.22 6% 0.05 71% 0.08 75% 0.80 100%
ROA 0.02 71% 0.09 100% 0.01 81% 0.01 69% -0.12 <1%
CEO’s tenure 0.23 100% 0.04 87% 0.04 96% -0.06 3% -0.25 <1%
CEO duality 0.23 58% -0.82 21% 0.26 66% -0.34 35% 0.72 66%
Industry dummies (54 cat.) Included Included Included Included Included
Time dummies (9 cat.) Included Included Included Included Included
.
N obs. (firms) 2,578 (393) 2,578 (393) 2,578 (393) 2,578 (393) 2,578 (393)
a We use normally distributed priors with of mean of zero and a standard deviation of one.
The use of alternative priors, however, does not change the results in a substantial way.