Report No: ACS7935
Republic of India
India: Women, Work and Employment
26 February 2014
SASDS
SOUTH ASIA
Public Disclosure Authorized Public Disclosure Authorized Public Disclosure Authorized Public Disclosure Authorized
CONTENTS
ACRONYMS AND ABBREVIATIONS iv
SUMMARY vi
1. G ENDER AND L ABOR F ORCE P ARTICIPATION IN I NDIA 1
1.1 Introduction 1
1.2 The ‘Economic Empowerment’ Framework 1
1.3 Women’s Labor Force Participation: India and Other Countries 2
1.4 The Indian Growth Story 3
1.5 India’s Labor Force in the ‘High Growth’ Period 4
1.6 Barriers to Women’s Work Participation 6
1.7 How ‘Gender and Economic Empowerment’ Unfolds 7
2. K EY C ORRELATES OF L ABOR O UTCOMES 8
2.1 Focus on Three Significant Correlates 8
2.2 Household Economic Status and Work 8
2.3 Household Wages and Women’s Labor Force Participation 9
2.4 Labor Force Participation and Social Disadvantage 10
2.5 Education and Work 12
2.6 Interactions between Education and Economic/Social Status 15
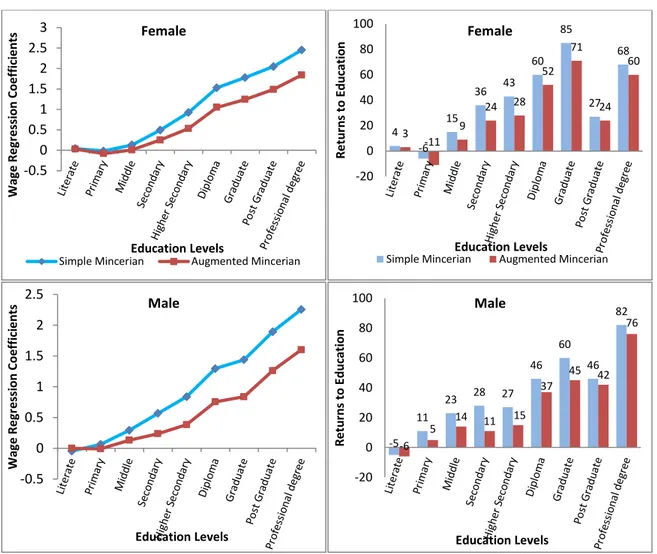
2.7 Returns to Education 17
2.8 The ‘Two India’s’ are Three for Women and Work 19
3. G ENDER AND E MPLOYMENT BY S ECTOR 20
3.1 The Labor Market and Gender 20
3.2 Changes in the Time of Economic Growth 22
3.3 High Risks, Low Returns for Women 24
3.4 Formal Employment 25
3.5 Some Areas of Growth in Women’s Employment 26
3.6 Lessons from these Experiences of Job Growth for Women 32
4. G ENDER AND E MPLOYMENT BY S TATE 34
4.1 Labor Outcomes in the States 34
4.2 Wage Rates and Ranges 40
5. I NTRA - HOUSEHOLD AND OTHER F ACTORS AFFECTING W OMEN ’ S L ABOR O UTCOMES 43
5.1 When Women Do Not Work 43
5.2 The Social Underpinnings of ‘Not Working’ 44
5.3 Strengthening ‘Agency’ to Enhance Women’s Work 47
6. L AND , I NFRASTRUCTURE AND W OMEN ’ S W ORK 52
6.1 Access to Land and Productive Assets 52
6.2 Participation in Agricultural Work 53
6.3 Operationalizing Women’s Claims to Land 56
6.4 Infrastructure and Economic Empowerment 57
6.5 Inequality in Access to Infrastructure and Work Participation 60
7. P OLICIES R ELATED TO W OMEN ’ S E MPLOYMENT 63
7.1 Empowering Policies and Laws 63
7.2 Economic Policies and Related Programs 65
8. C ONCLUSIONS AND N EXT S TEPS 67
8.1 Future research 68
ANNEXURES ( INCLUDING UPDATED TABLES & FIGURES ) 70
LIST OF BACKGROUND PAPERS 83
REFERENCES 84
List of Tables
1.1 Number and Distribution of Work Force Participants (Usual Principal and Subsidiary Status workers aged 15 and above), 1993-94 to 2009-10
4 1.2 Labor Force Participation Rates of Men and Women (UPSS workers aged 15 and
above), Rural and Urban areas, 1993-94 to 2009-10
4 2.1 Mean Male Household Wages and Female LFPRs, Rural areas, 2004-05 and 2009-10 11 2.2 LFP Rates for Women and the Ratios of Male to Female LFPRs by Social Group, 2009-10 11 2.3 Labor Force Participation among Rural and Urban Women by Education Levels 15
2.4 Summary Results of a Regression Analysis of Wage Rates 19
3.1 Gender Differences in Activity Status of Workers in Key Sectors 25 4.1R Classification of States by Gender Gaps (M-F) in Shares of Workers in Different
Occupational Groups in Rural Areas, 2009-10
41 4.1U Classification of States by Gender Gaps (M-F) in Shares of Workers in Different
Occupational Groups in Urban Areas, 2009-10
42
List of Figures
1.1 Female Labor Force Participation Rates in Selected Countries (15-65 years), 2010 2 2.1 Labor Force Participation Rates of Women and Men by MPCE Decile Groups, All-India
Rural and Urban, 1993-94 and 2009-10
9 2.2 Labor Force Participation Rates of Different Social Groups, 2009-10 12 2.3 Labor Force Participation among 15-64 Year-olds, 2009-10 13 2.4 Labor Force Participation of Men and Women by Education, Rural and Urban Areas,
2009-10
13 2.5 LFPR among Different Social Groups by Education, 2009-10 17 2.6 Wage Regression Coefficients and Returns to Education for Men and Women in 2009-
10
18
3.1 Share of Women in Each Industry Group, NSS 2009-10 21
3.2 Distribution of Female and Male Work Force, NSS 2009-10 21
4.1 Gender Gap in LFPRs by state, 2011-12 34
4.2 LFPRs for Rural, Urban and All Males, Females and Persons by MPCE Deciles 36 5.1 Male and Female Labor Force Participation Rates by Age Group, 2009-10 46 List of Annexures (Including Updated Tables & Figures)
Figures
2.1 Labor Force Participation Rates of Women and Men by MPCE Decile Groups, All-India Rural and Urban, 1993-94 to 2011-12
70 2.2 Labor Force Participation Rates of Different Social Groups, 2011-12 70 2.3 Labor Force Participation among 15-64 Year-olds, 2011-12 71 2.4 Labor Force Participation of Men and Women by Education, Rural and Urban Areas,
2011-12
71 2.5 LFPR among Different Social Groups by Education, 2011-12 72
3.1 Share of Women in Each Industry Group, NSS 2011-12 73
3.2 Distribution of Female and Male Work Force, NSS 2011-12 73
4.1 Gender Gap in LFPRs by State, 2011-12 74
4.2 LFPRs for Rural, Urban and All Males, Females and Persons by MPCE Deciles 74 Tables
1.1 Number and Distribution of Work Force Participants (Usual Principal and Subsidiary Status Workers) Aged 15 and above, 1993-94 to 2011-12 (millions; percentages in brackets)
77
1.2 Labour Force Participation Rates of Men and Women (UPSS workers aged 15 and above), Rural and Urban Areas, 1993-94 to 2011-12 (percent)
77 2.1 Table 2.1 Mean Male Household Wages and Female LFPRs, Rural Areas, 2004-05 and
2011-12
77 2.2 Table 2.2 LFP Rates for Women and the Ratios of Male to Female LFPRs by Social
Group, 2011-12
78 2.3 Table 2.3 Labor Force Participation among Rural and Urban Women by Education
Levels
78 2.4 Average Wage Rates of Women and Men by Level of Education, Rural and Urban areas 79 3.1 Gender Differences in Activity Status of Workers in Key Sectors 80 4.1R Distribution of Male and Female Workers in Different Occupational Groups in Rural
Areas of States, 2011-12 (percent)
81 4.1U Distribution of Male and Female Workers in Different Occupational Groups in Urban
Areas of States, 20011-12 (percent)
82
ACRONYMS AND ABBREVIATIONS
BCG Boston Consulting Group
BPO Business Process Outsourcing
CII Confederation of Indian Industrie
CWW Casual Wage Workers
FAO Food and Agricultural Organization
GDP Gross Domestic Product
GEWDR Gender Equality World Development Report
GOI Government of India
HBW Home-based Workers
ICT Information and Communication Technology
IFAD International Fund for Agricultural Development
INR Indian Rupees
IT Information Technology
ITES Information Technology-Enabled Services
LFG Labor Force Participation
LFPR Labor Force Participation Rate
MGNREGS Mahatma Gandhi National Rural Employment Guarantee Scheme MKSP Mahila Kisan Sashaktikaran Pariyojana
MPCE Monthly Per capita Consumption Expenditure
MSME Ministry of Small and Medium Enterprises/ Micro, Small and Medium Enterprises
MVA Multivariate Analysis
NABARD National Bank for Agriculture and Rural Development NCO National Classification of Occupations
NGO Non-Government Organization
NIC National Industrial Classification
NMEW National Mission for Empowerment of Women NRLM National Rural Livelihoods Mission
NSS National Sample Survey
NSSO National Sample Survey Organization NPSD National Policy on Skills Development
OAW Own Account Workers
OBC Other Backward Classes
pp Percentage Points
RWW Regular Wage Workers
SASDS South Asia Social Development Sector SASDO South Asia Sustainable Development Office SASSD South Asia Sustainable Development Sector
SC Scheduled Castes
SDI Software Development Industry
SEW Self Employed Workers
SHG Self Help Group
ST Scheduled Tribes
UFW Unpaid Family Workers
UPSS Usual Principal and Subsidiary Status
SUMMARY
Overview
Since economic liberalization in the early 1990s, India has experienced high economic growth and made considerable progress in gender equality in areas such as primary education. However, it fared poorly on gender-parity in labor force participation (LFP). During the period between 1993-94 and 2011-12, female labor force participation rate (LFPR) remained consistently low as compared to male participation. More alarming is the fact that female participation rate declined steadily during the same period, particularly in rural areas.
The low level along with declining trend in rural female LFP poses a serious threat of ‘missing gender’ in the labor force. Although economic growth added jobs for both men and women in India till 2005, Indian women lost jobs in the next seven years, while men continued to gain, thereby widening the gender gap. The actual figures in 2012 suggest that approximately 35 to 40 million women are ‘missing’
from the labor force, had female LFP grown at the same rate as it had between 1999 and 2005. 1 This represents a troubling trend considering the potential of these women to contribute to the country’s productivity.
An international comparison suggests that gender gap in LFPRs is large in India, followed by only some countries from the Middle East, Asia and North Africa where socio-religious restrictions on women created larger gaps. In the regional context, female LFPR in India also fares poorly as compared to its South Asian neighbors viz. Nepal, Bangladesh, Bhutan, Sri Lanka and Maldives. According to World Development Indicators, India ranks 6 th among 8 countries from the South Asia region in terms of female LFP— just above Pakistan and Afghanistan (Figure 1).
To better understand the existing situation, this report investigates gender and female labor force dynamics by drawing mostly on data from five rounds of the National Sample Survey, India, between 1993-94 and 2011-12. Key findings from the study are grouped below in three sections. First section describes the dynamics of female LFP looking at its evolution in previous two decades. The next section presents the drivers of low level of female participation and its declining trend. The last section proposes possible areas of action.
1
Based on World Bank staff calculation on number and distribution of work Force participants aged 15 and above, 1993-94 to 2011-12 (millions). The growth rate between 1999-00 and 2004-05 has been used to project female LFP in 2011-12. The missing numbers are calculated by taking the difference between projected and actual number.
Source: WDI, World Bank
83.1 68.2
59.8 57.2
38 30.3 23 15.9
Nepal Bhutan Bangladesh Maldives Sri Lanka India Pakistan Afghanisthan
Figure 1: Female labor force participation rate (%) across South
Asian Countries
1 Dynamics of female LFP
Female LFP has been both low and declining. The LFPR of women has consistently been less than half that of men in both rural and urban areas. Consecutive
rounds of NSS data show that during the period between 1999-00 and 2011-12, the male participation rate in India was reasonably high and hovered around slightly more than 70 percent. The female LFPR, on the other hand, remained consistently low (at around 30 percent) as compared to the male rate. The same source of data also underscores that the female participation rate declined steadily in India over time, with the decline being more pronounced in rural areas.
The low level of participation and declining trend in participation rate among women poses a serious threat of the ‘missing gender’ in the labor force. The 68 th Round of the NSS (2011-12) provides evidence that the gender gap has continued to increase. Over the last decade, the number of female workers along with female LFPR declined in rural areas. The number of rural women workers dropped by 18.7 million between 2004-05 and 2009-10 in absolute terms. By 2011-12, 1.3 million more females dropped out of the work force— accounting for a total decline of 20 million in female LFP between 2004-05 and 2011-12 in rural areas. Based on trends up to 2005, 160 million women should have been in the work force by 2012 but the actual number was only 126 millions in 2012, which suggests that around 35 million women are ‘missing’ from the labor force.
Female LFPR in rural and urban areas exhibited diverse trends in the last decade. According to NSS data, the female LFPR exhibited a fluctuating trend in rural areas. Between 1999-00 and 2004-05, it increased by 4 percentage points after recovering from a slide between 1993-94 and 1999-00. It then declined again by 13.4 percentage points by 2011-12. The urban female LFPR, on the other hand, was roughly persistent around 20 percent throughout this
period.
One of the reasons for stagnancy in urban LFPR is that job opportunities for urban female workers are confined in few sectors. Case studies of garment manufacturing, the software industry and private household services identify that workspaces have been emerging slowly for women, in manufacturing, construction, trade & repair and software development industries. Manufacturing, across a number of low-income states, including U.P, M.P. and Orissa, have had relatively high percentages of women workers in the urban areas, with the exceptions of Bihar and Jharkhand, where women’s work is depressed.
0 20 40 60 80
1999-00 2004-05 2009-10 2011-12
Fig. 2: Female LFP: Both low and declining
All Males All Females Female LFPR
0 20 40 60
1993-94 1999-00 2004-05 2009-10 2011-12
Rural Females Urban Females
Fig 3: Rural -Urban distribution of Female Labour Force Participation, 1993-94 to 2011-12
(%)
Construction has been a growing sector for women’s employment particularly in urban areas as well.
Among Low Income States, the tribal states of Chhattisgarh, Jharkhand and Orissa have higher shares.
Trade and Repair Services have a very low overall share of rural women workers (2.3 percent), but a higher percentage of urban women workers (10.0 percent).
Overall, female workforce participation is ‘skewed’ in the primary sectors. In 2011-12, almost two- thirds (62 percent) of all women workers were in agriculture,
whereas, only about 13 percent were in manufacturing, and 15 percent (or less) were in service sectors such as construction, education and trade & repair services.
These general trends suggest that women face barriers to entry in male-dominated technology-related work. Industrial modernization involving technology has meant that men may displace women (e.g., in mechanized garment factories), sending women to ‘lower-end’ jobs, particularly in the urban areas. On an average, women got only one out of eight jobs
that were created in the urban areas— the place considered to be the locus of India’s recent GDP growth. As a result, women work mainly and at the bottom of the pyramid, often in informal jobs or home-based work. Formal opportunities are negligible, and can only be accessed by educated and middle–income women.
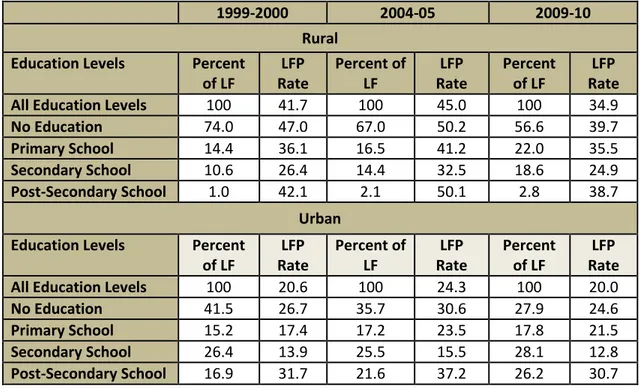
Changes over time show an increasingly educated female work force in urban areas. The share of women in the urban labor force with tertiary, technical and professional education has increased over the past decades. Between 1999-00 and 2011-12, the share of women with graduate and higher degrees increased from 16.9 to 24.0 percent in the urban labor force. In
rural areas, on the other hand, uneducated women had the highest LFPR all throughout. However, it declined from 74 percent in 1999-00 to 56 percent in 2011-12. During the same period, participation of women with primary & middle, and secondary & higher secondary education increased by 7 and 10 percentage points respectively.
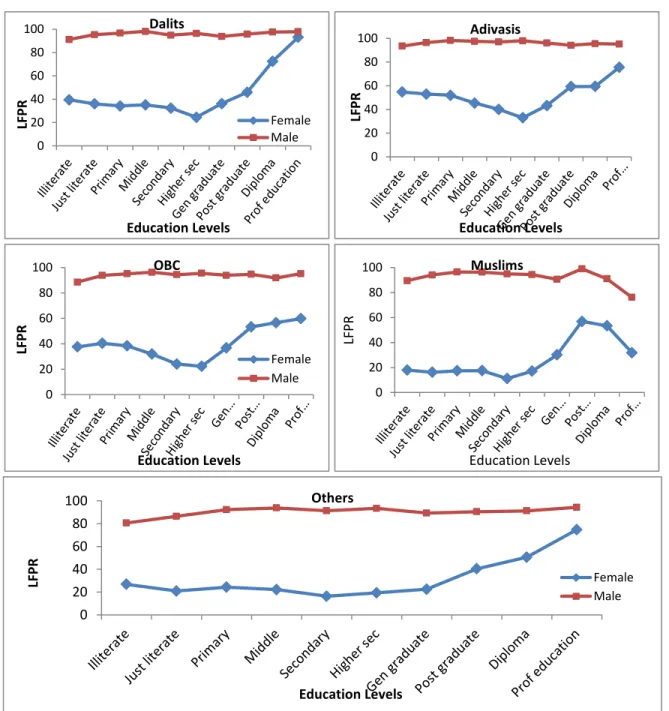
Gender gaps in participation are very large among socio- religious disadvantaged groups. The gender gap in LFPRs is almost 50 percentage points among the socio-religious
disadvantaged groups (Figure 6). Among SC, ST, OBC, Muslims and others, the gap is lowest among the tribal groups, albeit having increased from 22.7 percentage points in 1993-94 to 33.9 percentage points in 2011-12. 2 Muslim women, on the other hand, had the lowest LFPRs of all women (20.2 percent).
While Muslim men had participation rates comparable to others, the lowest female participation rate
2
It is important to note that these socio-religious categories are not homogeneous as geographic and other cultural contexts also shape norms. Thus, LFPRs among ST women, for example, in the Northeast states, reflect the particular culture and history of women’s development in that region which are quite different from those of the Central Indian region.
13% 62%
6%
4% 5% 2%
2% 6%
Fig. 4: Sectoral composition of female labor force participation,2012
Agriculture & fishing Manufacturing Construction Trade and repair services Education Other COP services Private households Others
0.0 20.0 40.0 60.0 80.0
1999-00 2011-12 1999-00 2011-12
Rural Urban
Fig. 5: LFP among Rural and Urban Women by Education Level
Illiterate Upto Primarymiddle
Upto Higher Sec Graduate & above
led to the highest gender gap amongst Muslims (61.1 percentage points in 2011-12). Women in the
‘Others’ category had very low LFPRs (23.6 percent) as well, and there were large gender gaps (52.1 percentage points) among these higher castes and other
religions.
At the state level, three distinct patterns were observed between households’ economic status and female LFPR: (i) states where work participation was greatly depressed and relatively flat irrespective of economic status (‘Bihar pattern’);
(ii) states where there was a sharp decline in female LFP from the poorest to the wealthiest (‘U.P. pattern’); and (iii) states
where there were high participation among the poorest and wealthiest and a strong missing middle, especially for women (‘Himachal pattern’). There were also some unique situations, e.g., Gujarat which showed a sharp decline in the lower end and ‘flatness’ at the upper end of the ladder; and Andhra Pradesh with an unusual ‘soaring middle.’
At the state level, economic growth per se did not enhance women’s LFP. Women’s work participation increases with State Domestic Product (SDP) – up to a point. Female LFP rose linearly with per capita state domestic product (PCSDP) up to a level of about INR 13,000 (in 2009-10 at 1993-94 prices). 3 However, the percentage changes were not related, demonstrating that growth per se did not enhance women’s LFP. This was confirmed by analysis of data for the period when LFP increased among women (1999-2000 to 2004-05), and held in both rural and urban areas in both periods.
Combined Participation Rates (CPRs) in education and labor force show strong gender differentials at the state level. Rural men’s combined participation rates (CPRs) in labor market and education did not differ across states with low, medium or high per capita State Domestic Product (PCSDP). However, both LFPRs and enrolment rates among rural women are directly correlated with per capita state domestic product. The poorest state group clearly had very low opportunities for women’s work and also low educational enrolment of girls.
In terms of age group, education and work participation together provide some insights on state level variations in education or jobs for their youth. 4 Among 15-24 year-old men, CPRs in both rural and urban
3
Nine of 20 states included in this analysis were below a PCSDP of INR 13,000.
4
Enrolment and LFP rates are computed using the same population denominator and can therefore be added to get a
‘ Combined Participation Rate’ (CPR). In India overall, the CPR of 15-19 year-old males was around 96 percent and that of women was 66.3 percent in rural areas and 77.1 percent in urban areas, i.e., about a quarter of urban 15-19 year-old girls and one-third of rural girls of this age were neither studying nor working in 2009-10. The CPRs for rural and urban males in the 20- 24 year age group were around 98 percent. However, females in this age group had considerably lower CPRs, especially in urban areas. Thus, significant proportions of 20-24 year-old women were neither in education nor in the labor force. The reasons for this include the low value associated with female education; social barriers to education and employment; the primacy of marriage, child-bearing and involvement in family care; unavailability of appropriate employment opportunities;
unacceptable employment conditions, and so on. In Chapter 4 we will examine the impact of some of these issues on young women’s activities.
0.0 25.0 50.0 75.0 100.0
Muslim Others OBC SC ST Total
Fig. 6: Labor force participation rate across Socio Religious Group, 2011-12
Male Female
areas were higher than the work participation rates of 25-64 year-olds. For young women, on the other hand, CPRs varied much more widely. In seven states (including four low income states) over 50 percent of 15-24 year-old women were out of school and work. Over the 16-year period of economic growth, the CPRs of rural-urban and men-women increased in some states and declined in others, with no discernible relationship with the level of development, location, or other characteristics of states.
However, one welcoming change is that younger women are slowly filling the gaps.
2 Drivers of low female labor force participation
A segmented labor market, low mobility and low paying unsecured jobs appear to play important roles in holding women back. Low mobility restricted women to being grouped in certain industries and occupations, viz. basic agriculture, human resource management or client interactions, rather than to the technical, managerial or strategy-related jobs.
Labor market segmentation is also influenced by gender biases, socio-cultural practices and geographies. Even in its most dynamic and ‘new’ aspects, the Indian labor market upholds the prevailing socio-cultural beliefs and behaviors that ‘homemaking’ is women’s primary role. This is manifested widely, e.g., in the employment of girls from an early age in the domestic service sector, the preference of both workers and employers for home-based work in the garment manufacturing sector, and the constraints to progression of women in the software development industry. Sectors such as domestic service and garment-making are considered ‘suitable for women.’ Although the latter is an important area in manufacturing and Indian exports, it is associated with women’s traditional work of sewing and tailoring, leading the sub-sector to function in some ways that are less than modern. If women’s work continues to be driven largely by households’ economic
necessity and not by any belief in the intrinsic value of work to women and of women’s work to families and society, these deep-seated practices will continue to hold sway.
A direct relationship was observed between stable earnings by men and low women labor force participation. Men with regular wage or salary had the highest proportion of spouses who were not in the labor force. Based on 2004-05 and 2011- 12 NSS data, the pattern showed that higher the increases in
male wages, greater the decline in the female LFPR. The study also finds that Labor force participation among both women and men is highest among poor households with the lowest consumption- expenditure levels and declines with higher expenditure.
Spatial variation in male-female wage gap across states appears to be significant. Average wage rates for rural women are considerably lower than those for men in all work categories. For example, the ratio of female to male wage was 34 percent in Tamil Nadu, 54 percent in Maharashtra, 55 percent in Andhra, 58 percent in Kerala, and 83 percent in Uttar Pradesh. Moreover, the market wage for female workers was less than stipulated minimum wage in 11 states (Kanchi, 2010). Such wide gaps can be considered potential disincentives for female workers to join the labor force.
0 25 50 75
Poorest Quintile
Second Quintile
Third Quintile
Fourth Quintile
Richest Quintile
Female LFPR(%)
Household wage quilntiles
Fig.7: Female LFP declines with higher male
earnimgs in the household
Female LFPR 2004-05 Female LFPR 2011-12Strict social norms dictate gender roles and low female LFP. The main explanations for India’s very low female LFP are the strict norms that dictate gender roles and behaviors, including women’s seclusion and low investment in girls’ education and skills. Women did not benefit from the jobs generated by economic growth because of the lack of fit between the jobs and women’s endowments, due to low education of girls in the past. When women have to make a choice, the following social priorities often come in the way:
Life-cycle matters. Marriage and child-rearing are associated with lower LFP among women and higher LFP among men. Women in India still marry young and are expected to bear children in quick succession. Young brides and mothers are often secluded; women who have worked before marriage or motherhood may withdraw from work during the childrearing years and seek to re-enter it thereafter.
Care work is first, paid work secondary for women. The responsibility that women bear for care work is another prime reason for them not working. In the vast majority of Indian households, care work is invariably ‘women’s work’ while earning is ‘men’s business,’ giving rise to strong gender asymmetries. Social norms in India still by and large militate against men sharing in care work, so decisions for women not to work are related to life-cycle and household needs. The inadequacy of labor-saving utilities and support services such as child care ties women to homes, or results in the ‘double burden’ on women.
Families’ social status is considered enhanced by women not working in the Indian social context where men are expected to provide for their families. This is particularly true of those who have moved upward to acquire middle- or high-income status – hence, the ‘missing middle.’ Women with regular wage/salaried spouses have the highest likelihood of not being in the labor force.
Women often enter the labor force on adverse terms including low activity status, poor earnings, low-skilled and traditionally-inherited occupations. Out-sourcing in many areas of manufacturing has loosened the chains of inherited work, as has drawing women into factories and work-sheds; and these have enabled a wider acquisition of skills (and even dropping of caste identities).
In sum ‘women working’ depends to a great extent on the acceptance by communities and households. Women work if income is desperately needed by their household (as amongst the poorest), or if the net value added (financially and socially) by their work exceeds the costs of
‘care time foregone.’
3 Direction: Areas for action
There is need for deliberate interventions to enhance women’s employment. The overall experience
of the 1993-2012 period suggests that we cannot assume that growth will improve women’s labor
outcomes. India must take deliberate steps for women to participate in further growth. From policy to
practical intervention, it requires action to reduce gender disparities in labor outcomes, increase
women’s contribution to GDP and growth, and the economic empowerment of women overall. The
actions range from improving education and skills among girls to increasing organization of women in
work, access to services, and provide infrastructure to facilitate access to markets for regular paid work outside the home. Overall, loosening the social norms that constrain women’s work participation.
Women are not a homogeneous group—so, no single solution will fit all. Future policy-making for women’s economic empowerment must distinguish between the three broad groups of women:
(i) low-income women who need better paid/higher productivity work;
(ii) the ‘missing middle’ who need work that is in flexible and in keeping with their skills, education and status; and,
(iii) women in paid work, including young, mobile, relatively more-educated women who could benefit from emerging economic opportunities.
They need to be supported through measures such as improved transport, enhanced safety in public spaces, and arrangements for child and elderly care. Within workplaces, issues such as sexual harassment, ‘invisible’ biases in recruitment and promotion, and flexible work and benefits need to be addressed.
Connect jobs with women. The above differentiation entails two broad approaches for creating women’s work opportunities: ‘bringing work to women’ and ‘bringing women to work.’ One way to bringing work to women is by developing local economies that will increase women’s work within their reach. Similarly, ‘bringing women to work’ will place women in jobs, particularly, in the growing areas of the economy.
Align skills with the market. India has a young population that will continue to enlarge the work force at least until 2026. It consists of over 200 million men and women between 15 and 24 years of age. The fact that almost three-quarters of women in this age-group and half of men are not yet working provides an opportunity to prepare them better for work whether they are in or out of secondary or tertiary education.
Enhance skills for micro, small and medium enterprises (MSMEs). MSMEs are a rapidly growing sector in India, employing about 70 million people and contributing about 45 percent of industrial production and 40 percent of India’s exports. However, only about 7 percent of 30 million enterprises are women- led, pointing to the scope to increase women’s participation.
To conclude, there are three important takeaways overall.
(1) Efforts to increase women's economic participation and productivity need to take into account many different economic and social circumstances in which women are currently positioned.
(2) 'Economic empowerment' requires more than assets, work or income. Education that brings with it new aspirations, and public policies that support changing gender roles play essential parts in helping men and women to break out of traditional roles and expectations.
(3) There is a two-way relationship between the development of new ‘social & gender identities’ and
‘sustainable economic growth with shared prosperity’— each making the other a more realistic
possibility.
1. G ENDER AND L ABOR F ORCE P ARTICIPATION IN I NDIA
1.1 Introduction
Despite two decades of high economic growth and considerable progress towards gender equality in some areas (such as primary education), India fares poorly on gender parity in economic participation.
The female labor force participation rate (LFPR) in 2009-10 (31.6 percent) was not only substantially lower than men’s (80.4 percent) but compared unfavorably also with women in most countries. In 2011- 12, the LFPR for females had come down to 30.7 percent. Although economic growth added jobs for both men and women in India until 2004-05, in the five years that followed Indian women lost about 18 million jobs, leading to the widest gender gap that India has seen in the LFPR over the past 30 years. 5 This report presents an overview of women’s labor force participation in the context of economic growth in India. Based on an analysis of available data and a review of the literature, it documents how labor outcomes and behaviors have changed by gender since India’s economic reforms began in 1992- 93, and examines whether economic growth has been a catalyst for addressing gender differences in labor outcomes.
1.2 The ‘Economic Empowerment’ Framework
In this report labor outcomes are situated within the economic empowerment framework of the 2012 World Development Report on ‘Gender Equality and Development’ (World Bank, 2012). 'Economic empowerment’ is defined broadly in the GEWDR as the accumulation of endowments, the use of endowments to utilize economic opportunities and generate incomes, and the application of
endowments to take action affecting individual and household well-being (or agency). Endowments encompass education, health, land and other assets such as financial resources that women and men accumulate during their lifetimes. Endowments enable individuals to utilize economic opportunities, make choices and take actions, i.e., to exercise agency. The WDR framework has been modified to show economic empowerment as the outcome of a balance between human capital endowments (e.g., education and health), social capital (capital built as a result of being members of community structures, informal institutions and/or social networks) and economic capital (land, assets, infrastructure, and so on). 6 In addition to examining opportunities in the labor market (via labor force participation, both a
5
. However, over the next two years only 1.9 million more females were added to the work force. Data from the 2011-12/68th Round of the NSS, that were released after the data analyses and drafting of this report were completed, show that the gender gap has continued to increase. The number of male workers and the male LFPR increased after 2009-10, but both these figures declined among women. Rural female labor force participation rate which was 49 % in 2004-05 and came down to 37.3% in 2009-10 has come further down to 35.6% in 2011-12. In terms of absolute numbers, there was a drop in the number of rural women workers by 18.7 million between 2004-04 and 2009-10. Over the next two years, there was a further drop of 1.3 million more females from the work force. So something clearly is going on in rural India. Patterns observed in 2009-10 continue in 2011-12 for the various age categories and socio- economic groups.
6
This framework is located within societal norms regarding gender roles and other basic values that inform
household and community behavior.
cause and effect of economic empowerment), the report presents and discusses gender differentials in labor outcomes by age, education, social groups, location, economic levels and family characteristics.
The labor market is discussed in terms of occupational sectors (industry groups) and activity categories (formal and informal work arrangements), and trends over the past two decades. The enabling
environment that generates or supports the ‘three capitals’ – India’s policies and laws governing gender and work and some relevant programs – is also reviewed.
1.3 Women’s Labor Force Participation: India and Other Countries
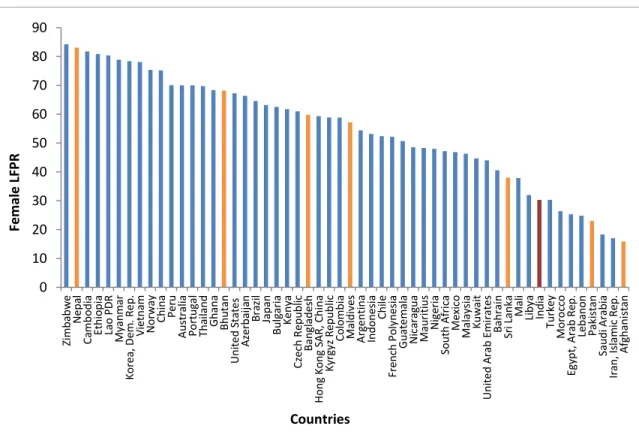
India’s female labor force participation rate is lower than that of women in most other countries (Figure 1.1). These include Nepal, Bangladesh and Sri Lanka in South Asia and most countries in Africa, Asia and Latin America – in fact all countries excluding some significant Islamic ones such as Egypt and Iran, and Pakistan and Afghanistan in the region. The gender gap in LFP rates is also large in India, with only a few countries in the Middle East, Asia and North Africa, where socio-religious restrictions on women prevail, having larger gaps. Inter-country comparisons also show that the LFPR of urban women in India is especially low.
Figure 1.1 Female Labor Force Participation Rates in Selected Countries (15-65 years), 2010
Note: The blue bars include a range of high-income, middle-income and low-income countries around the world; the red bars are countries in South Asia, and India is shown in dark red.
Source: World Development Indicators, World Bank, Washington D.C., 2010.
0 10 20 30 40 50 60 70 80 90
Zi m ba bw e N epa l C am bo di a Et hi o pi a La o P D R M yan m ar Kor ea, De m . R e p. Vi et na m Nor w ay C hi na P e ru A us tr al ia P o rt ug al Tha ilan d G ha na B hu tan Uni te d St at es A ze rba ija n B ra zi l Jap an B ul gar ia Ke ny a C ze ch R epu bl ic B an gl ad esh H o ng Ko ng S A R , C hi na Kyr gy z R epu b lic C o lo m bi a M al di ve s A rg ent ina Ind o ne si a C hi le Fr enc h P o ly ne si a G ua te m al a N ic ar ag ua M au ri ti us N ig er ia So ut h A fr ic a M exi co M al ay si a Kuw ai t Uni te d A rab E m ir at es B ah rai n Sr i L an ka M al i Li by a Ind ia Tur ke y M o ro cc o Eg ypt , Ar ab R ep. Le ba no n P ak ist an Sau di Ar ab ia Ir an , Is lam ic R ep. A fg ha ni st an
Fem al e LFPR
Countries
1.4 The Indian Growth Story
Low female labor force participation has persisted in India despite two decades of high economic growth. This section describes how growth unfolded in India to set the stage for further analysis of male and female LFP during this period.
In response to a macroeconomic financial crisis in 1991, India liberalized its economy substantially in five important areas: fiscal policy (particularly taxation), the capital account and foreign direct investment, international trade and tariffs, the financial sector (banks, loans, deposits, insurance, the stock market, and so on), and the role of the state (particularly in licensing, revenue generation and expenditure).
GDP growth increased from 0.8 percent in 1991-92 to 5.3 percent in 1992-93, 6.2 percent in 1993-94, and over 7 percent in each of the next three years (Acharya, 2002). This was accompanied by real growth in manufacturing, exports, investment (especially industrial) and savings. The second half of the decade saw slower GDP growth (down to 4.8 percent), resulting in the 1990’s averaging out to slightly below 6 percent. Both industrial growth and agricultural growth rose and fell – the former fell from 7 to about 4.5 percent; the latter had risen to almost 5 percent in the first half of the decade, but declined to 2 percent in the second half. It is the services sector that helped maintain economic growth in the 1990’s, increasing from 6.7 to 7.8 percent, and contributing 60 to 70 percent of growth in that decade.
This ‘boom and bust’ during the 1990’s was followed by a spurt of growth between 2003 and 2008 (the most rapid since Independence), averaging over 8 percent. Manufacturing grew by 8.8 percent per year, and services by 9 percent. Industrial growth was wide-ranging – from basic commodities and beverages to textiles and transport (Panagariya, 2008). The leading sectors were capital goods, communications and business services. During this period, exports of goods and services doubled in current monetary terms and as a percentage of GDP; gross investment, foreign investment, savings and remittances all rose substantially. Although the GDP growth rate fell to about 4 percent in 2007-08 it rallied in the three subsequent years, declined to a low 5.0 percent in 2012-13, and is expected to fall below this in 2013-14.
Were the periods of growth accompanied by increases in labor force participation, a component of ‘total factor productivity’? There is a strong relationship between GDP growth and the growth of working-age populations across countries (Bloom and Williamson, 1998); and growth in India’s working-age
population up to 2025 was expected to contribute (at least) 1.3 percent to the GDP growth rate (Rodrik and Subramanian, 2004). An implicit assumption, however, was that jobs would be created for (or by) the increasing work force. Unfortunately, the evidence of the past 20 years in India does not show that increases in GDP and labor demand go together. Despite GDP growth in the 1990’s, employment growth slowed down relative to the 1980’s in both rural and urban areas. This drop in (or lack of) employment elasticity of growth – commonly known as ‘jobless growth’ in India – held in the aggregate and across sectors, with the exception of a few tertiary sectors. 7
7
. These were transport, storage and communications, finance, insurance, real estate, and business services. See Chapter 3.
1.5 India’s Labor Force in the ‘High Growth’ Period
Table 1.1 shows the size and composition of the work force over the 16 years covered by the surveys.
While 61 million persons were added to the work force between 1999-2000 and 2004-05, only 7.9 million were added between 2004-05 and 2009-10. And while the male work force increased by 25.9 million during this last crucial five-year period, distributed across rural and urban areas, the number of women in the work force actually declined by 18.2 million in this time, specifically in rural areas. This decline is significant cause for concern.
Table 1.1 Number and Distribution of Work Force Participants (Usual Principal and Subsidiary Status workers aged 15 and above) 8 , 1993-94 to 2009-10 (millions;
percentages in brackets)
1993-94 1999-00 2004-05 2009-10
Rural Males 181.2 (64.9) 192.4 (65.9) 214.8 (64.2) 227.9 (69.30) Rural Females 98.2 (35.1) 99.5 (34.1) 119.7 (35.8) 101.0 (30.7) Rural Persons 279.4 (77.7) 291.8 (75.5) 334.5 (74.8) 328.9 (72.2) Urban Males 63.6 (79.5) 76.3 (80.6) 89.5 (79.3) 102.6 (81.1) Urban Females 16.4 (20.5) 18.4 (19.4) 23.4 (20.7) 23.9 (18.9) Urban Persons 80.0 (22.3) 94.7 (24.5) 113.0 (25.2) 126.5 (27.8) All Males 244.8 (68.1) 268.6 (69.5) 304.4 (68.0) 330.5 (72.6) All Females 114.6 (31.9) 117.8 (30.5) 143.1 (32.0) 124.9 (27.4) All Persons 359.4 (100.0) 386.5 (100.0) 447.5 (100.0) 455.4 (100.00) Source: Raveendran, BG 2012:6
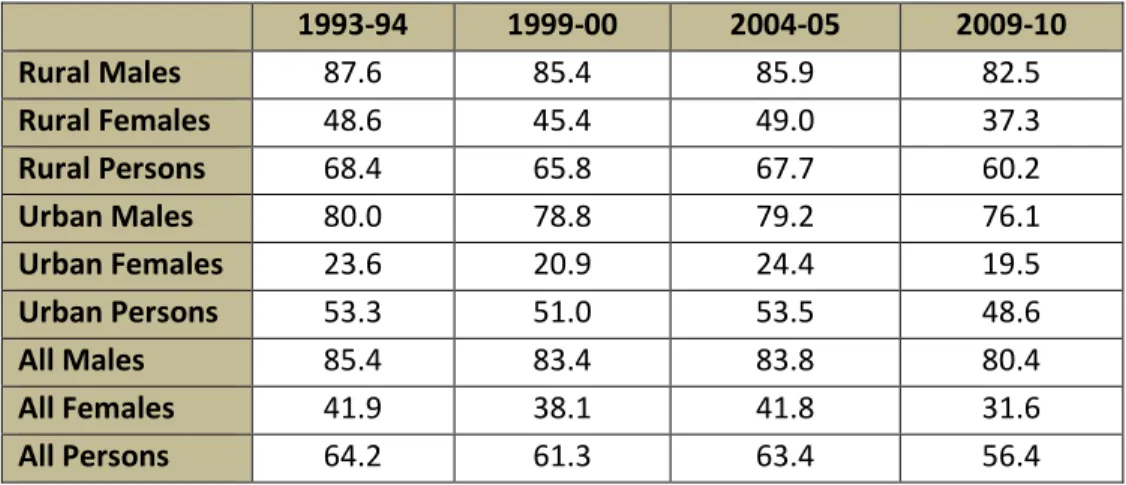
Table 1.2 Labor Force Participation Rates of Men and Women (UPSS workers aged 15 and above), Rural and Urban areas, 1993-94 to 2009-10 (percent)
1993-94 1999-00 2004-05 2009-10
Rural Males 87.6 85.4 85.9 82.5
Rural Females 48.6 45.4 49.0 37.3
Rural Persons 68.4 65.8 67.7 60.2
Urban Males 80.0 78.8 79.2 76.1
Urban Females 23.6 20.9 24.4 19.5
Urban Persons 53.3 51.0 53.5 48.6
All Males 85.4 83.4 83.8 80.4
All Females 41.9 38.1 41.8 31.6
All Persons 64.2 61.3 63.4 56.4
Source: Raveendran, 2012 BG:6
8
. ‘Usual Principal and Subsidiary Status’ (UPSS) combines ‘Usual Principal Status’ (UPS) and ‘Subsidiary Status’ (SS). UPS refers
to a person’s major activity status during the 365 days preceding the survey (i.e., what s/he spent most of her/his time doing
during the reference period. SS refers to the major activity status of a person for 30 days or more during the reference period.
Gender differences in labor force participation rates. Clearly evident in Table 1.2, the LFP rates of women have been consistently low and less than half those of men in both rural and urban areas.
Further, all LFPRs were lowest in 2009-10, and the decline was entirely contributed by women. Over the 16-year period there was a reduction of 10.3 percentage points (pp) in the LFPR of women, and about 5.0 pp in the LFPR of men. The reduction in the rural female LFPR was 11.3 pp, and in urban areas it was 4.1 pp. In both areas the 16-year declines, as well as those between 2004-05 and 2009-10, were lower among men.
The GEWDR pointed out that income growth by itself does not lead to greater gender equality on all fronts (World Bank, 2012). How growth has ‘played out’ is important, as well as how formal and informal institutions and markets have functioned and interacted with the realm of household decision- making. For example, the availability of income due to growth may have led to more schools and, with larger markets creating opportunities for women’s work participation, more girls may have been sent to school, a result of household decision-making. In the Indian context the lack of responsiveness of the gender gap in LFP during India’s high growth period may in part be due to the very low levels of secondary and tertiary education among women, and the poor health of women, both of which make for poor human capital. Clearly, economic endowments and ‘institutions’ in this sphere were also not able to contribute adequately to improve labor outcomes for women, particularly because of regressive societal norms.
The larger context within which these analyses were conducted was that of ‘jobless growth’ (Ghosh, 2009a). 9 Liberalization in India has not been associated with feminization of the labor force, the exception being agriculture and a few export-oriented sectors. 10 Further, the share of formal
employment fell from 9 percent in 1999-2000 to 7 percent in 2009-10. Hence, the challenge of having growth associated with the growth of ‘good jobs’ is even greater.
Conversely, high levels of labor force participation are viewed as desirable for growth, and a small gender gap in LFP is not only good from an equality perspective but is also ‘smart economics’ (World Bank, 2006). The economic literature on gender inequality holds that reductions in gender gaps are associated with faster economic growth. This has been shown in several theoretical papers that
emphasize that lower gender inequality is associated with faster human capital accumulation (e.g., Galor and Weil, 1996; Doepke and Tertilt, 2009; Lagerlof, 2003; Blackden et al., 2006) as well as empirically (Hill and King, 1995; Dollar and Gatti, 1999; Tzannatos, 1999; Klasen, 2002; Klasen and Lamanna, 2009).
9
While economic growth has been unprecedented, levels of inequality and social exclusion have also been marked. It is increasingly accepted that growth without equity cannot lead to sustainable development. The 11
thFive Year Plan recognized that growth had bypassed many groups such as a majority of the large workforce in the informal sector, women, Scheduled Castes, Scheduled Tribes, minorities and prioritized the massive effort at employment creation, of the right quality, and decent conditions of work for all sections of population. See GOI, 2007 for more details. There are inherent inequalities within society which are leading to increasing social exclusion. Feminization of poverty and the feminization of agriculture is on the increase.
See also, Mehta et al., 2011: 134, Basu, 2008 ; Chaudhury, S. and M. Ravallion 2006 and Rao et al., 2007.
10.
While women are increasingly the backbone of the agriculture sector, there has been an overall decline in the share of
agriculture in employment from 70 percent in 1993-94 to 53 percent in 2009-10.
1.6 Barriers to Women’s Work Participation
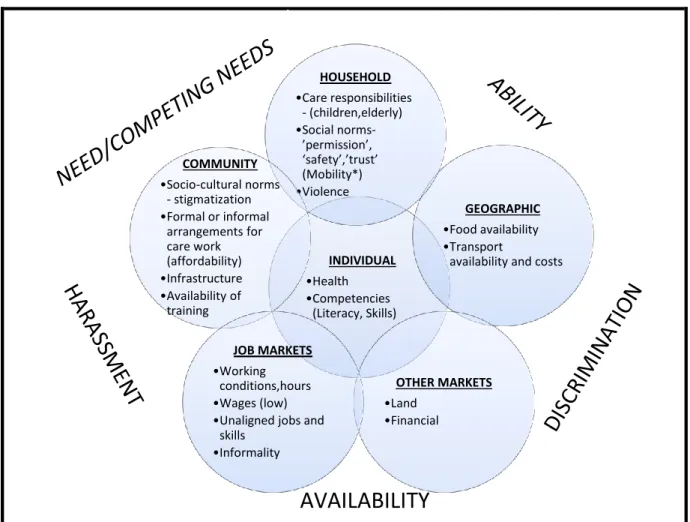
What have been the barriers to women's work participation, and what are the related policy
implications? Some of the key barriers are identified in Figure 1.3 which organizes them into Individual, Household, Community, Market and Geographic groups and identifies some broad related phenomena (e.g., Ability, Need, Discrimination, and so on). There are supply-side barriers such as low competencies (in the Individual arena), the social norm of marriage and motherhood being ‘preferred’ for women over work (shown in the Community and Household arenas), and women’s care responsibilities being
considered their primary role (a situation that plays out in the Household, Community and Job Market arenas). Male and female workforce decisions are inter-dependent, and women’s participation, in particular, is subject to being able to balance work and care. Another set of barriers is related to the inadequate demand for women workers. This includes the poor alignment of jobs with women’s skills, working conditions that discourage female participation, and low rates of formal employment
generation (all in the Job Market arena), and constraints in the financial and land markets (Other
Markets). This report discusses many (but not all) of these barriers with a view to identifying what could be done about them to progress toward more gender-equal work participation.
Figure 1.2 Barriers to Entry into the Labor Market for Indian Women
INDIVIDUAL
•Health
•Competencies (Literacy, Skills)
GEOGRAPHIC
•Food availability
•Transport
availability and costs HOUSEHOLD
•Care responsibilities - (children,elderly)
•Social norms-
’permission’,
‘safety’,’trust’
(Mobility*)
•Violence COMMUNITY
•Socio-cultural norms - stigmatization
•Formal or informal arrangements for care work (affordability)
•Infrastructure
•Availability of training
OTHER MARKETS
•Land
•Financial JOB MARKETS
•Working conditions,hours
•Wages (low)
•Unaligned jobs and skills
•Informality
AVAILABILITY
1.7 How ‘Gender and Economic Empowerment’ Unfolds
In subsequent chapters of this summary report we examine gender differences in India’s labor outcomes as determined by ‘consumption expenditure,’ social groups and education (Chapter 2), and also look at labor market variations by sectoral/occupational categories and work arrangements within the formal and informal sectors, 11 (Chapter 3) and by geographies, including rural and urban, and different states (Chapter 4). Disparities in labor force participation and wages are strong across geographical regions, between occupational/economic sectors and activity categories, and among social, educational and economic groups, and gender differentials persist throughout.
In addition to the individual correlates of labor force participation and aspects of the job market that have been analyzed quantitatively, we discuss some of the Household and Community barriers in Figure 1.3, notably, family/care responsibilities and women ’s agency/organization (in Chapter 5), and access to
‘Other Markets’ land and infrastructure (Chapter 6). It may be clarified that some factors are both correlates of LFP and outcomes. For example, consumption expenditure at the household level would be a correlate of LFP but LFP would also affect current consumption expenditure. Chapter 7 presents an overview of policies in India that are related to women’s employment and Chapter 8 provides the report’s conclusions.
11
. In the NSS, economic activities are classified into ‘industry groups’ and the surveys up to 2009-10 used the National
Industrial Classification – 2004 (NIC-2004). Unless otherwise specified, this report uses NIC-2004, but it also refers to the
industry groups as ‘economic activities,’ ‘occupations’/occupational groups or sectoral activities (sometimes grouped into the
Primary, Secondary and Tertiary sectors, and at other times disaggregated into more specific economic activities). An
alternative classification, the National Classification of Occupations – 2004 (NCO-2004) is used in some cases, with appropriate
identification (and explanations, where necessary).
2. K EY C ORRELATES OF L ABOR O UTCOMES 2.1 Focus on Three Significant Correlates
This chapter first presents the relationship between labor outcomes and household consumption expenditure levels, an indicator of ‘economic status’ or ‘standard of living’ and of relative poverty or wealth in a given geography. This is followed by an examination of LFP among different social groups.
The chapter then discusses two complementary aspects of another significant correlation of labor outcomes, education: the role of education in determining LFP among women and men, including the nature of the work they are involved in, and India’s recent educational progress with a gender
perspective. Present trends in employment and earning are the result of past trends in education, and present trends in education portend labor outcomes in the years to come. Thus, gender inequalities in education provide insights to the gender dynamics of economic empowerment; these can in turn help us understand what needs to be done in education to improve gender equality in the labor market. Of the three correlates discussed in this chapter, education is the most amenable to intervention to enhance labor force participation.
2.2 Household Economic Status and Work
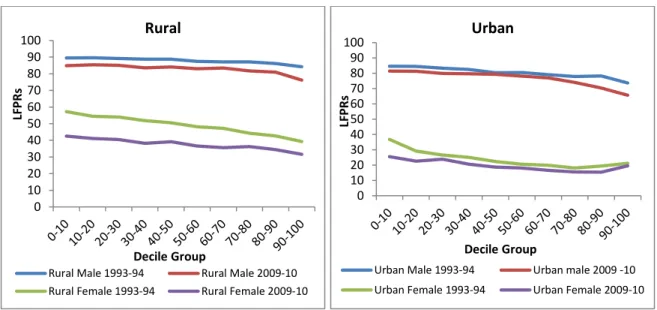
Labor force participation among both women and men is highest in the households with the lowest consumption-expenditure levels and declines with higher expenditure. 12 While LFP rates for rural men in 2009-10 hovered around 85 percent in the first three monthly per capita consumption expenditure (MPCE) deciles, they were between 40 and 42 percent among rural women in these groups (Figure 2.1).
Thereafter there was a gradual decline in LFPRs with MPCE deciles. Rural women from the poorest deciles had a 25 percent higher participation rate than those in the richest decile. Urban women had extremely low participation rates, far lower than those of urban men. The LFPR declined from about 25 percent for the poorest decile to about 15 percent for the eighth and ninth deciles, but increased slightly in the ‘richest’ decile to 19.5 percent. This participation pattern is referred to as a ‘U-shaped curve.’
Over time the poorest women fared the worst. The decline in LFPR among women between 1993-94 and 2009-10 was about 15 percentage points (pp) among rural women in the poorest decile (which had the highest LFPRs) (i.e., from 57.3 to 42.5 percent), but only 5 pp among rural men (from 89.5 to 84.8 percent). The same decline occurred in the top decile of men, but it was less pronounced among this decile of women compared with other women – only about 8 pp. The poorest women were the most significant ‘losers’ of work over the 16-year period of economic growth.
12
. The National Sample Survey includes data on household consumer expenditure, i.e., expenditure on food, tobacco and intoxicants, fuel and light, clothing and footwear, miscellaneous goods and services, and durable articles that are consumed by each household. These items may be acquired from the market, through exchanges of goods or services, gifts, charity or borrowing, home-grown stock or free collection; their monetary value is used to compute consumption expenditure. For a household, the monthly per capita consumption expenditure (MPCE) is its total consumer expenditure divided by its size and expressed on a monthly (30-day) basis. Households can be ordered on the basis of their MPCE and divided into ten
numerically-equal groups, giving ‘MPCE deciles.’ It is important to note that the monetary range of a decile is variable between
rural and urban areas and among states. Hence, the deciles are a measure of relative poverty or affluence in a given location
and are not absolute levels. (The decile groups were computed for each of the major states and grouped smaller states and
union territories to take into account state-wise variations in the levels and patterns of consumption.)
The fall in the five years between 2004-05 and 2009-10 was also most significant for the poorest groups. For example, there was a reduction of over 10 pp in the poorest decile of rural women. For the next four deciles the LFPRs were slightly lower than the first decile. From the sixth decile onwards, there was a further reduction. Rural women’s LFPRs in 2009-10 were 2 to 4 pp lower than in 2004-05 among all deciles, and the LFPRs of urban women were also significantly lower.
Figure 2.1 Labor Force Participation Rates of Women and Men by MPCE Decile Groups, All-India Rural and Urban, 1993-94 and 2009-10
Source: World Bank staff
The MPCE curve shows that women’s work participation is strongly embedded in poverty. Whether (and, if so, how) their work helps their households out of poverty or just to survive is an open question.
This calls for greatly improving the returns to poor women’s labor, be it in wage work, farming or the myriad ‘own account’ production or trade activities in which poor Indian women are engaged. As the poorest women had the greatest decline in LFPRs during the period of high economic growth there is a great need to create alternative employment opportunities for them.
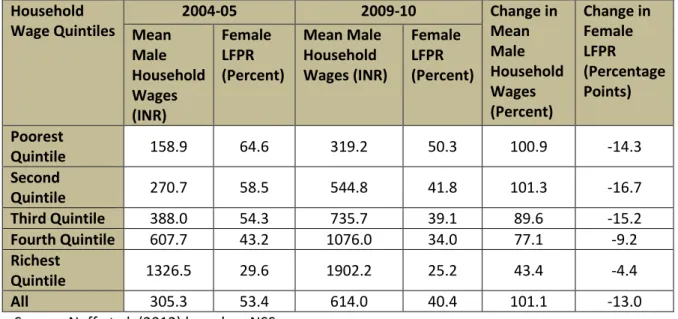
2.3 Household Wages and Women’s Labor Force Participation
There is a direct relationship between increasing household earnings by men and decreasing women’s participation (Table 2.1) – the greater the increase in male wages, the greater the decline in the female LFPR (Neff et al., 2012). This effect has been ascribed to the withdrawal of social ‘permission’ for women to work (Klasen and Pieters, 2012; Srivastava and Srivastava, 2010); women exercising the option of not working in activities that they do not like or consider appropriate to their status or qualifications (Das and Desai, 2003); and women taking on more household responsibilities (Neff et al., 2012). It is also supported by research that indicates that women’s labor force participation increases in times of economic crisis (e.g., Klasen and Pieters, 2012; Rangarajan et al., 2011; Himanshu, 2011).
Significant distress-related ‘feminization of work’ is also found in regions experiencing drought or
0 10 20 30 40 50 60 70 80 90 100
LF PRs
Decile Group
Rural
Rural Male 1993-94 Rural Male 2009-10 Rural Female 1993-94 Rural Female 2009-10
0 10 20 30 40 50 60 70 80 90 100
LF PRs
Decile Group
Urban
Urban Male 1993-94 Urban male 2009 -10
Urban Female 1993-94 Urban Female 2009-10
famine. Under these circumstances women’s work increases in the farm sector (rather than the non- farm sector) as a result of the household ‘coping strategy’ of women managing agriculture while men migrate in search of other work (Abraham, 2009).
Table 2.1 Mean Male Household Wages and Female LFPRs, Rural areas, 2004-05 and 2009-10 Household
Wage Quintiles
2004-05 2009-10 Change in
Mean Male Household Wages (Percent)
Change in Female LFPR (Percentage Points) Mean
Male Household Wages (INR)
Female LFPR (Percent)
Mean Male Household Wages (INR)
Female LFPR (Percent)
Poorest
Quintile 158.9 64.6 319.2 50.3 100.9 ‐14.3
Second
Quintile 270.7 58.5 544.8 41.8 101.3 ‐16.7
Third Quintile 388.0 54.3 735.7 39.1 89.6 ‐15.2
Fourth Quintile 607.7 43.2 1076.0 34.0 77.1 ‐9.2
Richest
Quintile 1326.5 29.6 1902.2 25.2 43.4 ‐4.4
All 305.3 53.4 614.0 40.4 101.1 ‐13.0
Source: Neff et al. (2012) based on NSS.
2.4 Labor Force Participation and Social Disadvantage 13
Socio-religious background is significantly related to women’s labor force participation. Several socio- religious groups in India are both economically and socially disadvantaged, notably the Scheduled Castes (SCs or Dalits), Scheduled Tribes (STs, some of whom are known as Adivasis) and Muslims. An
examination of their labor outcomes, and of gender differentials in these, is important to understand the extent to which the enhancement of work opportunities must be made socially (in addition to gender) inclusive. When these groups were compared, hardly any differences were found among them in men’s work participation, but women’s LFPRs were markedly different (Figure 2.2). The highest rates were among STs and SCs, and the lowest among Muslim women (Table 2.2). High participation among Scheduled Tribe women is usually ascribed to the central role they play in tribal culture and economy. 14 Tribal groups are amongst the poorest in India but experienced a consistent decline in women’s LFPRs through the period of the four surveys (data not shown) as a result of reduced access to the natural resources that are the bases of their livelihoods, including forest-based, farm and non-farm production.
13
. In this report (as in most Indian documents), those belonging to the ‘Scheduled Tribes’ or ‘Scheduled Castes’ are regarded as belonging to these specific social groups, irrespective of their religion. The ‘Other Backward Classes’ (OBCs) are a separate group, excluding Muslims. And all Muslims except those classified as Scheduled Tribes are another group. The remaining socio- religious groups are combined into an ‘Others’ category.
14
. Scheduled Tribes constitute about 8.25 percent of India’s population and most live in areas that are difficult to reach. SCs
account for 17 percent of the Indian population and are spread throughout rural and urban areas of the country.
Gender gaps in Participation are also very large in these disadvantaged groups. The gender gap in LFPRs was also lowest in the tribal group, but it increased from 22.7 percentage points in 1993-94 to 35.0 pp in 2009-10. This is sometimes ascribed to ‘cultural mainstreaming,’ a process that, inter alia, erodes the more gender-egalitarian aspects of tribal society and imposes more patriarchal values and practices. 15 Dalit women had the second highest LFPRs among social groups most likely, again, due to their poverty, and the gender gap in the Dalit LFPRs was about 38-39 pp until 2004-05 but increased further to 46.5 pp in 2009-10. Expanding work opportunities for Dalits is needed also to help them break out of stigmatized situations and occupations and obtain ‘decent’ work to reduce poverty.
Although Muslim men had participation rates comparable to Others, Muslim women had the lowest LFPRs of all women, and the gender gap was highest amongst Muslims (62.8 pp in 2009-10). While Muslim populations in India are also amongst the poorest, women’s LFPRs are low among them as social norms, apparently stronger than the pressures of poverty, result in their seclusion, a situation that also calls for special approaches to enhance women’s work participation. 16
Women in the Others category had very low LFPRs and there were large gender gaps among these higher castes and other religions. This situation arises from the higher economic and education levels of these women. As discussed above, in higher status households women tend to withdraw from paid market work. Indeed, a process of ‘Sanskritization’ is occurring in women’s work participation among all social groups, leading to the decrease of differences in the freedoms of ‘mobility’ and ‘autonomy.’ 17 Table 2.2 LFP Rates for Women and the Ratios of Male to Female LFPRs by Social Group, 2009-10
Female LFPR M:F LFPR Ratio
Muslims 18.3 4.4
Others 23.2 3.3
All Women 31.6 2.5
Other Backward Classes 35.1 2.3
Scheduled Castes 36.3 2.3
Scheduled Tribes 49.9 1.7
Source: World Bank staff
15
. It is important to note that these socio-religious categories are not homogeneous as geographic and other cultural contexts also shape norms. Thus, LFPRs among ST women, for example, in the Northeast states, reflect the particular culture and history of women’s development in that region which are quite different from those of the Central Indian region.
16
. LFPRs fall off more sharply after the age of 45 years for STs, Dalits and women from Other Backward Classes compared with their better-off counterparts, possibly because of worse health among the poorer groups. Details about other disadvantaged groups including the disabled and female-headed households were not available. However,o’Reilly has written extensively on the discrimination faced by disabled women in employment. This is a global trend. See, O’Reilley, 2003, 2007 for more details.
17