Nepal
Priorities and Strategies for Education Reform
July 18, 2001
Human Development Unit South Asia Region
Document of the World Bank
Public Disclosure AuthorizedPublic Disclosure AuthorizedPublic Disclosure AuthorizedPublic Disclosure Authorized
BPEP II Basic Primary and Education Project II
CERID The Research Center for Educational Innovation and Development DEO District Education Officer
DDCs District Development Committees DOE Department of Education
ECD Early Childhood Development GER Gross Enrolment Ratio
GDP Gross Domestic Product
HSEB Higher Secondary Education Board
ICIMOD International Centre for Mountain Development MOES Ministry of Education and Sports
NER Net Enrolment Ratio
NGOs Non-Governmental Organizations NLFS National Labor Force Survey NLSS Nepal Living Standard Survey
NRs. Nepal Rupees
OLR Overall Literacy Rate PCL Proficiency Certificate Level
SLC School Leaving Certificate SMCs School Management Committees UNICEF United Nations Children's Fund VDCs Village Development Committees
Vice President Mieko Nishimizu Country Director Kenichi Ohashi Sector Director Richard Skolnik Team Leader Grant Sinclair
Task Leaders Brajesh Panth / Keith Hinchliffe
Acknowledgements
Executive Summary ... i
Introduction ... 1
CHAPTER 1 Education and Development .2
Introduction .2
Economic growth, poverty and education .2
Education provision - a snapshot .. 5
The importance of education ... ... 5; 5
CHAPTER 2 Educational Outcomes .6
A review of the outcomes .6
CHAPTER 3 Diagnosis of the Outcomes .11
Coommon pvrSQptions ., ... ...
I,,,.,,,.,
,,,,,,,,,I.,,, 11
Explaining the outcomes ... 12
System management and financing .16 Conclusion. .18
CHAPTER 4 Areas for Intervention .19 Framework for reform .20 Financial constraints .29 Conclusion .31
CHAPTER 5 Conclusion .32
References ... . 34 Annexes ... 39 Annex A: Education System in Nepal
Annex B: Focus Group Discussions: Headteachers Annex C: Focus Group Discussions: Sunsari District
Annex D: Survey of Education Offices on School Effectiveness Annex E: Focus Group Discussions: Student Unions
Annex F: Focus Group Discussions: I'eacher Unions Annex G: Key Tables on Public Expenditure
Annex H: Key Tables from Projections Model
Annex I: Survey of Public and Private Schools in Kathmandu Valley
The report was prepared in SASHD by Brajesh Panth (task leader) and Keith Hinchliffe, and is based on materials prepared by, and following discussions with, a large team of Nepali
consultants including: Professor Yagya Raj Pant, Min Bista, Shiva Raj Lohani, Madhav Mainali, Professor K.P. Malla, Savitri Singh, Bijaya Thapa, Sushan Acharya, Keshar Khulal, Devendra Shrestha, Dilip Parajuli, Dil Prasad Shrestha, Bihari Krishna Shrestha; Rajendra Dhoj Joshi and Shailendra Sigdel. Audrey Aarons, Grant Sinclair and Rajendra Dhoj Joshi provided much advice during the preparation of the report and Bidhan Maharjan and Gertrude Cooper provided administrative support over the whole period. The Research Center for Educational Innovation and Development (CERID) helped to carry out a series of focus group discussions with teacher unions, student unions, senior administrators, head teachers and politicians. Peer reviewers were Adriaan Verspoor, Fernando Reimers and Harry Patrinos. Asif Faiz also provided written comments. In addition to the many who took part in the focus group discussions, others gave their time including officials of the Ministry of Education and Sports, National Planning Commission, Ministry of Finance and employees of donor agencies in Kathmandu. The report has benefited from comments on an earlier draft received from the Donor Coordination Section of the Ministry of Education and Sports.
EXECUTIVE SUMMARY Introduction
1. Over the past five decades, the educational system in Nepal has successfully concentrated on increasing the access to primary schools to 65 percent of the children in the relevant age group, and on developing the foundations of secondary and tertiary education. Literacy has increased from five percent to over forty percent of the population. These achievements constitute the first phase in the educational development of the country. As the pressures to further expand the system intensify, so do concerns over its equity and the quality of the
education which is provided. The responses to these pressures and concerns, many of which will need to be made over the next few years, will determine the future structure and strength of the system. The objective of this report and, equally important, of the processes which underlie it, is to help the Government in this task. The report identifies a number of key constraints which currently are hindering the development of the system and, building on recent Government policy initiatives, suggests priorities and strategies for organizing and managing the required changes.
2. The process underlying the development of this report has been in three parts. First, several analytical reviews of the separate educational levels and of cross cutting key issues were undertaken by an integrated team of national consultants. These were then combined into four separate free standing papers on management, quality, financing and tertiary/technical/vocational education. The papers provide an exhaustive account of the education system in Nepal only a small part of which is incorporated in this report. Second, within the team a vision of the
educational system in Nepal in twenty years time emerged and was subjected to a comprehensive enrolments and financial projections model and the financial feasibility of various scenarios assessed. Again, only a short summary of the results is incorporated in this report. Third, reactions to the analyses and to the emerging issues and alternative strategies for reform were sought through several focus group discussions with key stakeholders including teachers, principals, district education officers, program coordinators, policy makers, politicians and members of student unions. This report is just one result of these activities which have been undertaken to broaden and deepen the debate on education reform in Nepal. It is not the final activity. The intention is that its dissemination, in a variety of forms and gatherings, will provide a useful basis for further debate.
The Importance of Education
3. Educational development is potentially a key factor in reducing the incidence of poverty, raising overall levels of labor productivity and economic growth and improving the quality of life through empowering the population to take informed decisions across a wide range of activities.
In each of these areas, Nepal is lagging. With a per capita income of only US$220 per annum the country is the ninth poorest in the world. Slow economic growth and high population growth have combined to reduce the rate of per capita income growth to the lowest in the region and nearly half of the population remains below the poverty line. Health indicators are very poor, even for the region. In Nepal, as elsewhere, there is a strong correspondence between educational attainment and individual and household earnings and between mothers' education and fertility rates, child nutritional status and morbidity. An effective development strategy needs to give
high priority to programs and policies which both raise the productivity of the labor force and
improve the quality of life of the whole population, and especially that of women. Education
programs and policies have a central role in achieving these objectives.
4. The modem education system in Nepal is one of the youngest in the world and operates within a political democracy that was established only in 1991. Not surprisingly, while parts of the system have been well designed and are implemented effectively, others remain in an embryonic stage and are only partly effective. Over the past five decades, there have been considerable quantitative achievements. From the situation in 1951 when there were only 321 primary schools, 11 secondary schools and 250 university graduates currently there are over 3.4 million children enrolled in 23,000 primary schools, 360,000 students in about 3,300 secondary schools and over 80,000 students enrolled at the tertiary level. The literacy rate has increased from less than five percent (less than one percent for females) to over 40 percent. From a period of extremely limited access enjoyed exclusively by the most privileged social groups, the education system has opened up to a larger population particularly at the primary level. In addition, increased attention has been given by Government to developing new curriculum, distributing free textbooks and providing teacher training as well as attempting to reach out to communities which are particularly educationally disadvantaged. In spite of these successes, however, there is a general acceptance that access to primary education is still far from universal, that post primary education requires structural reforms and that the quality of education received by the majority of students at all levels is unacceptably low. Both the low rates of primary school completion and the dramatic increase in enrolments in the private educational institutions over the past decade indicate that the outcomes of the public education system need to improve
significantly. The purpose of the report is an attempt to document, explain and provide some suggestions for overcoming the shortcomings of the system.
5. Analyses of the various levels of the education system, and of its management and financing, provide an assessment of the current status. Six aspects of this are highlighted.
6. Levels of literacy and educational attainment remain low. Of the population aged fifteen years and over in 1995, 81 percent of females and 46 percent of males were illiterate. Only one in every three adults is literate. Literacy rates vary substantially by geographicaVecological area and income levels. In the mountains, less than one in four persons is literate, including less than one in ten women. Of the poorest two thirds of the population, only 43 percent of males and less than 11 percent of females are literate.
7. While access to all levels of the education system has increased considerably, participation remains unequal across income and social groups and the benefits of public subsidies are
inequitably distributed. There are large differences in gross enrolment rates across
geographic/ecological areas and income levels. The rates in primary schooling range between 64 percent in the Eastern Terai to 104 percent in the Eastern hills/mountains, and from 68 percent for the poorest quarter of all households to 1 18 percent for the wealthiest quarter. Most of the 30 percent or so of children not enrolled in primary school are members of socially disadvantaged groups and a majority are girls. Less than two percent of students at the tertiary level are from the 40 percent of households with the lowest incomes. Only 23,000 of the 129,000 tertiary level graduates are women. The benefits of public spending on education accrue unequally to students at the higher levels of education and to wealthier households. The richest 20 percent of the population receive about 40 percent of total public subsidy while the poorest 20 percent receives
less than 12 percent.
8. The quality of education is low. In recent national assessments of achievement, pupils in primary grades III and V pupils on average scored less than 50 percent in mathematics, Nepali and social studies. Less than half of the secondary students pass the School Leaving Certificate
(SLC) examination held at the end of grade 10 with only around 12 percent achieving the highest classification. Pass rates in higher secondary and at the University are similarly low.
9. High repetition and dropout rates throughout the system are wasting valuable resources.
High levels of grade repetition and drop out lead to low rates of cycle completion and high levels of cycle cost across the sector. Less than half of all children complete the primary cycle and only
10 percent of those entering grade I reach grade 10, and often after repeating several times.
About 25 percent of the students enrolled at Tribhuvan University do not attend classes and less than 25 percent of students in the arts and humanities complete a degree level without failing
once.
10. The system does not serve the labor market well. The wage labor force is still under- educated with an average of only 3.9 years of schooling, and 62 percent have no schooling at all.
Estimates of social returns (based only on monetary benefits) are below 10 percent for secondary and higher education graduates in employment, and are lower for the self employed. For primary school graduates, they are around 15 per though this is likely to be a significant overestimate for recent graduates. Compared to the social rates of return of several other low income countries, those for Nepal are probably low. To what extent this is due to low rates of economic growth
and/or to the nature of the education received is difficult to judge. The relatively low rates of return do not provide an argument to restrict the expansion of the education system. The benefits, to both the individual and to society go beyond the monetary ones. The question the set of social returns does raise, however, when compared to the private ones is the appropriate amount of public subsidy for each level.
Diagnosing the Problems
11. In an initial attempt to understand some of the reasons for the shortcomings described above, opinions were sought from various groups of stakeholders in the educational system in Nepal. Of the six most common and significant viewpoints which emerged,four directly address issues of school management, while the other two are related to the underfunding of the public system.
* The teachingforce is highly politicized. This development is commonly perceived as a major cause of the decline in the quality of public education and the low level of accountability across the system.
* District Education Officers are frequently transferred and changes in education rules and regulations are frequently made. Both of these factors are related to constant political changes and have weakened school management by creating instability and avoidance of risk-taking. District Education Officers on average spend less than one year in a district and are susceptible to transfers resulting from swings in local politics.
* Former community schools, nationalized after 1971, are now largely viewed as Government 'owned' schools over which communities have little control. Although community
participation in school management is recognized as a key ingredient for school improvement, many education managers express concern at the erosion in community support for public schools.
* The education system is lacking in professionalism and education leadership. The role of management in the education system is largely perceived as administering and maintaining
control of schools with very little leadership being offered on issues relating to learning, innovation and professional development. Career paths and incentives are poorly defined and there are few rewards for innovation at the school level or in education management.
* The educational system is encouraging social disparities. The education system that is supposed to increase equity is, in practice, resulting in large disparities between children in poor and better-off families as reflected in differences between what public and private schools can offer, and in the distribution of public subsidies.
* Free education policies have been partly counter-productive. Due to the inadequacy of public funding for schools, free education policies have inadvertently led to a decline in the quality of the education which low income children receive.
12. In addition to the views voiced in the focus group discussions, analyses were made of the specific causes of the inequities, inefficiencies and low levels of learning achievement across the education system. A wide range of constraints was identified from poverty and discrimination through to inadequate teacher preparation and time on task and a lack of materials in the
classroom. Underlying several of the constraints over which the Education authorities have some control, there appeared to be significant gaps between policy and implementation, pointing to the existence of systemic problems in the way the education system is managed and financed. Some of the most important of these were:
13. Management of the education system is highly centralized and lacks professional vision and leadership at most levels. The system lacks a holistic vision and strategies for developing accountable institutions and for developing an effective base of administrators and teachers who are critical in ensuring the efficient and equitable delivery of a quality education. While school management committees played an effective role prior to the introduction of the National Education System Plan in 1971 when all schools were brought under the control of the Government, they are no longer formed democratically and do not always represent the most immediate stakeholders.
14. Poor teacher management is a major cause ofpoor quality education. The often low quality of education is associated with the weak preparation of teachers, and the lack of support to them. Most teachers are untrained due to the absence of any provision for pre-service training and very limited in-service training, and are poorly motivated due to an inadequate set of incentives and a lack of options for career growth. As a consequence of existing recruitment practices, serious politicization of the profession and the exertion of political influences on transfers, teachers are becoming increasingly unaccountable.
15. Weak implementation of policies has created confusion and gaps in the system. For instance, the Higher Secondary Education Board which is key to the rationalization of secondary and tertiary education has been hampered by inadequate funding and a less than adequate commitment to the transition plan; the introduction of the multi-university concept has been distorted resulting in no appreciable impact on efficiency and quality; the free secondary education policy has not in practice benefited the most needy groups; and while a nationwide policy of free primary education and a policy of compulsory primary education in five districts have been announced, they do not reflect the reality on the ground
16. Public resources for education are constrained and inappropriately distributed
Government resources for education increased from less than 10 percent of the budget in the mid- 1980s to around 13 percent in 1992 but have remained around that level since. In addition, the
several inefficiencies in the system and the distribution of subsidies result in the allocations being less effective in both educational outcomes and in poverty reduction than they could be. Current expenditures on higher secondary and tertiary education have a retrogressive effect on income distribution. Nearly all of the students in higher education are from the wealthiest 20 percent of households and are enjoying the highest subsidies, while 30 percent of the school-age children, mostly from lower economic quintile and disadvantaged communities, are still out of school.
Although public expenditure on education as a share of household expenditure is higher for the poor than for the better off, in absolute terms it is lower.
17. The system offinancial allocations does not encourage efficiency or the generation of additional resources. Not only are expenditures inequitably distributed, there are examples of
inefficiency in the system of financing and in the composition of expenditures. Grants-in-aid to schools have become an entitlement for which no justification is required. Many secondary schools that receive grants have pass rates of close to zero. Very few of the available resources are used to finance quality improvement inputs and almost all are required for salaries. In the absence of inadequate public expenditure, the free secondary education policy has constrained the ability of schools to raise additional funds from the community.
Areas for Intervention
18. In the Ninth Plan 1997-2002, the report of the National Education Commission, 1998 and in other recent policy statements, a number of major changes to the education system have been proposed and there are indications that the Government is on the verge of a comprehensive effort to overcome constraints. These efforts will need to be intensified, and will require a variety of
policies and actions, as well as resources. The analyses and discussions which have occurred in the production of this report have led to the following recommendations.
* Ensure within the coming decade that all children enroll in and complete a five year primary education while developing the structures and processes for expanding a strengthened
basic cycle of schoolingfor eight years, and expanding levels of adult literacy. This would require the effective implementation of the several interventions which have been started under the Basic and Primary Education Project II, including getting children learning in grades 1 to 3, in
particular, and removing underage children from the primary schools and putting them into early childhood development programs that are community based. In addition, some increased attention needs to be given to the five million or so of the 15 - 45 years age group who have never been to school.
* Develop an integrated cycle of secondary education which is of higher quality, has greater relevance to the skills and attributes valued by the labor market and is more widely available to girls and to poorer students than is the current system. Secondary education is underdeveloped
in Nepal. The school cycle is too short, there is an over concentration on examinations and liberal arts subjects, schools and teachers are not equipped to provide a sufficiently varied and high quality education; and students (particularly girls) from poorer households do not have adequate access.
* Improve the quality of university education and tertiary education, introduce greater cost recovery and target public subsidies to students from poorer households. Efforts to remove Proficiency Level (pre university) students from the Tribhuvan University into higher secondary schools and to complete the program to strengthen degree courses need to be accelerated.
Subsidies for students of poor households need to be developed but tightly targeted. More generally, the current pattern of public expenditures which subsidizes the better-off members of
the community at the tertiary level needs to be re-structured with higher levels of cost recovery complemented by student loan schemes and targeted scholarships for poor students.
Develop a teacher management system that includes teacher education and training and conditions of service (appointment, deployment, transfer, salaries and benefits, career paths) and that will meet the needs ofprimary, lower secondary and secondary education, and improve the quality of teaching. At the core of school quality are teachers who need to be continually supported in their professional development and made accountable for student's learning. There is an urgent need for a coherent teacher training and management policy and strategy covering the entire schooling cycle. There is also a need for a national curriculum framework covering the entire school curriculum and for a more coherent examination and assessment system. The
minimum educational level for teachers is low, most have had no preservice training and upgrading programs have been limited in number and effectiveness. As a result, classroom teaching has not improved. There is a lack of transparency for appointments and transfers which
is deleterious for school quality and morale. A similar situation faces teachers in secondary schools. Ultimate success in this endeavor hinges on how serious the Government is in reducing the heavy political influences brought to bear on teachers.
* Decentralize the education system to the institution (school, campus, technical institutions) level to allow autonomy, community ownership and support, technical leadership, and
accountability. In order to move away from a highly centralized system and the practice of applying uniform policies and approaches across a diverse population and landscape, there is a
need to synchronize political and technical / administrative decentralization and to adopt differentiated forms of service delivery. As part of this effort, the capacities of central agencies as well as those in the districts need to be developed. Greater staff stability is necessary for
sustaining management reforms and there is an urgent need to develop incentive schemes tied to performance. Increasingly, however, the district will become the focal point of oversight and technical leadership and the District Education Offices will have to be reorganized to support participatory district education planning and implementation, including school improvement planning, ensuring compatibility with the local self-governance act. Local participation could be enhanced through legal provisions for school governance with empowered School Management Committees formed through democratic processes and empowered principals identified through competitive selection. Schools might then be transferred to communities, or more broadly to teacher cooperatives, NGOs or private operators under an umbrella act with provisions similar to those covering other user groups such as in community forestry.
* Improve the modalities offinancing to trigger education reform with afocus on reducing inequalities and discouraging inefficiencies while providing incentives for positive innovation and the generation of additional incentives. Changes in education financing are required to underpin the whole process of the education reforms. Financial needs are enormous across the
sector, and would be even greater at the initial stage of systemic reforms. Analysis of the
scenarios for expansion which would be implied by recent Government pronouncements suggest that they are unlikely to be financially sustainable within current financing modalities and
expenditure patterns. In order for the Nepalese education system to move to a situation which is reasonably close to that generally aspired to both quantitatively and qualitatively, the following would be required: (i) the pattern of public subsidies redirected further towards the basic level in
general, and to under-served communities and girls at all levels; (ii) cost sharing increased at post basic levels of education; (iii) an effective enabling regulatory framework established to
encourage the private provision of education with a resulting higher share of enrolments including at higher education; and (iv) an increase in the overall amount of resources spent on education as a proportion of GDP including through an increase in Government expenditures
from 13 percent to at least 15 percent, with (v) an increased share of unit costs on non-salary items. Public resources should be used first to protect the basic level of education and to target under served communities and girls at all levels so as to have a major impact on poverty reduction. In addition, they could be used to lever resources to support qualitative expansion at all levels and, more generally, to trigger the reforms. New formulas for allocating budgets across districts are being developed for primary schooling. Similar formulas will be needed for
secondary education which is generally underfunded and which requires additional community support. The next step could be block grants to institutions linked to quality improvement. This would require development of the quality indicators and a framework for classifying institutions along these lines. Again, any increases in public funds for tertiary education need to be linked to reform.
Conclusion
19. Compared to several other areas of development policy in Nepal, education has had some successes. While the system remains small compared to that in many other low income countries, its rate of growth has been impressive and two thirds of primary age children are in school. To some extent, however, the simplest part is over. The harder part will be in enticing the remaining third to enroll and remain in school to at least attain literacy, and to develop a firmer foundation for the secondary and higher education sectors which are currently in a state of flux. The education system receives the largest allocation of Government expenditure. It is doubtful that the returns are currently very high. With Government having recently announced several broad intended changes to the system, this is an opportune time to systematically consider the
implications of these in a comprehensive manner and to determine a road to reform.
INTRODUCTION
1. Over the past five decades, the educational system in Nepal has successfully concentrated on increasing access to primary schools to 65 percent of the children in the relevant age group, and on developing the foundations of secondary and tertiary education. Literacy has increased from five percent to over forty percent of the population. These achievements constitute the first phase in the educational development of the country. As the pressures to further expand the system intensify, so do concerns over its equity and the quality of the education which is provided. The responses to these pressures and concerns, many of which will need to be made over the next few years, will determine the future structure and strength of the system. Many decisions need to be taken. In some cases this will require hard choices to be made, particularly when a reallocation of financial and human resources is entailed. The objective
of this report and, equally important, of the processes which underlie it, is to help the Government in this task. The work builds upon a recent public expenditure review of the social sectors in Nepal (World Bank 2000b). The aim is to develop a framework for an equitable, efficient and affordable education system in Nepal which can play a major role in increasing economic productivity, reducing poverty and improving the overall quality of life. The report identifies a number of key constraints which currently are hindering the development of the system and, building on recent Government policy initiatives, suggests priorities and strategies for organizing and managing the required changes.
2. The process underlying this report has been in three parts. First, several analytical reviews of the separate educational levels and of cross cutting key issues facing the system were undertaken by a team of national consultants. These studies were based largely on existing information and analyses, and on Government policy documents, but augmented in several cases by interviews and fieldwork. The reviews were then combined into four separate free standing papers on management, quality, financing and tertiary/technical/vocational education. The papers provide a detailed account of the education system in Nepal only a small part of which is incorporated in this report. Second, through a consultative process, a twenty year vision of the educational system was developed. A comprehensive enrolment and financial projections model covering the educational system was then constructed and the financial feasibility of various scenarios assessed. Again, only a short summary of the results is incorporated here. Third, reactions to the analyses and to the emerging issues and alternative strategies for reform were sought from various groups of people at different stages in the process. Several focus group discussions with teachers, principals, district education officers, program coordinators, policy makers, politicians and members of student unions were organized. This report is just one result of the activities which have been undertaken to broaden and deepen the debate on education reform in Nepal. It is not the final activity. The intention is that its dissemination, in a variety of forms and gatherings, will provide a solid basis for further debate.
3. The report is divided into five chapters. The first provides a brief background of the socio-
economic context in Nepal within which the education system functions. The second chapter reviews the
level of educational attainment across the population and discusses the strengths and weaknesses of the
current system. The third chapter provides a diagnosis of these weaknesses. In this, a set of common
perceptions regarding the provision of education in Nepal is presented followed by an attempt to explain
some of the underlying reasons behind the low level of educational attainment. These first three chapters
set the stage for chapter 4 in which a set of strategies for education sector reform is articulated, starting in
each case from the general set of intentions which the Government has recently announced. The final
chapter reviews the core items of a proposed strategy for education reform.
CHAPTER 1 EDUCATION AND DEVELOPMENT Introduction
1.1 Over the past few decades, the expectations of the beneficial impact of educational expansion on various aspects of economic and social development in poor countries have grown. Education is seen to be central to the development process and to empowering people to more fully exploit their own potential and exercise more control over their own lives. Education systems, however, do not exist in a vacuum.
Their current shape reflects the interplay of many forces and circumstances and their development takes place within a variety of social, economic and cultural constraints. Positive outcomes are not automatic.
They depend on the quality of the educational process itself and on the extent to which other aspects of the society and economy are conducive to allowing the potential benefits from education to occur.
1.2 Most of this report focuses directly on Nepal's educational system and its processes. The intention is to provide a clear statement of the current status, achievements and problems of the system and to provide some guidance on the nature of the choices and decisions which will be required to improve it. In this short chapter, however, a brief account is given of part of the socioeconomic context within which the educational system is located, particularly that which relates to poverty. An argument is made in this report that the educational system is central to reducing levels of poverty and that much remains to be done, and must be done, if it is to justify both the expectations of the population and the public resources which continue to finance it. The chapter concludes with a very brief description of the education system and its development over the past half century.
Economic Growth, Poverty and Education
1.3 With a per capita income of only US$220 per annum, Nepal is the ninth poorest country in the world. Relatively low and declining rates of economic growth through the 1990s, together with high rates
of population growth have combined to reduce the growth of per capita income to the lowest in the region. Between 1995 and 1999, the increase was just 1.4 percent a year. In addition, the distribution of
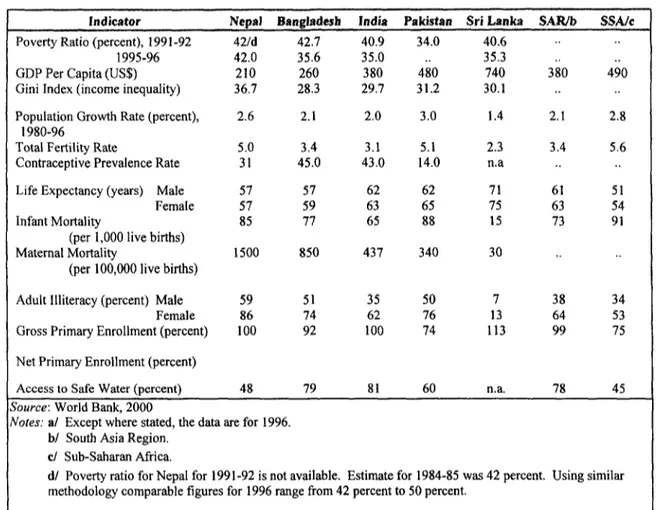
income is the most unequal in the region. A consequence of this combination of only very small improvements in per capita income and income inequality is the continuing very high level of extreme income poverty. Almost half of the population is below the poverty line and the share has hardly changed over the past thirty years, in contrast to the situation in several neighboring countries (Table 1). Hand in hand with low incomes are low levels of other indicators of development such as life expectancy, infant mortality, access to clean water and literacy. In spite of improvements in basic social and economic
infrastructure, Nepal still lags behind other South Asian countries in most areas of social and economic development; and for several the indicators are more comparable to those of poorer African countries than of her immediate neighbors.
1.4 One of the causes, as well as the consequences, of income poverty is the very small amount of
assets and capital held by most households. This includes human capital which is increased largely
through education and training. The evidence in Nepal, as elsewhere, is that men and women who have
received education alter their behaviors in ways which improve their quality of life. The level of
education of a household head is strongly associated with that household's chances of falling below the
poverty line (Prennushi, 1999). Using the Central Bureau of Statistics' definition of poverty (an annual
income of NRs. 4404 per person in 1996), and data from the Nepal Living Standard Survey (NLSS, 1996)
Table 1: Social Indicators in the South Asia Region/a
Indicator Nepal Bangladesh India Pakistan Sri Lanka SAR/b SSAic Poverty Ratio (percent), 1991-92 42/d 42.7 40.9 34.0 40.6
1995-96 42.0 35.6 35.0 .. 35.3
GDP Per Capita (US$) 210 260 380 480 740 380 490
Gini Index (income inequality) 36.7 28.3 29.7 31.2 30.1
Population Growth Rate (percent), 2.6 2.1 2.0 3.0 1.4 2.1 2.8
1980-96
Total Fertility Rate 5.0 3.4 3.1 5.1 2.3 3.4 5.6
Contraceptive Prevalence Rate 31 45.0 43.0 14.0 n.a
Life Expectancy (years) Male 57 57 62 62 71 61 51
Female 57 59 63 65 75 63 54
Infant Mortality 85 77 65 88 15 73 91
(per 1,000 live births)
Maternal Mortality 1500 850 437 340 30
(per 100,000 live births)
Adult Illiteracy (percent) Male 59 51 35 50 7 38 34
Female 86 74 62 76 13 64 53
Gross Primary Enrollment (percent) 100 92 100 74 113 99 75
Net Primary Enrollment (percent)
Access to Safe Water (percent) 48 79 81 60 n.a. 78 45
Source: World Bank, 2000
Notes: a/ Except where stated, the data are for 1996.
bi South Asia Region.
c/ Sub-Saharan Africa.
d/ Poverty ratio for Nepal for 1991-92 is not available. Estimate for 1984-85 was 42 percent. Using similar methodology comparable figures for 1996 range from 42 percent to 50 percent.
to measure per capita annual consumption, 54 percent of households with uneducated heads are "poor".
Incidence decreases to 34 percent for those households whose heads have completed primary education.
Completion of secondary and university level education by a household member further reduces the incidence to 16 percent and 8 percent respectively. These data confirm the wide belief that education increases employment opportunities and productivity, and helps to raise incomes. Most importantly, for those born poor, it enhances the possibility of escaping poverty.
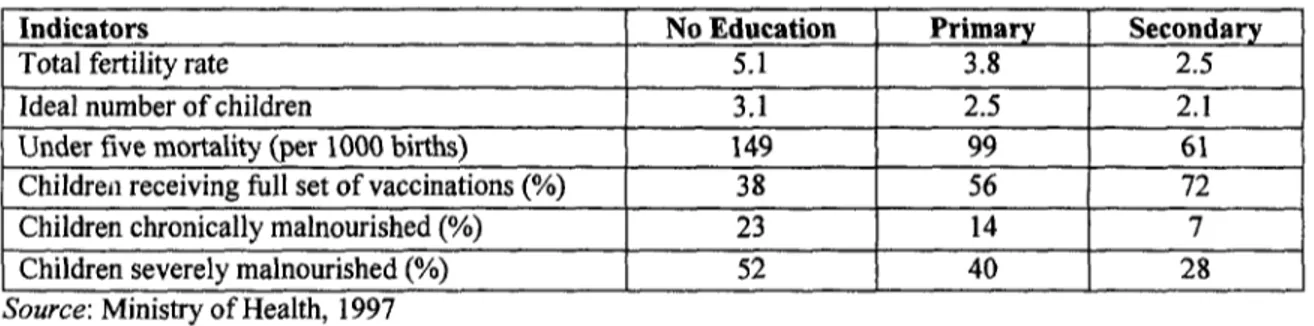
1.5 Poverty is not simply a reflection of low levels of income but also encompasses the lack of an individual's ability to make choices which affect her or his life. One set of choices covers reproductive health, family health and nutritional status. Education is strongly associated with these and other
demographic and health indicators as shown in Table 2. Reductions in both the fertility rate and the ideal
number of children for those women with a primary schooling compared to those with no schooling are
pronounced (from 5.1 to 3.8 and from 3.1 to 2.5 respectively), as is the reduction in the mortality rate of
their children (from 149 to 99 per 1000 live births).
Table 2: Quality of Life Indicators by Level of Women's Education
Indicators No Education Primary Secondary
Total fertility rate 5.1 3.8 2.5
Ideal number of children 3.1 2.5 2.1
Under five mortality (per 1000 births) 149 99 61
Children receiving full set of vaccinations (%) 38 56 72
Children chronically malnourished (%) 23 14 7
Children severely malnourished (%/o) 52 40 28
Source: Ministry of Health, 1997
1.6 Seventy-five percent of children whose mothers have no schooling are severely or chronically malnourished compared to 54 percent of children whose mothers have had a primary schooling. A full set of vaccinations among the latter group of children is also much more frequent. The effects of primary schooling on these measures are strong. They are equally strong for a secondary schooling and it is evident from the data that this level is required for the full and sustained change in behavior to occur.
Other social indicators, including child labor and aspects of gender discrimination and women's empowerment, are also correlated with levels of literacy as the inter-district analyses undertaken by ICIMOD (1997) and described in table 3 demonstrate.
Table 3: Correlation Coefficient of District Level Social Indicators with the Overall Literacy Rate (OLR) of Districts
Social Indicators Correlation with OLR
Child labor rate -0.90
Child illiteracy rate -0.96
Child marriage rate -0.37
Gender imbalance ratio among the literate adult population 0.86 Gender imbalance ratio among the non-agricultural occupations 0.56
Percentage of share of females in literacy programs 0.87
Percentage share of females in non-agricultural occupations 0.67
Percentage share of females in primary level teaching 0.67
Percentage share of girls' enrollment at primary level 0.85
Infant mortality rate -0.53
Contraceptive prevalence rate 0.73
Source: Adapted from ICIMOD, 1997.
1.7. Overall, an effective poverty reduction strategy must give high priority to programs and policies which both raise the productivity of the labor force and improve the quality of life of the whole
population and especially that of women. Education programs and policies have a central role in achieving these objectives.
Education Provision - A Snapshot
1.8 The education system in Nepal is one of the youngest in the world. In 1951, only 9,000 pupils were enrolled in primary schools and only 1,700 in secondary schools. Consequently, the development of the system has been uneven and in several ways the system needs to be seen as embryonic.
1.9 Expansion of enrollments has been a major accomplishment in Nepal over the past three decades, in particular. In absolute figures, primary school enrolments (grades 1-5) grew significantly, from around 400,000 in 1971 to almost 3,500,000 in 1997 covering 65 - 70 percent of the appropriate age group, plus many over and underage children. Over the same period, enrolments in lower secondary (grades 6-8) and secondary (grades 9-10) schools combined increased from 120,000 to 1,190,000 resulting in gross
enrolment ratios of 54 percent and 31 percent respectively. At the post-secondary level, including tertiary education, enrolments increased from 17,000 to 195,000 over the same period resulting in a current enrolment ratio of around four percent. During the period 1951 to 1971, enrolment growth at each level averaged over 20 percent a year, though from a low base in each case. In the following decade the highest annual rate of expansion was at the primary level (13.0 percent), while during the 1980s tertiary education expanded most rapidly (11.7 percent) and was again the fastest growing sector in the 1990s (10.5 percent). The structure of the education system is depicted in annex 1 and an expanded description
is provided in World Bank (2000b).
1.10 The picture of recent enrolment trends which emerges is of a primary level whose rate of growth is slowing down markedly, a secondary level where growth is strong and the absolute increases are large and a tertiary level with a very high growth rate, though where the absolute numbers remain relatively small. This picture is of enrolments and enrolment growth only. The meaning behind these in terms of inputs, processes, outputs and distributions is examined in the rest of the report.
The Importance of Education
l.11 The expansion and improvement of education cannot solve all of the problems of development but they can play an important role. Education helps individuals to expand their knowledge of
opportunities and options, and in general to navigate across society more effectively. In helping to
change behaviors which have an impact on the quality of life within the household, such as through better
health and nutritional practices, and which reduce rates of fertility, the impact of education in Nepal as
elsewhere is very strong. The effects are likely to increase as coverage of both primary and secondary
schooling further widens and behavioral changes deepen. Potentially, the educational system can also
have a significant impact on reducing levels of poverty and increasing levels of economic growth. To
households with no or veryfew assets, increasing the human capital of its members is perhaps the most
effective long term route out ofpoverty which is available. However, this process does not result simply
from sitting in a school. It requires an effective learning environment.
CHAPTER 2 EDUCATIONAL OUTCOMES
2.1 As described in the previous chapter, the education system in Nepal is one of the youngest in the world and operates within a political democracy that was established only in 1991. Not surprisingly, while parts of the system have been well designed and are implemented effectively, others remain in an embryonic stage and are only partly effective. Over the past several decades, there have been
considerable quantitative achievements in terms of schools, teachers and students at all levels of the system. More recently, increased attention has been given by Government to developing new curriculum, distributing free textbooks and providing teacher training as well as attempting to reach out to
communities which are particularly educationally disadvantaged. In spite of these successes, however, while enrolments at all levels of the system have improved dramatically, there is a general acceptance that access to primary education is still far from universal and that the quality of education received by the majority of students is unacceptably low. Both the low rates of primary school completion and the dramatic increase in enrolments in the private educational institutions over the past decade indicate that the outcomes of the public education system need to improve significantly. In this chapter, the
information currently available on outcomes in terms of the overall level of educational attainment, access across various groups of the population, the quality of education, completion rates of the various cycles of education, and the way in which the labor market judges the graduates of schools and universities is presented. In some cases, such as labor market outcomes, the information is limited. Overall, however, sufficient is available to adequately convey the situation.
A Review of Outcomes
2.2 The analyses of the various levels of the education system (primary, secondary, vocational and technical, tertiary), and of its management and financing, which were prepared as background for this report, provide a set of information which can be used to begin to assess the outcomes of the system.
2.3 Levels of literacy and educational attainment remain low. Of the population aged fifteen years and over in 1995, 81 percent of females and 46 percent of males were illiterate. Only one in every three adults was literate. These figures, taken from the Nepal Living Standards Survey (NLSS) and described more fully in Prennushi (1999), reflect the underdevelopment of the educational system in previous decades. Large numbers of unschooled men and women will populate the labor force and be of parenting age for many years to come. Given the net enrollment rates of roughly 67 percent for boys and 46 percent for girls aged 6-10 years, the average levels of attainment across the population will increase, though slowly.
2.4 Literacy rates vary by geographical/ecological area. In the mountains, less than one in four persons is literate, including less than one in ten women. In the Terai, 47 percent of men and 17 percent of women are literate. Literacy rates also vary by income (consumption) group. Of the poorest two thirds of the population, 43 percent of males and less than 11 percent of females are literate
2.5 The National Labor Force Survey (NLFS) for 1998 provides information on the educational background of the wage labor force. Almost 43 percent are literate and 38 percent have completed at
least a primary schooling. Seven percent have some formal training. Educational attainment varies
widely across gender, and sector and location of employment. Twice as many males as females have at
least a primary schooling (43 percent and 21 percent). Even more pronounced is the difference between
sectors. Over 55 percent of the wage-workers in the non-agricultural sector have at least a primary
schooling compared to only eight percent in the agricultural sector. Only one third of urban workers has
less than primary schooling; compared to over two thirds of rural workers.
2.6 The low level of adult literacy, particularly of females and disadvantaged groups is not only important in itself, but also is a factor behind the continuing low level of participation in the education system of girls and of children from disadvantaged backgrounds in particular. While nearly four million adults attended literacy classes in the 1990s, the literacy rates for the age groups over forty years have improved only marginally. Achievement remains much below the targets set in several Plans.
2.7 Overall, across the adult population, including the wage labor force, the spread of education is very low, and for rural women in particular, exceedingly low. In recent years, analyses of the relationship between education and socio-economic development have pointed to the importance of a wide spread of
education if the potential benefits are to be maximized. For instance, while the farmer with some schooling has been shown to be more productive than the unschooled farmer, his level of productivity is even higher if most of the farmers in the community have had a primary schooling. However, in neither the Terai nor the Mountain belt does the male literacy rate reach 50 percent. Similarly, while the average primary schooled woman has lower levels of fertility and healthier children than the unschooled woman, the differences tend to be significantly greater if most of the women in the locality have that level of education. Again, in none of Nepal's five regions is the female literacy rate above 25 percent. Put simply, there appears to be a threshold of the spread of schooling beyond which the benefits accelerate and in most localities in Nepal that level has not been reached. Given that average levels of agricultural
productivity are low, that population growth in Nepal is the second highest in the region and is probably depressing per capita income growth and that levels of child malnutrition are extremely high resulting in both physical illnesses and reduced cognitive development in the future, the payoff from raising the share of young men and women who have received schooling to a level which promotes these stronger
responses would seem to be of highest priority.
2.8 While access to all levels of the education system has increased considerably, participation is unequal across income and social groups and the benefits ofpublic subsidies are inequitably distributed.
The primary school gross enrolment ratio (GER) is officially recorded as 124 percent and the net enrolment ratio (NER) as 70 percent for 1998. Within the region, the coverage of primary schooling compares favorably with Pakistan but unfavorably with Sri Lanka, India and Bangladesh The Nepal Family Health Survey for 1996 estimated that 74 percent of boys and 57 percent of girls aged 6-10 years were in school, leaving slightly more than one million children in this age group out of school (Ministry of Health, 1997). The Nepal Living Standard Survey, again for 1996, provides lower estimates.
According to the Survey, the overall gross primary enrolment ratio was 94 percent and the net ratio 57 percent, with 67 percent of school-age boys and 46 percent of girls attending school. Forty percent of the students are girls, up from 30 percent a decade ago though in the Far Western region the enrolment rate for boys is twice that for girls. There are also significant geographical variations in coverage with the range between regions being from 64 percent in the Eastern Terai to 104 percent in the Eastern
hills/mountains. Finally, primary education coverage varies by level of household income/consumption.
The GER for the poorest fifth of all households is 68 percent compared to 118 percent for the wealthiest fifth.
2.9 For lower secondary schooling the GER is 54 percent overall and 44 percent for females. Rural -
urban differentiation is even wider than for primary grades with rates of 48 percent and 84 percent
respectively. The range across regions is between 30 percent in the central hills and mountains and 73
percent in the Eastern hills and mountains. The differences across households by level of consumption
are very striking. The GER for the poorest fifth of households is 22 percent compared to 90 percent for
the wealthiest fifth. The variations are even wider for secondary education. For instance, while the GER
for children in the poorest fifth of households is only 8 percent it remains at around 90 percent for the
wealthiest group. In higher education (grade 11 and above), only 22 percent of the students are female
and, incredibly, less than hal f of one percent of all students are from the poorest fifth of households and
only 6 percent from the poorest half.
2.10 Since education at each level is highly subsidized by the Government, the large inequalities in access result in the benefits of public spending on education accruing unequally across household income groups. For every 100 Nepalese Rupees spent by Government on primary education, roughly 20 go to households within each income quintile. However, for each higher level of education the gap in participation rates and hence in the benefits from public spending across income groups widens. Only five percent of those enrolled in secondary level education are from the poorest quintile, 16 percent are from middle quintile, and 44 percent are from the richest quintile. At the university level, only 0.4 percent of students come from the poorest fifth of all households, and almost 81 percent from the
wealthiest fifth. Overall, the wealthiest 20 percent of the population receive about 40 percent of the total public subsidy on education while the poorest quintile receives less than 12 percent.
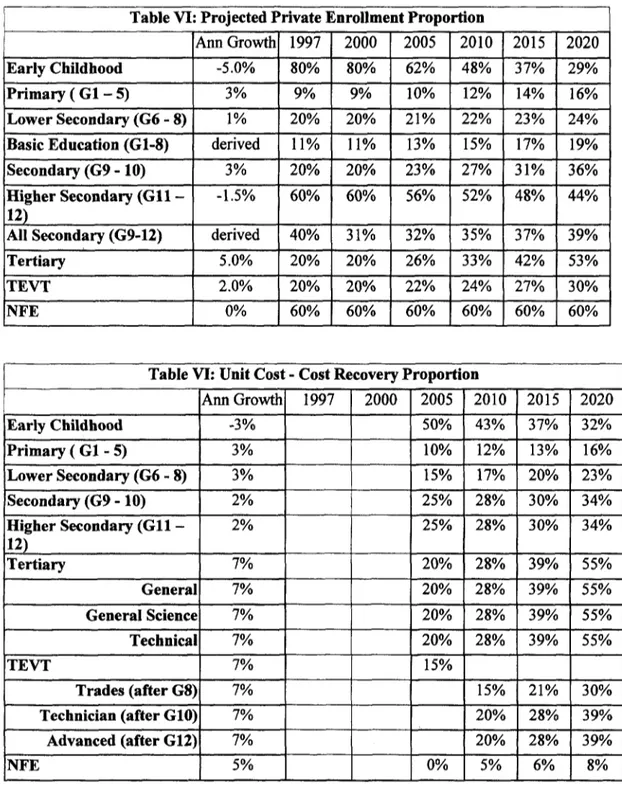
2.11 Another source of inequality is the growth of private schooling resulting in a different educational experience for the children of those who can afford to pay fees and those who cannot. Although the proportion of private enrollment at the primary level is still less than 10 percent this will double in the next five years if current growth rates continue (see annex I for a comparison of the characteristics of public and private schools in the Kathmandu Valley). One third of the total increase in enrolments in recent years has been in private schools. The proportion of enrollments in private lower secondary and
secondary schooling is 20 percent while it is over 50 percent in higher secondary education, over 20 percent in tertiary education and over 30 percent in technical and vocational education. The expansion of
private education is a recent phenomenon with a high proportion of national and district education officials and urban public school teachers participating. There is a concern that this trend will erode the
pressure to improve the quality of public education as many of those who are managing the school system have little direct stake in it. In addition, the highly subsidized places in higher education are being monopolized by graduates of the private schools.
2.12 Quality of education is low. A modern society needs an education system that provides its students with a sound basis for lifelong continuing education. Schools need to begin the process by establishing applied mathematical and problem solving behaviors, scientific and technological methods of inquiry, communication skills, the need for democratic institutions, reasoned debate and consensus building, and an appreciation of the richness of their own cultural heritage and that of others. Nepal's public schools do not do these things well: teachers are often not sufficiently well educated or trained to implement such programs and schools tend to be poorly equipped.
2.13 Learning outcomes of the school system are low overall and there are marked differences in the performance of students across geographical locations and also from public and private institutions. A national assessment of students in grade 3 in 1997 showed that in tests of mathematics, Nepali language and social studies, students were on average able to answer correctly less than half the questions (44, 46 and 50 percent respectively). The assessment of students in Grade 5 in 1999, provided even lower average scores (27, 51 and 42 percent respectively). Students in the Hills did better in each subject than students in the Terai and the Mountains in grade 3. Terai students did particularly poorly in both Nepali and Social Studies. Scores in the Kathmandu Valley were considerably higher than those in the rest of the country. Overall, girls performed similarly to boys in grade 5 in Nepali and Social Studies but
considerably worse in Mathematics. A small study carried out in the private and public schools in the Kathmandu Valley showed higher scores in private schools in mathematics (42 and 36 percent) and in Nepali (69 and 63 percent), though they were similar in Social Studies.
2.14 There are no standardized tests of learning achievement for secondary school students. However, the average pass rate for the School Leaving Certificate (SLC) at grade 10 has ranged between only 25 and 35 percent over the past decade. This average hides wide differences between public and private schools. In 1998 the pass rates increased to 48 percent and 84 percent for public and private schools
respectively. It should be noted, however, that in the Kathmandu Valley, where most of the secondary schools are located, the differences in pass rates between rural and urban schools are greater than those between public and private schools. Twice as many boys as girls appear in the examinations, and their average performance is higher with pass rates of 52 and 44 percent respectively in 1998. High failure and repetition rates in the SLC examinations, and a low percentage of students passing in the First Division
suggests that the quality of secondary education is relatively low.
2.15 For higher education (defined in Nepal as grade 11 and above), the story is similar. Pass rates in the two year proficiency level examinations at the University are very low as are those conducted by the Higher Secondary Education Board for students in higher secondary schools. There is, however, some sign of improvement in the latter with rates increasing dramatically from 24 percent in 1998 to 39 percent
in 1999. In the University degree programs, pass rates vary by subject but are particularly low in the Humanities, Management and Education where most of the students are enrolled. Students enrolled in technical disciplines perform much better, but these are also the best students coming out of the school
system. However, enrollments in technical disciplines are less than 5 percent of the total.
2.16 High repetition and dropout rates throughout the system are wasting valuable resources. Out of 1 00 children enrolling in Grade I, only around 18 complete the cycle five years later and less than 50 complete eventually. Two thirds of those who complete will have repeated at least one grade. On average, those who graduate take two years more than the prescribed time.
2.17 While dropout rates are lower in secondary education, repetition rates are again very high, and only 40 percent and 50 percent of those who complete the lower secondary and secondary cycles respectively do so without repeating at least one grade. Around 30 percent of grade I entrants complete
lower secondary and 10 percent complete grade 10. The situation is similar at the university level, but there the cost implications are much higher. Surveys indicate that about 25 percent of the students at Tribhuvan University system regularly do not attend classes. Only 25 percent of students in non technical subjects complete without repeating at least one year of study. In technical subjects the proportion is 35 percent.
2.18 High repetition and dropout rates have a number of consequences. Repetition leads to higher class sizes, which in the first two grades of primary schooling can often be over 70 pupils, with a resulting reduction in the amount of time a teacher spends with each child. Having children of different ages and with different educational experiences in a class makes it harder to teach, particularly for inexperienced and untrained teachers. It is also possible that these large class sizes act as a disincentive for parents to send their young children to school or encourage the communities to develop additional schools for which they then put pressure on Government to provide teachers. High levels of repetition can be used to justify additional teachers in existing schools. Individual school cycles are designed to cover an integrated curriculum. For children who drop out within a cycle, much of the potential benefit of schooling which has been received is lost. This is most apparent in primary school where children who drop out before completing are unlikely to be literate and gain no permanent benefit. In secondary and higher education, some of the benefits from attending at least part of the cycle are likely to remain, but again they will be less than for those who do not drop out.
2.19 The system does not serve the labor market well. Education is valued both by individuals and governments for the ways in which it equips people to cope with the world more effectively. This has many aspects including an increase in self esteem, an improved ability to deal more effectively with those who have power and, in general, the possibility of increasing capabilities which broaden the areas of individual choice. In addition, for many, an important motivation for acquiring education is to increase the chances of being more economically productive, and consequently of enjoying a higher income/level of consumption. Both individuals and governments have a stake in this and both are involved in meeting
the costs. Whether parents are prepared to send their children to school and use the educational facilities which are available, and to demand them when they are not, at least partly depends on the anticipated economic benefits. While it is virtually impossible to forecast these over a lifetime, it is possible to
present briefly some recent evidence of the current and past relationship in Nepal between education and the economic returns.
2.20 While only 15 percent of the labor force is in the wage sector, private rates of return for workers in this sector provide some evidence of part of the complex set of motivations for individuals to demand education. According to data from the 1998 Labor Force Survey, for those able to find wage employment the overall returns are relatively high at the primary schooling (16.5 percent) and university education (12 percent). For secondary school graduates the returns. are around 8.5 percent. Females have higher returns than males for both primary and secondary schooling, but lower returns for university education. In rural areas, the highest return is for primary schooling while in urban areas the highest is for university
education. Formal vocational training yielded much higher returns in rural areas (18 percent) than in urban settings. Similar calculations were also made for the self employed. For these workers, rates of return are much lower. For non agricultural activities, they range between 11 percent for primary to 4 percent for university. In agriculture, they are even lower, ranging from seven percent for primary to zero for university.
2.21 What can be implied from these results? Overall the private returns for all wage earners range between 8.5 percent for secondary graduates and 16.5 percent for primary graduates. However, they are probably lower for recent graduates, particularly for primary school graduates who are unlikely to be able to find wage employment at all, and they are much lower for the self employed. Given the high transition rates characteristic of the whole system, the continued demand for secondary education may reflect individuals' perception of this level of education mainly as a stepping stone to university. The returns to university education for employees are reasonably high, particularly for males, and given the probable overestimate of the returns to primary schooling could be the highest across levels. This suggests that there is scope for reducing the public subsidy to this level of education without reducing the demand substantially.
2.22 Estimates of social rates of return (based only on monetary benefits) need to take account of the public subsidies to schooling, which are substantial at all levels but particularly for higher education. The resulting rates of returns are below 10 percent for secondary and higher education graduates in
employment, and lower for the self employed. For primary, they are around 15 per cent, though again this is likely to be a significant overestimate for recent graduates. Compared to the social rates of return calculated across a wide range of countries, those for Nepal are probably low. To what extent this is due to low rates of economic growth and/or to the nature of the education received is difficult to judge. The relatively low rates of return do not provide an overriding argument to restrict the expansion of the education system. The benefits to both the individual and to society go beyond the monetary ones. For instance, there is compelling evidence from both the Family Health Survey and the Living Standards Survey to suggest that primary and secondary education of females, in particular, is strongly associated with positive changes in social behavior. The question the set of returns does raise, however, is the appropriate amount of public subsidy for each level of education, and particularly for higher education.