Policy Research Working Paper 6931
Does Involvement of Local NGOs Enhance Public Service Delivery?
Cautionary Evidence from a Malaria-Prevention Evaluation in India
Ashis Das Jed Friedman Eeshani Kandpal
The World Bank
Development Research Group
Trade and International Integration Team
WPS6931
Public Disclosure Authorized Public Disclosure Authorized Public Disclosure Authorized Public Disclosure Authorized
Abstract
The Policy Research Working Paper Series disseminates the findings of work in progress to encourage the exchange of ideas about development issues. An objective of the series is to get the findings out quickly, even if the presentations are less than fully polished. The papers carry the names of the authors and should be cited accordingly. The findings, interpretations, and conclusions expressed in this paper are entirely those of the authors. They do not necessarily represent the views of the International Bank for Reconstruction and Development/World Bank and its affiliated organizations, or those of the Executive Directors of the World Bank or the governments they represent.
Policy Research Working Paper 6931
Using data from an experimental supportive intervention to India's malaria control program, this paper studies the impact of leveraging local non-state capacity to promote mosquito net usage and recommended fever care-seeking patterns. The supportive activities were conducted simultaneously by three nongovernmental organizations in two endemic districts in the state of Orissa. The study finds that program impact varied significantly by location. Examining three potential sources of this variation (differential population characteristics,
This paper is a product of the Trade and International Integration Team, Development Research Group. It is part of a larger effort by the World Bank to provide open access to its research and make a contribution to development policy discussions around the world. Policy Research Working Papers are also posted on the Web at http://econ.worldbank.org.
The authors may be contacted at ekandpal@worldbank.org.
differential health worker characteristics, and differential
implementer characteristics), the analysis provides
evidence that both population and nongovernmental
organization characteristics significantly affected the
success of the program. The paper discusses these findings
as they relate to the external validity of development
policy evaluations and, specifically, for the ability of the
health system to benefit from limited non-state capacity
in under-resourced areas.
Does Involvement of Local NGOs Enhance Public Service Delivery? Cautionary Evidence from a Malaria-Prevention Evaluation in India
Ashis Das, Jed Friedman, and Eeshani Kandpal
1.
JEL Classification: I15, I18
Key Words: Malaria, external validity, regression decomposition
Acknowledgments: This study was conceived, implemented, and evaluated in collaboration with the NVBDCP and DoHFW, Government of Odisha, who also provided necessary approval. Ethical approval was obtained from an independent ethical committee in Bhubaneswar, India that follows guidelines issued by the Indian Council of Medical Research. The authors also thank Michael Woolcock, Gandham NV Ramana, Ramesh Govindaraj, Srikantia Sridhar, and Sean Dalby for their help and guidance. Support from the Strategic Impact Evaluation Trust Fund and the Knowledge for Change for Program, both administered by the World Bank, is gratefully acknowledged.
1
All authors are with The Development Research Group, The World Bank.
Corresponding author contact information: ekandpal@worldbank.org.
1 Introduction
In an effort to improve public service delivery in resource scarce settings, governments and devel- opment agencies may seek to involve existing local non-state capacity in program implementation.
However the development literature has a limited understanding of the challenges of doing so, and many questions remain about when, where, and how to implement such a policy. This paper lever- ages a recent experimental evaluation of a supportive intervention to India’s malaria control program to examine whether involving local non-state capacity significantly influences the individual health outcomes targeted by the intervention.
1We find that using local NGOs in program implementation can indeed lead to positive outcomes, although success likely depends on the quality of the local implementing agency. Hence, in low-resource areas with few high quality local institutions, there may be little alternative to intensified state investment or state-led incentives if the goal is improved public services.
The malaria-control intervention was conducted simultaneously by three NGOs in two endemic districts in the state of Orissa. The effect of NGO involvement on mosquito net usage and fever care-seeking patterns– the main targeted outcomes of interest– varies significantly by the district of implementation. Utilizing simple regression decomposition or propensity weighting, we examine three potential causes for such different outcomes: (1) differential population characteristics across the two districts, (2) differential health worker characteristics, and (3) differential implementer characteristics. We find that differences in observed outcomes can mostly be ascribed to the first and third factors, as well as their possible interaction. Not only do our results raise concerns about the efficacy of local non-state capacity utilization to enhance health sector performance, they also highlight questions of the generalizable policy relevance of small-scale experimental evaluations implemented by non-state actors.
The literature on involving local non-governmental capacity in public service delivery usually highlights the potential gains from non-state provision of basic services. Berman [1998], noting the low quality of government-provided care and the financial burden of unregulated fee-for-service
1See Das et al. [2014] for a comprehensive summary and evaluation of this program.
medicine, recommends involving the extensive network of domestic NGOs to enhance the quality and scope of basic services provided while simultaneously curtailing implementation costs. When discussing the financing of preventive health care services that require subsidies to be produced or demanded at optimal levels, Bishai et al. [2008] suggest that governments may subsidize network providers by financing non-state actors to act as intermediate agents. In addition to expanding the reach of basic services, leveraging adequate local capacity can also improve the outcomes of social interventions by targeting them to areas with well-organized non-state actors [Maluccio, 2010, de Renzio, 2005]. The Nicaraguan CCT program, Red de Protecc´ıon, targets areas with significant local institutional capacity. As Rawlings and Rubio [2005] point out, CCTs must often take into account local supply capacity constraints in deciding which areas or populations to target; hence, incorporating local private capacity might increase the reach of such programs.
There are also possible pitfalls from such state-non-state collaboration. Batley [2006] finds that non-state provision of basic services can often be hindered by unsupportive, mistrustful relationships between governments and their non-state counterparts. However, if successful, such partnerships can lead to improved service standards, particularly when large NGOs support smaller local ac- tors. Awortwi and Helmsing [2007] study the decentralization of the provision of basic services in Sub-Saharan Africa from central governments to non-state actors. They find that the coverage of primary education, primary health care, sanitation, and drinking water improved from this decen- tralization, although the quality of services continued to vary and geographic inequalities persisted.
What might distinguish a successful government-NGO collaboration from a troubled one? The
International Finance Corporation [2011] recently completed a detailed comparative study on the
systematic collaborations between African governments and the private health sector. Evidence
points to particularly successful collaborations on disease control and immunization programs. The
report finds significantly greater collaboration with NGOs that are better organized and have been
established for a long period of time and also highlights the importance of a policy of engagement
and information exchange between the government and the private sector. Finally, the report notes
that the government’s ability to regulate the private health sector depends on adequate enforcement
capacity and consistent oversight.
For local non-state capacity to effectively utilize public resources, implementation capacity and the overall quality of such non-state actors must either pre-date government involvement or be developed through concerted efforts. Where such capacity is lacking, the prospect of collaboration is restricted. Bloom et al. [2005] report the results of an NGO-contracted health care scheme in eight districts of Cambodia but note that three districts had to drop from the study due to a lack of local NGOs of sufficient quality. Hammer and Spears [2009] also highlight the implementation constraints of relying on local capacity. They study a unique experiment where the government had, in agreement with external donors, intended to implement a village-level NGO-led sanitation program in three districts of Maharashtra. Ultimately, as a result of capacity constraints, the program was only implemented in one district. In short, implementation capacity of governments is a key determinant of government program performance [Pritchett et al., 2013]; clearly it should be a determinant of NGO program performance as well.
Not only do our results highlight potential limitations with non-state involvement in public service delivery, they also question the generalizability of empirical findings from small-scale policy evaluations (RCT or other), thus following Rodrik [2008], Deaton [2010], Pritchett and Sandefur [2013] and others. Variations in the quality of local institutions can dramatically affect the results of a small-scale trial [Woolcock, 2013]. Indeed, as Bold et al. [2012] demonstrate, whether a program is implemented by government agencies or NGOs significantly affects its success. The authors study a Kenyan contract teacher intervention to find a significant, positive effect on students’
math and English scores in schools randomly assigned to NGO implementation, but no effect in
schools assigned to government intervention. Further, Allcott and Mullainathan [2012] examine
an energy conservation experiment run by a power company in different cities across the U.S
and find economically and statistically significant variations in the site-specific treatment effect,
despite controlling for several important mediators. Allcott [2014] extends this analysis to present
evidence of site-selective bias in the selection of early chosen sites for evaluation. Our paper joins
this literature in highlighting external validity concerns of localized evaluations as well as calling
for improved standardized measures of implementation capability. As our results show, different
implementing agencies (even if all non-governmental organizations) perform at varying levels; any
policy conclusion based on such an evaluation design need consider heterogeneous implementer effects.
2 Intervention Description
Malaria causes 11 percent of all rural deaths in India, with over a million cases of malaria di- agnosed annually. Longer term consequences of malaria infection at young ages has also been found to be severe [Venkataramani, 2012, Hong, 2013]. The east-central states of Orissa (where our study is based), Chhattisgarh, Madhya Pradesh, Jharkhand and West Bengal alone account for 60 percent of all Indian malaria cases [World Health Organization, 2009], with a high incidence of the chloroquine-resistant malaria. Previous government efforts to reduce disease transmission through increased bed net usage or improved care-seeking behavior have thus far seen limited suc- cess [Sharma et al., 2011]. Under the rollout of the new National Vector Borne Disease Control Programme (NVBDCP) in 2009, the government has renewed focus on (1) the mass distribution of long-lasting insecticide treated nets (LLINs) and (2) the use of Rapid Diagnostic Tests (RDT) and Artemisinin-based Antimalarial Combination Therapy (ACT) for Plasmodium falciparum (Pf) malaria. The new program also attempts to shift fever case management from hospitals and health centers to community health workers known as Accredited Social Health Activists (ASHA) who, in principle, can deliver correct diagnosis and treatment in a more prompt manner, thereby decreasing malaria related morbidity and mortality.
ASHA workers have been trained in RDT use and ACT dispensation in at least 50 endemic
districts, including all villages in our study area. The complementary, NGO-led, intervention studied
here was designed to strengthen the NVBDCP further via supportive supervision of ASHA and
community mobilization focusing on appropriate malaria-related behavior, such as consistent bed
net use and timely care-seeking from a trained provider for febrile illnesses. Although ASHA tend
to have limited schooling or training, evidence suggests that regular and systematic supervision
with clearly defined objectives can be a cost-effective way of improving the performance of primary
health care volunteers [Das et al., 2008]. In this paper, we investigate an intervention that was
implemented by contracted local NGOs and aimed to provide supportive supervision as well as generate demand through community mobilization.
2.1 Study area, design and participants
This study tests two models of program support: combined supportive supervision of ASHAs and community mobilization in what we term treatment arm A; and community mobilization alone in treatment arm B. The control arm (referred to as arm K) received the routine activities of the government’s malaria control program, i.e. fever case management by ASHAs without any additional supervision or community mobilization. All study villages are in four sub-districts of Sundargarh and Mayurbhanj districts, both of which are on the national list of 50 highly malaria endemic districts identified by the Indian government.
2The two districts also have significant scheduled tribe (indigenous) populations as well as populations living in hilly and forested areas.
The four sub-districts together comprise the highest endemicity sub-districts (as identified from health administrative data) within the study area.
A total of 120 endemic villages, with an average population of approximately 900, were randomly assigned with equal probability to one of the two treatment arms or the control (randomization was stratified by sub-district). Each village had one ASHA, who had been previously recruited by the government. The intervention was divided into two phases: a planning phase from September to December 2009, that included formative research, recruitment and training of project staff; and an implementation phase from January to December 2010.
Extensive consultation with local health officials and community leaders identified no more than three NGOs that fulfilled the stipulated criteria of (a) previous experience in malaria-related activities and (b) previous activity in the selected sub-districts. These three local NGOs were approached for further screening and ultimately chosen for study implementation. The two sub- districts in Sundargarh district were each assigned to a separate local NGO (hereafter denoted as NGO-S1 and NGO-S2) while the sole NGO in Mayurbhanj was of sufficient size to operate
2The National Vector Borne Disease Control Programme defines an area with an Annual Parasite Incidence–
confirmed malaria cases in a thousand population– over five as endemic.
in both selected sub-districts (this NGO will be denoted as NGO-M). Community-level meetings and participatory social mapping exercises introduced the interventions in treatment villages and allowed project staff to familiarize themselves with the community.
Under supportive supervision, the NGOs provided intensive supervision and support to ASHA workers through visits, at least twice monthly, by an accredited NGO worker. Each NGO worker was responsible for 10 ASHA. A supportive visit included some combination of the following activities:
(1) review of relevant malaria treatment protocols and retraining when necessary, (2) supervision of follow-up visits by ASHA to at least two households with recent cases of fever in order to inquire about health status, satisfaction with care, and to encourage proper preventive behavior, (3) review and discussion of ASHA record-keeping since the last supervisory visit, and (4) facilitation of communication between the ASHA and the broader health system with a focus on RDT and ACT supply chain management.
In the community mobilization component, NGOs were assisted by village health and sanitation committees (VHSC) and women’s self-help groups (SHG) to promote appropriate malaria preven- tative and care-seeking behavior. Door-to-door visits by the NGO and SHG members attempted to motivate the consistent use of bed nets and timely care seeking from the ASHA for fever. Each SHG member was encouraged to monitor nighttime bed net usage in 10 to 15 households, thus achieving approximately comprehensive coverage. Information campaigns through local media and street plays also delivered the following messages: (1) whenever you have fever, visit the ASHA as soon as possible; (2) have your blood tested and take medication from the ASHA if you test positive for malaria; (3) always consume the full course of medication given to you by the ASHA;
(4) use bed nets every night; and (5) prioritize net use by pregnant women and young children if
you do not have enough bed nets for everyone. These activities were intensified before the malaria
transmission season. Following standard government practice, all villages in both intervention arms
and the control received Long Lasting Insecticide Treated Nets (LLINs) as well as standard gov-
ernment information campaigns, and all ASHA received training in RDT and ACT usage. Further
implementation details on both interventions are given in Das et al. [2014].
2.2 Data
Follow-up data were collected from November 2010 to January 2011 via a household question- naire as well as an individual questionnaire administered to recent (two week recall) fever cases.
The household-level questionnaire recorded demographic, socioeconomic and health characteristics, health seeking behavior, knowledge on malaria, and the utilization of bed nets. The individual fever questionnaire collected information on treatment-seeking behavior from recent fever cases. In each village a full enumeration was first conducted and all households with a reported recent fever case were noted. Ten households were randomly selected from each enumeration list and interviewed for general household information and net usage in each village. An additional ten households were randomly chosen from the complete list of fever cases in the villages for the individual questionnaire.
Little baseline information was available at the time of the village-level randomized assignment into treatment arms, so researchers selected the 30 most endemic villages in each of the four study sub-districts and randomly assigned them to arms A, B, or K. With the collected endline sur- vey data we can investigate the balance of characteristics that may be relevant for intervention performance but are unlikely to be affected by the intervention activities themselves. These char- acteristics include various demographic and socioeconomic measures of the household, as well as basic characteristics of the ASHA worker.
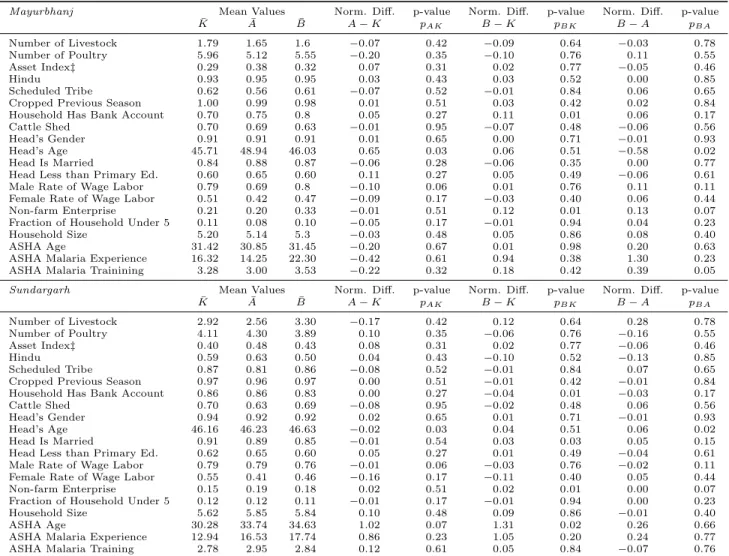
3Appendix Table 1 presents these mean characteristics for the population representative sample and Appendix Table 2 for the sample of households with recent fever. Each of the tables in turn present results separately by district since this study focuses on differences in performance across districts and thus needs to investigate any difference in sample balance within the two districts that may confound cross-district comparisons of intervention effectiveness.
The village randomization resulted in a largely balanced sample. Besides the mean character- istics in each study arm (A, B, and K), the tables also report the standardized mean difference in characteristics for each pairwise comparison and the p-value of the standard t-test of difference.
Very few of the standardized mean-differences exceed the 25 percent threshold discussed in Imbens and Wooldridge [2009] or are significantly different as suggested by traditional t-tests of equality. In
3We note that no reassignment of ASHA workers occurred during the study period.
fact only 10 of the 60 standardized pair-wise comparisons of standardized mean difference in Sun- dargarh district, and 9 of 60 in Mayurbhanj district, exceed the ten percent standardized difference threshold and most of those relate to the age of the household head or the ASHA worker herself.
In absolute value, the mean age of either category does not differ by more than 3 years and thus is unlikely to represent a meaningful difference. The same assessment is made when investigating the reported p-values. Only 4 of 57 pair-wise tests are significant at a five percent threshold for Mayurbhanj and 6 for Sundargarh, again mostly related to relatively minor differences in age. A similar degree of comparability is observed in the fever samples. Any observed cross-district differ- ence in intervention performance is thus unlikely to be driven by an imbalance of within-district characteristics across the treatment arms.
43 Intervention Results by District
This section investigates the intervention effects across a wide range of targeted outcomes, separately by district. Since the community mobilization component encouraged LLIN usage, especially for young children and pregnant women, and supervised ASHA workers were encouraged to promote LLIN usage in the community, table 1 begins with the estimated impacts on various measures of self-reported mosquito net usage. In general, we observe significant improvements in net usage in Mayurbhanj, at least per some measures, but less improvement in Sundargarh. Reported net usage is already fairly high in both districts, with 86 percent of household members in control villages sleeping under a net in Mayurbhanj, and 73 percent in Sundargarh. Despite the high rate of control village usage of nets in Mayurbhanj, an even greater fraction of the household sleeps under mosquito nets in each treatment arm (95 percent in arm A and 90 percent in arm B; both rates are significantly greater than that for controls). Treatment arm A also has a significantly greater impact on net usage than arm B, highlighting the potential importance of the supportive supervision provided to ASHA in promoting net usage even over and above general community mobilization. For Sundargarh, while the net usage rates are three percent and five percent higher
4In addition, linearly controlling for these imbalanced characteristics and their full interaction terms does not affect the main impact estimates.
in arms A and B, neither value is significantly different from controls.
Children younger than five years, a sub-population particularly vulnerable to malaria-related morbidity and mortality, also see significant improvements in reported net usage under arm A and this time improvement is observed for both districts. In Mayurbhanj, relative to controls, six percent more children in arm A are reported to sleep under nets, although the impact of arm B on net usage among children under five is not significant (and the impact of A is again significantly greater than that of arm B). While reported net usage among pregnant women– another vulnerable subpopulation– is higher in both treatment arms, particularly arm A, the differences are not significant at the ten percent level, perhaps due to the small sub-sample of pregnant women.
Households from both treatment arms as well as the controls own several mosquito nets– 2.51 on average in Mayurbhanj and 2.72 in Sundargarh; program impact on net ownership is expectedly not significant as all households in the study received LLINs.
While it appears that the Mayurbhanj intervention activities were more effective than those in Sundargarh, the final panel of Table 1 reports the p-value of a test of relative effectiveness across the districts for each of the LLIN related outcomes and for each pair-wise comparison between treatment arms A and B and control arm K. None of the relative gains in Mayurbhanj are found to be significantly different from zero, with the important exception of the comparison between interventions A and B with respect to total net use in the household. While the relative gains observed in net usage as a result of the supportive interventions in Mayurbhanj are suggestive of a more effective intervention there, these relative gains do not attain standard levels of precision.
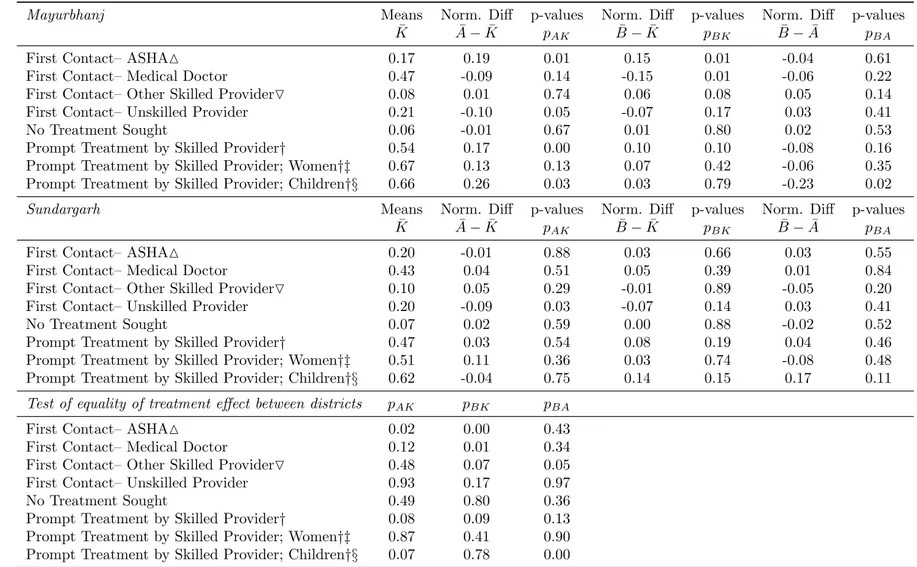
The primary goal of the supportive interventions was to increase rates of formal care seeking for fever and to shift fever care seeking towards the ASHA workers. Table 2 suggests that the intervention, arm A in particular, was successful in prompting fever patients to switch from seeking care from an unskilled provider or even a doctor with an MD to an ASHA. Since care from a skilled doctor is typically more difficult to access than from an ASHA, we expect this shift to proxy for shorter times to treatment. Performance in Mayurbhanj again drives the overall program impact.
In control villages in that district only 17 percent of all sampled fever patients saw an ASHA
worker, however the rate is 19 percentage points higher for arm A households and 15 percentage
points higher for arm B households. In arm B, the switch to ASHA comes largely from patients substituting away from doctors with an MD, while in arm A, patients are less likely to see an unskilled provider. In control villages, only 67 percent of the sample reported seeking prompt treatment (seeing a skilled healthcare provider less than 24 hours from the onset of fever). In arm A, a patient is 17 percentage points more likely than controls to receive prompt treatment. None of these impacts are significant for Sundargarh, although there too patients were significantly less likely to contact an unskilled provider upon onset of fever.
The bottom panel of table 2 also highlights significantly greater relative intervention effectiveness in Mayurbhanj than Sundargarh. First, patients from both treatment arms in Mayurbhanj are more likely than patients in Sundargarh to contact an ASHA on onset of fever relative to controls.
Second, patients of all types are more likely to receive prompt treatment from a skilled provider in Mayurbhanj than in Sundargarh, thus better fulfilling the aims of the new malaria control program and its emphasis on prompt treatment.
As proper preventive and care-seeking behaviors may not only reduce the severity of individual
infections but also reduce disease transmission due to externalities from prevention and prompt
treatment, we examine whether reported fever incidence systematically varies across the two dis-
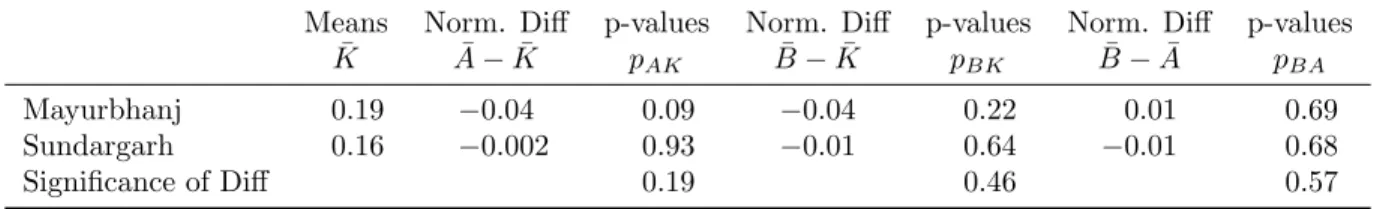
tricts. Results presented in Table 3 show that, relative to a fever incidence of 19 percent in control
villages, Arm A villages in Mayurbhanj reported a four percent lower fever incidence, significant at
the ten percent level. The control fever incidence is 16 percent in Sundargarh, but the fever rate in
treatment arm A villages is only 0.2 percent lower, and the difference is not significant. Arm B by
itself does not appear to have reduced fever incidence in either district, possibly emphasizing the
importance of the supportive supervision of ASHA in effecting the likely behavioral changes that
partly determine fever incidence. The differences in treatment effect across districts, reported in the
bottom row of Table 3, indicate no statistically significant divergence in intervention efficacy, which
may not be surprising given the high variance of the double-difference estimates compared with
the single-difference estimates reported in the rows above. The modest, yet identifiable, decline in
reported fever in treatment arm A in Mayurbhanj is again suggestive of the efficacy of intervention
activities in that district but not entirely definitive.
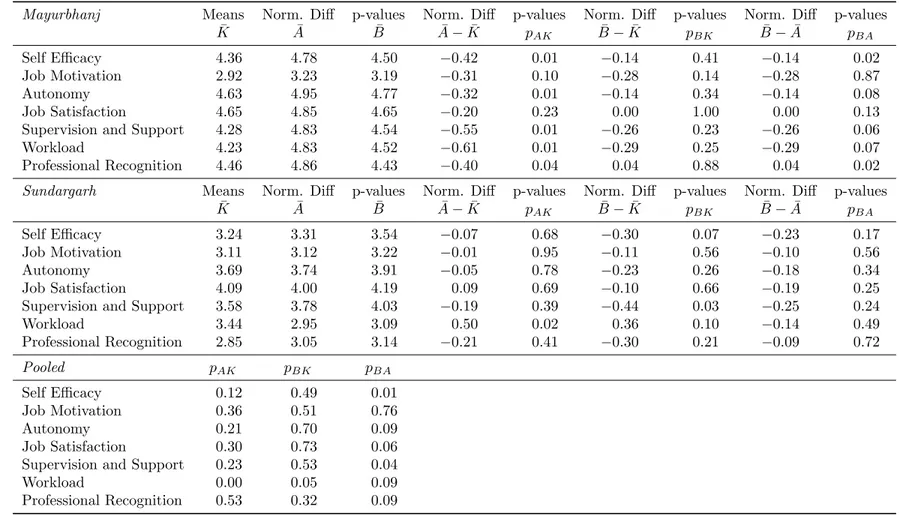
Finally, we explore key determinants of ASHA health worker performance: motivation and job satisfaction. We assess seven dimensions of ASHA motivation and job satisfaction in Table 4, which lists the mean values of these various dimensions, such as ASHA perception of her autonomy or self-efficacy, in each treatment arm separately by district. Each of these dimensions is assessed on a 5-point Likert scale from underlying survey responses (with a higher score indicating a more positive response). By comparing across treatment arms and across districts, several results are noteworthy.
First, the mean values among ASHAs in control villages in Mayurbhanj are significantly higher than in Sundargarh for all measured dimensions except job motivation. Second we find that the treatment arms in Mayurbhanj far outperform Sundargarh, with significantly higher scores for many outcomes, particularly those for arm A. As intervention arm A is the one that offers supportive supervision directed towards ASHA, we might expect this arm to have the greatest impact on ASHA satisfaction and motivation, and indeed we find that the relative performance of arm A vis-` a-vis arm B to be significantly greater across all but one of the assessed dimensions in Mayurbhanj than Sundargarh (the bottom panel of Table 4). Thus, even though the baseline levels of motivation and satisfaction are higher in Mayurbhanj, the intervention was more successful in increasing motivation and satisfaction levels even further in that district.
The results discussed above demonstrate that, whether considering net utilization, fever inci- dence, or, especially, care-seeking patterns and ASHA motivation, Mayurbhanj experienced stronger program impacts than Sundargarh.
5This differential performance naturally leads to the next ques- tion: why do we observe such divergent results between the two districts, particularly for some key indicators?
5Informational spillovers from treated villages to control villages, including those due to interactions between ASHA or individuals, may lead us to underestimate the treatment impact by inflating targeted outcomes in control areas. However, we do not find an effect of distance-weighted outcomes in the nearest treated village on outcomes in control areas. Further, these estimates do not vary by district, thus suggesting that differential spillovers across districts do not significantly contaminate our results.
4 Potential Causes of Divergent Results Across Districts
We discuss three potential causes for the divergent results: (1) differential population characteristics, (2) differential health provider characteristics, and (3) differential implementer characteristics. In this regard the discussion is very similar to studies of external validity and, specifically, external unconfoundedness in evaluative research. External validity, as discussed in Allcott [2014], can be modeled as the ability to use sample data in one study site to consistently estimate parameters in other sites. For these projections to be valid, the site assignment should be orthogonal to the differences in potential outcomes, conditional on observables.
A handful of papers in economics, public health, and epidemiology (Hotz et al. [2005], Flores and Mitnik [2013], Stuart et al. [2011]) have explored the validity of the external unconfounded- ness assumption for specific interventions by predicting the effect of an intervention or program conducted in one setting to a new population. This work is usually done by balancing the observed characteristics of the control population in the program area and the new area through a matching estimator. A somewhat more formal framework for external validity is provided by Imai et al.
[2008] who model the degree of external confoundedness between an impact estimate based on a sample and the target population average treatment effect. Let’s note this difference as ∆. If the evaluation is fully externally valid then ∆ = 0. However ∆ may be non-zero due to differences in characteristics between the sample and the population if such characteristics also mediate the treatment impact. ∆ may also be non-zero due to differences in program implementation at the different sites. More formally we can decompose ∆ into its constituent components:
∆ = ∆
xo+ ∆
xu+ ∆
io+ ∆
iu+ interaction terms (1)
Where ∆
xoand ∆
xuare the differences in observed and unobserved characteristics between
the trial population and the target population, and ∆
ioand ∆
iuare the differences in observed
and unobserved implementation factors between trial and target. Existing methods of site specific
imputation of an average treatment effect attempt to minimize bias due to ∆
xo, and therefore
we see the importance of measuring characteristics that may vary between the two samples as
well as mediate program impact. Little work till date attempts to comprehensively measure and correct for differences in implementation quality, in part due to the absence of sufficient measures of implementation quality or capacity. Our work here also lacks many of these potential measures and so will look for evidence of differential implementation influence largely by examining if differential effectiveness persists after controlling for a rich set of population characteristics.
The first reason we consider for the divergence in program impacts in our setting is due to systematic differences in population and area characteristics between Mayurbhanj and Sundargarh, i.e. an exploration of the ∆
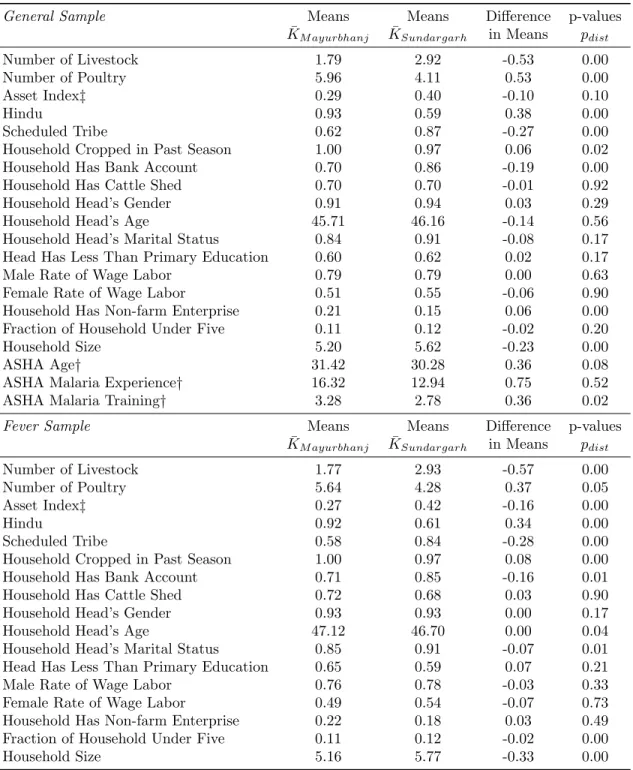
xoterm. If Mayurbhanj has characteristics more conducive to better care seeking and preventive behavior, the divergences we observed in the previous section may simply stem from these characteristics and not the effectiveness per se of local non-state institutions. As discussed above, for the most part, randomization was successful across treatment arms and so estimates of intervention impact are likely not confounded by imbalance within district. However, as presented in Table 5, the population characteristics are less balanced across districts. This table presents mean values of select characteristics as well as the normalized mean differences across the two districts and the p-values of simple t-tests of equality. We find significant differences in nine out of the twenty characteristics in the general sample, including the religious, caste, and economic composition of the samples, and for eleven characteristics in the fever sample. The sample in Mayurbhanj appears to be richer and is more likely to be Hindu than the population in Sundargarh, among other differences. These differences may contribute in important ways to differential program effectiveness and will need to be accounted for in subsequent analysis.
Another cause of the divergent program outcomes may be differential health system charac- teristics. Since the bulk of service delivery under this intervention is done by the ASHA, various characteristics related to ability can influence program outcomes. Table 5 also presents the mean age of ASHA workers, as well as the number of months they had been active in malaria control at the time of survey, and the number of days of formal training they have received on malaria control.
ASHA in Mayurbhanj are on average one year older, although this relatively small difference is un-
likely to drive differences in performance. There is no observable difference with respect to months
of experience in malaria activities, although Mayurbhanj ASHA do report an additional half-day
of formal training. This modest difference in quantity of formal training is important and needs to be considered as at least a partial explanation, although the return to formal training must be especially large– perhaps incredibly so– if this difference of 4 hours of training is able to produce all of the observed differences in program effectiveness.
6The final cause of divergence in results that we consider is the possible differential quality of implementer. Table 6 summarizes select key characteristics of each NGO. Comparing the NGO that implemented the intervention in Mayurbhanj (NGO-M) to the two that operated in Sundargarh (NGO-S1 and NGO-S2), we see that NGO-M had been active in the state prior to this study for significantly longer than the two implementers in Sundargarh (21 years, as opposed to 15 for NGO- S1 and 15 for NGO-S2). NGO-M’s scope of experience extends beyond activities solely based in Mayurbhanj while the two Sundargarh NGOs have never operated beyond that district. Although NGO-M had less experience in malaria control than NGO-S1 or NGO-S2, they have significantly more staff-level technical expertise. NGO-M’s prior malaria control experience also aligned well with the intervention, given the NGO’s focus on capacity building, informational campaigns and direct service, including street plays and community awareness. NGO-S1 had previously participated in informational campaigns and direct service, but also spent time on DDT spraying, which was not directly relevant for this intervention. NGO-S2’s malaria control activities were restricted to net distribution and DDT spraying, so they had no experience in the supportive supervision or community mobilization aspects of the intervention.
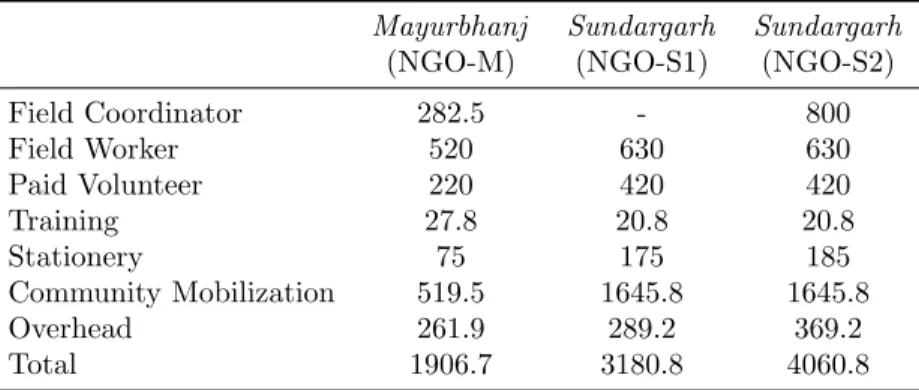
Besides implementer quality, another key determinant of performance is the availability of re- sources for intervention activities. In Table 7, we examine the average monthly budget dedicated to this project as reported by the NGOs.
7Since NGO-M implemented the project in two sub-districts in Mayurbhanj, and NGO-S1 and NGO-S2 implemented it in one block each in Sundargarh, we report the average monthly per-village budget. As the budget breakdown shows, various items
6The higher levels of ASHA motivation and job satisfaction conveyed in Table 5 may also speak to more responsive and effective health system management in Mayurbhanj district. Since we don’t directly observe this information, it cannot be ruled out as a potential dimension of difference contributing to differential performance.
7The NGO-M budget data are for the periods January 2010 to September 2010 and October 2010 to March 2011.
January, February, and March 2011 were not included in the intervention; hence, we apportion the share of different budget items in NGO-M’s October 2010 to March 2011 budget according to their share in the budget from January 2010 to September 2010, and calculate the average monthly budget based on the data for January 2010 to September 2010.
received relatively similar levels of funding from the three NGOs, with a few notable exceptions where NGO-M spent significantly less than the other two implementers. NGO-M’s average monthly per-village budget for field workers (INR 282.5) is significantly lower than those of NGO-S1 and NGO-S2 (INR 800 each); further, NGO-M spent INR 220 on paid volunteers, while NGO-S1 and NGO-S2 spent INR 420. NGO-M also only spent INR 519.45 per month per village on commu- nity mobilization, while NGO-S1 and NGO-S2 each spent INR 1645.83. The only instance where NGO-M spent more is on training: INR 27.75 per month per village versus INR 20.83 for the other two. Hence, the average monthly budget dedicated to the project is substantially less for NGO-M than the other two, yet implementation by the former yielded stronger results. As such, differential resources are unlikely to explain the differential effectiveness by implementer; rather it may be indicative of greater efficiency of activity by NGO-M.
8The descriptive investigation above finds evidence of divergent population and implementer characteristics across the two study districts as well as, to a lesser degree, some differences in the observable health system characteristics. To determine the extent to which NGO performance drives this difference rather than the differences in population and health system characteristics, we decompose intervention effectiveness using a simple regression decomposition.
9This is the first of two attempts to control for the ∆
xoterm in order to reduce the degree of any external unconfounding.
We estimate the impact of being in a district treated by NGO-M as compared to NGO-S1 or NGO-S2, while also controlling for treatment assignment and the observable household-, ASHA- and village-level characteristics that may affect malaria outcomes in the following econometric specification:
8Of course, there may be economies of scale by operating in two sub-districts, as does NGO-M while the other NGOs operate in one sub-district each. However we are doubtful that any economies of scale would explain both the magnitude of cost differences in Table 7 as well as the differential NGO performance. Also, while we do not control for possible differences in price level between the two districts, field reports suggest they are unlikely to drive such large differences in the magnitude of costs.
9This straightforward pooled-OLS regression approach provides a single unbiased estimate of the unexplained gap in outcomes. Unlike a Oaxaca-Blinder decomposition, this approach is particularly suited to situations like the one in the current paper, where the decomposition separates explained and unexplained gaps. In these contexts, pooled Oaxaca-Blinder decompositions systematically overstate the contribution of observables to the gap in outcomes [Elder et al., 2010].
Yitd
=
β0+
β1Dd+
β2Tt+
β3Xi+
β4DdTt+
β5DdXi+
µitd(2) In equation (2),
Yis the malaria-related outcome of interest for household
iin treatment arm
tand district
d. Dis the district indicator variable,
Tindicates treatment status, and
Xis the vector of observed household- and village-level characteristics (including those of the ASHA). The household and village-level controls include all the variables reported in Appendix Tables 1 and 2.
This decomposition apportions the outcome gap between two groups (e.g., NGO-M villages versus NGO-S1 or NGO-S2 villages) as a function of the variation arising from differences in (1) treatment status, (2) observed village and household characteristics, (3) a district level indicator that proxies for unobserved district level characteristics including the effect of implementer quality, (4) the interaction between the district indicator and treatment status, and (5) the interaction between the district indicator and observed characteristics. Most relevant to the question at hand is the value of coefficient
β4, which tells us whether the interaction of treatment with district, after the partialling out of all observed information, is still a significant determinant of malaria outcomes.
Such a finding would be consistent with differential impact of treatment by implementer (although of course only suggestive as other unobserved district characteristics may also interact with treatment - we cannot separately identify the influence of ∆
xuand ∆
iuas both are unobserved).
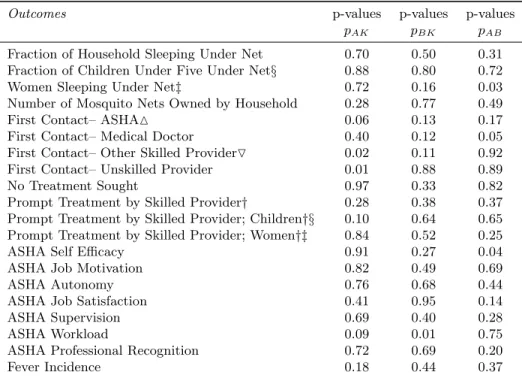
Table 8 presents the p-values of the
β4coefficient for virtually all outcomes previously discussed and for each pair-wise comparison of treatment arms A, B, and K. Consistent with the results in Tables 2-4, many of the interaction tests are not significantly different from zero, including almost all of the tests related to net usage measures. However for some of the most important indicators, those related to prompt treatment of fever and care seeking devoted to ASHA, the cross-district differences persist even after controlling for all observable characteristics.
10The decomposition
10And these observed characteristics are themselves highly influential– a simple regression of care-seeking on observables explains approximately twenty percent of the total variance, highlighting the importance of these factors (and any unobserved factors highly correlated with these factors) in influencing the key behavioral outcomes. It is also natural to extend the district-level analysis to the sub-district level and compare the two sub-districts in Sundargarh to each other, where each NGO (S1 and S2) was responsible for one sub-district. While doing so significantly decreases power, we find very little significant differences between the two sub-districts, highlighting the salience of the cross-district comparison. The key difference in performance thus appears to be between NGO-M1 and the two in Sundargarh, rather than between the two NGOs in Sundargarh.
results are consistent with differential implementation quality accounting for a substantial fraction of the differences in intervention effectiveness observed across districts.
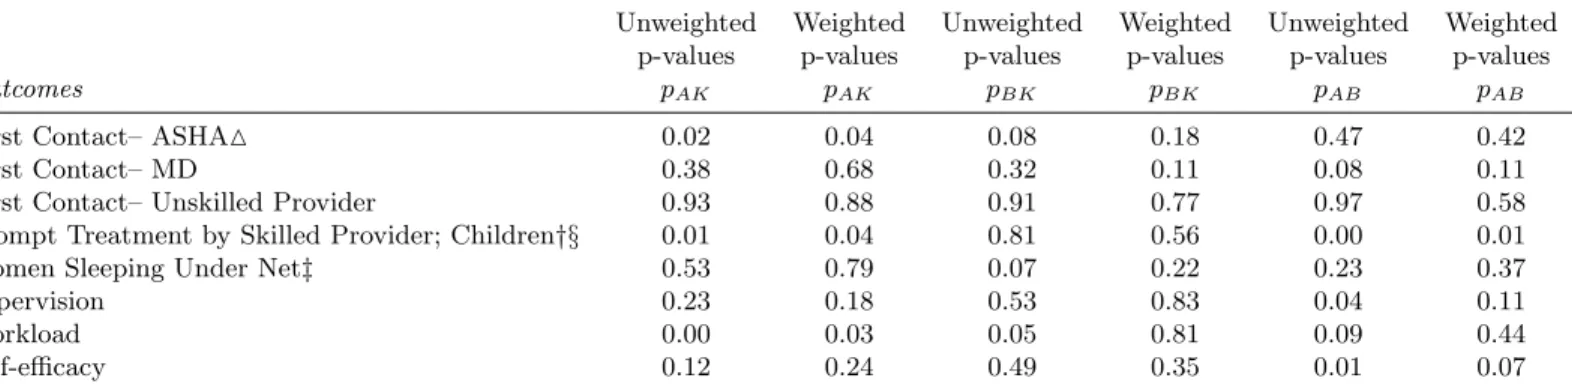
The decomposition approach described above can be complemented with propensity score weight- ing to balance observable characteristics across the districts. This involves first predicting household and health worker location in Mayurbanj vis-` a-vis Sundergarh through a probit of all observable characteristics. We estimate the propensity equation only on the control sample to avoid any con- founding from the intervention, even though none is expected, and predict propensity scores for the rest of the sample. We then estimate a variant of equation (2) without the two interaction terms and with and without propensity weights. Table 9 presents weighted and unweighted estimates for the indicators that were found to be significantly different across districts in table 8. The results in table 9 are consistent with those in table 8, with the reported differences between Sundargarh and Mayurbhanj generally persisting even after we weight results with the propensity scores of district placement.
5 Conclusion
We estimate the impact of interventions designed to support malaria control efforts in two districts
in rural Orissa, India. The first intervention group received community mobilization activities and
intensive supervision of community health workers, called ASHA, in addition to the LLINs dis-
tributed to every study village as part of the new national control program; the second intervention
group received community mobilization activities but without the intensive individual supervision
of ASHA. Overall, we find the interventions, particularly the one with supportive supervision of
ASHA, improved care-seeking behavior, ASHA motivation and job satisfaction, and gains in popu-
lation LLIN usage. However, we also observe considerable divergence in the outcomes between the
two districts in our sample. In Mayurbhanj district, the intervention increased net usage from an
already high baseline level, particularly for the most vulnerable subpopulations of children under
five and pregnant women, as well as dramatically increased the rates at which fever cases promptly
seek care from ASHA. There is even the suggestion that villages in Treatment Arm A in Mayurbhanj
suffered significantly less fever related illnesses. In Sundargarh district, however, the intervention had little effect, whether on net usage, care-seeking behavior, fever incidence, or health worker motivation.
There are various possible reasons that account for the observed divergence across districts. The characteristics of the population diverge in some key dimensions such as caste, religion, and possibly household wealth. In addition, the characteristics of the implementers– the only NGOs in either district that satisfied the relatively spartan selection criteria– widely differ. NGO-M is a larger and more established NGO with greater numbers of technical staff. Despite NGO-M devoting fewer resources to the intervention activities, greater gains were achieved vis-` a-vis the control villages. The differential results for the most targeted outcomes– prompt fever seeking behavior and fever care delivered by ASHA– persist even after we control, either linearly or through propensity weighting, for a wide range of observable household, village, and ASHA characteristics. While this divergence of results may be driven by unobserved factors correlated with the district, the main findings are consistent with differential implementer ability and/or effort.
The results in this paper contribute to the small but important literature on the generalizable relevance, or lack thereof, of small-scale policy evaluations, especially those implemented by non- state actors. Contextual knowledge and implementation capacity are surely key determinants of development effectiveness and there are numerous potential non-state actors with varying degrees of capability. Without a better understanding of the context and capabilities of both the study setting and the study participants, as well as standardized measures of implementation capacity, it will be difficult to generalize findings from any small-scale evaluation. Our results highlight the im- portance of understanding these factors in evaluative research, particularly when the underpinning institutional structure is either new, deficient, or fragile.
More narrowly, for the direct question of leveraging pre-existing local NGOs in the delivery of
public services, under-resourced areas such as those studied here are often accompanied by under-
resourced local non-state capacity. Leveraging non-state capacity will not necessarily result in
improved outcomes; additional directed public investments or incentives either in service delivery
or local NGO capacity may be necessary. This lack of local non-state capacity in many under-served
and under-resourced areas speaks to the complex interactions between poverty and local character-
istics [Blank, 2005, Ravallion and Wodon, 1999]. In highly impoverished areas, a combination of
locally targeted investments and anti-poverty policies may be necessary to improve public service
delivery and, consequently, priority welfare outcomes.
References
H. Allcott. Site selection bias in program evaluation, 2014. NBER Working paper 18373 (revised), 2014. Available at:
https://files.nyu.edu/ha32/public/research/Allcott_SiteSelectionBias.pdf.
H. Allcott and S. Mullainathan. Site selection bias in program evaluation, 2012. NBER Working paper No. 18373. Available at:
http://www.nber.org/papers/w18373.N. Awortwi and A.H.J. Helmsing. Governance of basic services provision in sub-Saharan Africa and the need to shift gear. Technical report, International Institute of Social Studies of Erasmus University (ISS), July 2007 2007. URL
http://hdl.handle.net/1765/2157.R. Batley. Engaged or divorced? Cross-service findings on government relations with non-state service-providers. Public Administration and Development, 26(3):241–251, 2006.
P. Berman. Rethinking health care systems: Private health care provision in India. World Devel- opment, 26(8):1463 – 1479, 1998.
D. Bishai, N. Shah, D. Walker, W. Brieger, and D. Peters. Social franchising to improve quality and access in private health care in developing countries. Harvard Health Policy Review, 9(1):
184–197, Spring 2008.
R. Blank. Povery, policy, and place: How poverty and policies to alleviate poverty are shaped by local characteristics. International Regional Science Review, 28(4):441–464, 2005.
E. Bloom, E King, I. Bhushan, M. Kremer, D. Clingingsmith, B. Loevinsohn, R. Hong, and J. B.
Schwartz. Contracting for health: Evidence from Cambodia. Technical report, NBER working paper, 2005.
T. Bold, M. Kimenyi, G. Mwabu, A. Ng’ang’a, and J. Sandefur. Interventions & institutions:
Experimental evidence on scaling up education reforms in kenya, 2012. Working paper. Available
at:
http://www.cgdev.org/doc/kenya_rct_webdraft.pdf.A. Das, J. Friedman, E. Kandpal, G.N.V. Ramana, R.K. Das Gupta, M. M. Pradhan, and R. Govin- daraj. Strengthening malaria service delivery through supportive supervision and community mobilization in an endemic Indian setting: An evaluation of nested delivery models. Technical report, World Bank Policy Research Working Paper No. 6901, 2014.
L.K. Das, P. Jambulingam, and C. Sadanandane. Impact of community-based presumptive chloro- quine treatment of fever cases on malaria morbidity and mortality in a tribal area in Orissa state, India. Malaria Journal, 5:7–75, May 2008.
P. de Renzio. Increased aid vs absorptive capacity: Challenges and opportunities towards 2015.
IDS Bulletin, 36(3):20–27, 2005.
A. Deaton. Instruments, randomization, and learning about development. Journal of Economic Literature, pages 424–455, 2010.
T. Elder, J. Goddeeris, and S. Haider. Unexplained gaps and Oaxaca–Blinder decompositions.
Labour Economics, 17(1):284–290, 2010.
C. Flores and O. Mitnik. Comparing treatments across labor markets: An assessment of nonex- perimental multiple-treatment strategies. Review of Economics and Statistics, 95(5):1691–1707, 2013.
J. Hammer and D. Spears. Village sanitation and children’s human capital: Evidence from a randomized experiment by the Maharashtra government. Technical report, World Bank Policy Research Working Paper No. 6580, August 2013, 2009.
S. C. Hong. Malaria: An early indicator of later disease and work level. Journal of Health Economics, 32(3):612–632, 2013.
V. Hotz, G. Imbens, and J. Mortimer. Predicting the efficacy of future training programs using past experiences at other locations. Journal of Econometrics, 125(102):241–270, 2005.
K. Imai, G. King, and E. Stuart. Misunderstandings between experimentalists and observationalists
about causal inference. Journal of the Royal Statistical Society: Series A (Statistics in Society), 171(2):481–502, 2008.
G. Imbens and J. Wooldridge. Recent developments in the econometrics of program evaluation.
Journal of Economic Literature, 47:5–86, 2009.
International Finance Corporation. How Governments Can Engage the Private Sector to Improve Health in Africa: Healthy Partnerships. Technical report, World Bank, June 2011. URL
https://openknowledge.worldbank.org/handle/10986/2304License:CCBY3.0IGO.
J. Maluccio. The Impact of Conditional Cash Transfers on Consumption and Investment in Nicaragua. Journal of Development Studies, 46(1):14–38, 2010.
L. Pritchett and J. Sandefur. Context matters for size: Why external validity claims & development practice don’t mix. Technical report, Center for Global Development Working Paper 336, 2013.
L. Pritchett, M. Woolcock, and M. Andrews. Looking like a state: techniques of persistent failure in state capability for implementation. The Journal of Development Studies, 49(1):1–18, 2013.
M. Ravallion and Q. Wodon. Poor areas or only poor people? Journal of Regional Science, 39:
689–711, 1999.
L. B. Rawlings and G. M. Rubio. Evaluating the impact of conditional cash transfer programs. The World Bank Research Observer, 20(1):29–55, Spring 2005.
D. Rodrik. The new development economics: We shall experiment, but how shall we learn?, 2008. Working paper. Available at:
http://ksghome.harvard.edu/~drodrik/The\%20New\%20Development\%20Economics.pdf.
V. P. Sharma, P. Jha, N. Dhingra, R.M. Jotkar, and R. Peto. Malaria-attributed death rates in india– authors’ reply. The Lancet, 377(9770):994–995, 2011.
E. Stuart, S. Cole, C. Bradshaw, and P. Leaf. The use of propensity scores to assess the gener-
alizability of results from randomized trials. Journal of the Royal Statistical Society: Series A
(Statistics in Society), 174(2):369–386, 2011.
A. Venkataramani. Early life exposure to malaria and cognition in adulthood: Evidence from mexico. Journal of Health Economics, 31(5):767–780, 2012.
M. Woolcock. Using case studies to explore the external validity of complex development interven- tions. Evaluation, 19:229–248, 2013.
World Health Organization. World Malaria Report, 2009.
6 Tables
Table 1: Differential Impact of Supportive Intervention on Mosquito Net Usage, By District
Mayurbhanj Means Norm. Diff p-values Norm. Diff p-values Norm. Diff p-values
K
¯
A¯
−K¯
pAK B¯
−K¯
pBK B¯
−A¯
pBAFraction of Household Sleeping Under Net 0.86 0.09 0.00 0.04 0.03 -0.05 0.00
Fraction of Children Under Five Under Net 0.93 0.06 0.07 0.02 0.65 -0.04 0.07
Pregnant Women Sleeping Under Net† 0.83 0.13 0.16 0.02 0.80 -0.10 0.16
Number of Mosquito Nets Owned 2.51 -0.03 0.82 0.13 0.30 0.16 0.23
Sundargarh Means Norm. Diff p-values Norm. Diff p-values Norm. Diff p-values
K
¯
A¯
−K¯
pAK B¯
−K¯
pBK B¯
−A¯
pBAFraction of Household Sleeping Under Net 0.73 0.03 0.45 0.05 0.16 0.02 0.37
Fraction of Children Under Five Under Net 0.83 0.12 0.03 0.09 0.11 -0.03 0.45
Pregnant Women Sleeping Under Net† 0.82 0.08 0.50 0.12 0.36 0.03 0.69
Number of Mosquito Nets Owned 2.72 0.19 0.20 0.27 0.09 0.07 0.65
Test of equality of treatment effect between districts
pAK pBK pBAFraction of Household Sleeping Under Net 0.46 0.37 0.01 Fraction of Children Under Five Under Net 0.98 0.79 0.58
Pregnant Women Sleeping Under Net† 0.18 0.29 0.22
Number of Mosquito Nets Owned 0.34 0.39 0.68
1
This table reports the impact of the treatment arms (A and B) of the malaria intervention on net usage in treated villages relative to control villages (K).
2
There are 120 villages in the sample; 40 in treatment arm A, 40 in treatment arm B, and 40 are controls.
3
There are 1180 households in the general sample; 390 in arm A, 400 in arm B, and 390 controls.
4
All p-values (p
AK,
pBK,
pBA) are based on standard errors clustered at the village level.
†The corresponding survey question asks currently pregnant women, “During pregnancy, did/do you sleep under a mosquito net?”
24
Table 2: Impact of Supportive Intervention on Fever Care Seeking, By District
Mayurbhanj Means Norm. Diff p-values Norm. Diff p-values Norm. Diff p-values
K
¯
A¯
−K¯
pAK B¯
−K¯
pBK B¯
−A¯
pBAFirst Contact– ASHA
M0.17 0.19 0.01 0.15 0.01 -0.04 0.61
First Contact– Medical Doctor 0.47 -0.09 0.14 -0.15 0.01 -0.06 0.22
First Contact– Other Skilled Provider
O0.08 0.01 0.74 0.06 0.08 0.05 0.14
First Contact– Unskilled Provider 0.21 -0.10 0.05 -0.07 0.17 0.03 0.41
No Treatment Sought 0.06 -0.01 0.67 0.01 0.80 0.02 0.53
Prompt Treatment by Skilled Provider† 0.54 0.17 0.00 0.10 0.10 -0.08 0.16
Prompt Treatment by Skilled Provider; Women†‡ 0.67 0.13 0.13 0.07 0.42 -0.06 0.35
Prompt Treatment by Skilled Provider; Children†§ 0.66 0.26 0.03 0.03 0.79 -0.23 0.02
Sundargarh Means Norm. Diff p-values Norm. Diff p-values Norm. Diff p-values
K
¯
A¯
−K¯
pAK B¯
−K¯
pBK B¯
−A¯
pBAFirst Contact– ASHA
M0.20 -0.01 0.88 0.03 0.66 0.03 0.55
First Contact– Medical Doctor 0.43 0.04 0.51 0.05 0.39 0.01 0.84
First Contact– Other Skilled Provider
O0.10 0.05 0.29 -0.01 0.89 -0.05 0.20
First Contact– Unskilled Provider 0.20 -0.09 0.03 -0.07 0.14 0.03 0.41
No Treatment Sought 0.07 0.02 0.59 0.00 0.88 -0.02 0.52
Prompt Treatment by Skilled Provider† 0.47 0.03 0.54 0.08 0.19 0.04 0.46
Prompt Treatment by Skilled Provider; Women†‡ 0.51 0.11 0.36 0.03 0.74 -0.08 0.48
Prompt Treatment by Skilled Provider; Children†§ 0.62 -0.04 0.75 0.14 0.15 0.17 0.11 Test of equality of treatment effect between districts
pAK pBK pBAFirst Contact– ASHA
M0.02 0.00 0.43
First Contact– Medical Doctor 0.12 0.01 0.34
First Contact– Other Skilled Provider
O0.48 0.07 0.05
First Contact– Unskilled Provider 0.93 0.17 0.97
No Treatment Sought 0.49 0.80 0.36
Prompt Treatment by Skilled Provider† 0.08 0.09 0.13
Prompt Treatment by Skilled Provider; Women†‡ 0.87 0.41 0.90 Prompt Treatment by Skilled Provider; Children†§ 0.07 0.78 0.00
1
There are 120 villages in the sample; 40 in treatment arm A, 40 in treatment arm B, and 40 are controls
2
There are 1124 households in the fever sample; 378 in arm A, 381 in arm B, and 365 controls.
3
All p-values (p
AK,
pBK,
pBA) are based on standard errors clustered at the village level.
M
ASHA (Accredited Social Health Activists) are Indian Community Health Workers.
OOther Skilled Providers include the following Indian health cadres: Auxiliary Nurse Midwives, Anganwadi Workers, Male Health Workers, and other Health Workers.
†Defined as a fever patient contacting a skilled healthcare provider in less than 24 hours after the onset of fever. ‡The female sample is
25
Table 3: Impact of Supportive Intervention on Fever Incidence, By District
Means Norm. Diff p-values Norm. Diff p-values Norm. Diff p-values
K
¯
A¯
−K¯
pAK B¯
−K¯
pBK B¯
−A¯
pBAMayurbhanj 0.19
−0.040.09
−0.040.22 0.01 0.69
Sundargarh 0.16
−0.0020.93
−0.010.64
−0.010.68
Significance of Diff 0.19 0.46 0.57
1
There are 120 villages in the sample; 40 in treatment arm A, 40 in treatment arm B, and 40 are controls.
2
All p-values (p
AK,
pBK,
pBA) are based on standard errors clustered at the village level.
3
Fever Incidence is based on a full enumeration of households in study villages and defined through a two week recall period.
26
Table 4: Impact of Supportive Intervention on Community Health Worker (ASHA) Motivation, By District
Mayurbhanj Means Norm. Diff p-values Norm. Diff p-values Norm. Diff p-values Norm. Diff p-values
K
¯
A¯
B¯
A¯
−K¯
pAK B¯
−K¯
pBK B¯
−A¯
pBASelf Efficacy 4.36 4.78 4.50
−0.420.01
−0.140.41
−0.140.02
Job Motivation 2.92 3.23 3.19
−0.310.10
−0.280.14
−0.280.87
Autonomy 4.63 4.95 4.77
−0.320.01
−0.140.34
−0.140.08
Job Satisfaction 4.65 4.85 4.65
−0.200.23 0.00 1.00 0.00 0.13
Supervision and Support 4.28 4.83 4.54
−0.550.01
−0.260.23
−0.260.06
Workload 4.23 4.83 4.52
−0.610.01
−0.290.25
−0.290.07
Professional Recognition 4.46 4.86 4.43
−0.400.04 0.04 0.88 0.04 0.02
Sundargarh Means Norm. Diff p-values Norm. Diff p-values Norm. Diff p-values Norm. Diff p-values
K
¯
A¯
B¯
A¯
−K¯
pAK B¯
−K¯
pBK B¯
−A¯
pBASelf Efficacy 3.24 3.31 3.54
−0.070.68
−0.300.07
−0.230.17
Job Motivation 3.11 3.12 3.22
−0.010.95
−0.110.56
−0.100.56
Autonomy 3.69 3.74 3.91
−0.050.78
−0.230.26
−0.180.34
Job Satisfaction 4.09 4.00 4.19 0.09 0.69
−0.100.66
−0.190.25
Supervision and Support 3.58 3.78 4.03
−0.190.39
−0.440.03
−0.250.24
Workload 3.44 2.95 3.09 0.50 0.02 0.36 0.10
−0.140.49
Professional Recognition 2.85 3.05 3.14
−0.210.41
−0.300.21
−0.090.72
Pooled
pAK pBK pBASelf Efficacy 0.12 0.49 0.01
Job Motivation 0.36 0.51 0.76
Autonomy 0.21 0.70 0.09
Job Satisfaction 0.30 0.73 0.06
Supervision and Support 0.23 0.53 0.04
Workload 0.00 0.05 0.09
Professional Recognition 0.53 0.32 0.09
1
There are 120 villages in the sample; 40 in treatment arm A, 40 in treatment arm B, and 40 are controls.
27
Table 5: Tests of Equality in Mean Characteristics in Control Villages, By District
General Sample Means Means Difference p-values
K
¯
M ayurbhanj K¯
Sundargarhin Means
pdistNumber of Livestock 1.79 2.92 -0.53 0.00
Number of Poultry 5.96 4.11 0.53 0.00
Asset Index‡ 0.29 0.40 -0.10 0.10
Hindu 0.93 0.59 0.38 0.00
Scheduled Tribe 0.62 0.87 -0.27 0.00
Household Cropped in Past Season 1.00 0.97 0.06 0.02
Household Has Bank Account 0.70 0.86 -0.19 0.00
Household Has Cattle Shed 0.70 0.70 -0.01 0.92
Household Head’s Gender 0.91 0.94 0.03 0.29
Household Head’s Age 45.71 46.16 -0.14 0.56
Household Head’s Marital Status 0.84 0.91 -0.08 0.17
Head Has Less Than Primary Education 0.60 0.62 0.02 0.17
Male Rate of Wage Labor 0.79 0.79 0.00 0.63
Female Rate of Wage Labor 0.51 0.55 -0.06 0.90
Household Has Non-farm Enterprise 0.21 0.15 0.06 0.00
Fraction of Household Under Five 0.11 0.12 -0.02 0.20
Household Size 5.20 5.62 -0.23 0.00
ASHA Age† 31.42 30.28 0.36 0.08
ASHA Malaria Experience† 16.32 12.94 0.75 0.52
ASHA Malaria Training† 3.28 2.78 0.36 0.02
Fever Sample Means Means Difference p-values
K
¯
M ayurbhanj K¯
Sundargarhin Means
pdistNumber of Livestock 1.77 2.93 -0.57 0.00
Number of Poultry 5.64 4.28 0.37 0.05
Asset Index‡ 0.27 0.42 -0.16 0.00
Hindu 0.92 0.61 0.34 0.00
Scheduled Tribe 0.58 0.84 -0.28 0.00
Household Cropped in Past Season 1.00 0.97 0.08 0.00
Household Has Bank Account 0.71 0.85 -0.16 0.01
Household Has Cattle Shed 0.72 0.68 0.03 0.90
Household Head’s Gender 0.93 0.93 0.00 0.17
Household Head’s Age 47.12 46.70 0.00 0.04
Household Head’s Marital Status 0.85 0.91 -0.07 0.01
Head Has Less Than Primary Education 0.65 0.59 0.07 0.21
Male Rate of Wage Labor 0.76 0.78 -0.03 0.33
Female Rate of Wage Labor 0.49 0.54 -0.07 0.73
Household Has Non-farm Enterprise 0.22 0.18 0.03 0.49
Fraction of Household Under Five 0.11 0.12 -0.02 0.00
Household Size 5.16 5.77 -0.33 0.00
1
This table reports the mean levels of household and community health worker characteristics as well as the normalized mean differences in means in the general sample, and p-values from t-tests for equality of the means across district.
2pdist
is the p-value for the test of equality of characteristics across districts.
3
p-values correspond to standard errors clustered at the village level.
†ASHA are Indian Community Health Workers. “Malaria Experience” refers to the months of
malaria care provided by the ASHA at the onset of the program. “Malaria Training” refers to the days of intensive malaria training received.
‡The asset index used in this paper uses the weights from the principal component analysis