AUS DEM LEHRSTUHL FÜR NEUROLOGIE
PROF. DR. MED. ULRICH BOGDAHN DER FAKULTÄT FÜR MEDIZIN DER UNIVERSITÄT REGENSBURG
The Influence of Metformin and TGF-β
2on Proliferation and Migration
of Glioblastoma Cells
Inaugural – Dissertation
zur Erlangung des Doktorgrades der Medizin
der
Fakultät für Medizin der Universität Regensburg
vorgelegt von Anne-Louise Meyer
2016
II
III
AUS DEM LEHRSTUHL FÜR NEUROLOGIE
PROF. DR. MED. ULRICH BOGDAHN DER FAKULTÄT FÜR MEDIZIN DER UNIVERSITÄT REGENSBURG
The Influence of Metformin and TGF-β
2on Proliferation and Migration
of Glioblastoma Cells
Inaugural – Dissertation
zur Erlangung des Doktorgrades der Medizin
der
Fakultät für Medizin der Universität Regensburg
vorgelegt von Anne-Louise Meyer
2016
IV
Dekan: Prof. Dr. Dr. Torsten E. Reichert 1. Berichterstatter: Prof. Dr. med. Peter Hau
2. Berichterstatter: Prof. Dr. med. Martin Proescholdt
Tag der mündlichen Prüfung: 19.04.2017
V
Selbstständigkeitserklärung
Ich, Anne-Louise Meyer, geboren am 25.12.1988 in Itzehoe, erkläre hiermit, dass ich die vorliegende Arbeit ohne unzulässige Hilfe Dritter und ohne Benutzung anderer als der angegebenen Hilfsmittel angefertigt habe.
Die aus anderen Quellen direkt oder indirekt übernommenen Daten und Konzepte sind unter Angabe der Quelle gekennzeichnet. Insbesondere habe ich nicht die entgeltliche Hilfe von Vermittlungs- bzw. Beratungsdiensten (Promotionsberater oder andere Personen) in Anspruch genommen. Niemand hat von mir unmittelbar oder mittelbar geldwerte Leistungen für Arbeit erhalten, die im Zusammenhang mit dem Inhalt der vorgelegten Dissertation stehen.
Die Arbeit wurde bisher weder im In- noch im Ausland in gleicher oder ähnlicher Form einer anderen Prüfungsbehörde vorgelegt.
Ort, Datum Unterschrift
VI
Table of Contents
Selbstständigkeitserklärung ... V
1 ABSTRACT ... 1
2 ZUSAMMENFASSUNG ... 2
3 INTRODUCTION ... 4
3.1 Glioblastoma ... 4
3.2 The role of metformin in diabetes and glioblastoma... 10
3.3 The role of TGF-β
2in glioblastoma ... 16
3.4 Possible links between metformin and TGF-β
2... 22
3.5 Research aim ... 24
4 MATERIAL AND METHODS ... 25
4.1 Material ... 25
4.1.1 Consumables and supplies ... 25
4.1.2 Glioblatoma cell lines ... 26
4.1.3 Culture media and supplements ... 28
4.1.4 Additional substances and solutions ... 30
4.1.5 Equipment ... 30
4.1.6 Software ... 31
4.2 Methods ... 31
4.2.1 Cell culture ... 31
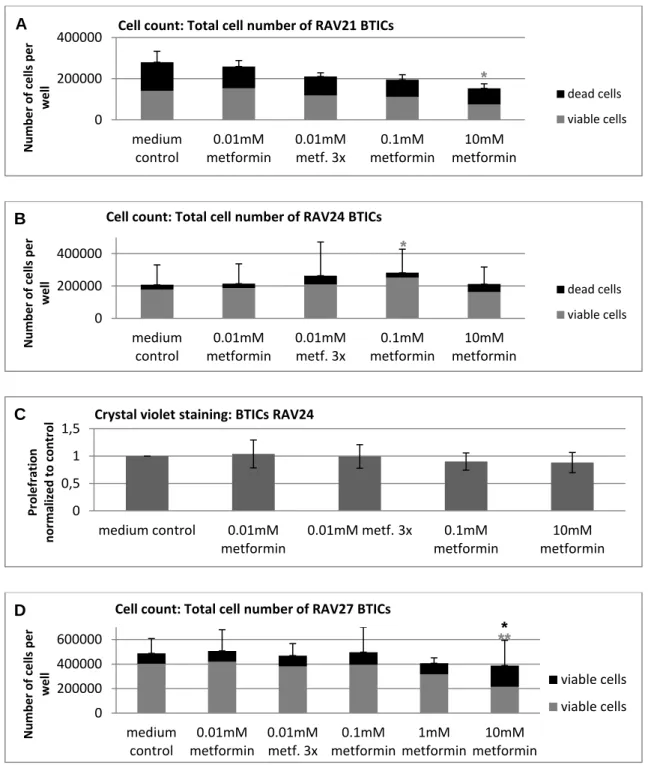
4.2.2 Cell Proliferation Assays ... 33
4.2.3 Crystal-Violet Staining ... 36
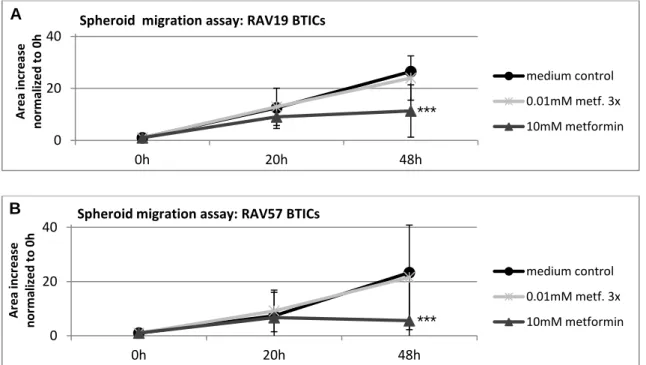
4.2.4 Spheroid Assay ... 37
4.2.5 Scratch Migration Assay ... 39
4.2.6 Analysis of data ... 40
5 RESULTS ... 41
5.1 The functional effects of metformin on GBM cells ... 41
5.1.1 Overall, high doses of metformin reliably reduced proliferation and migration . 41
5.1.2 Susceptibility to metformin's anti-proliferative and anti-migratory action varied
among subgroups of cells ... 43
VII
5.1.3 Unique cellular reaction patterns to metformin ... 48
5.2 The functional effects of TGF-β
2on GBM cells ... 60
5.2.1 TGF-β
2's effects were anti-proliferative and anti-migratory ... 60
5.2.2 Mesenchymal GBM cell lines were most susceptible to TGF-β
2... 62
5.2.3 Unique cellular reaction patterns to TGF-β
2and SD-208 ... 66
5.3 The functional effects of metformin and TGF-β
2on GBM cells ... 73
5.3.1 Metformin and TGF-β
2were anti-proliferative and anti-migratory ... 73
5.3.2 The combination of 10 mM metformin and 10 ng/ml TGF-β
2reduced proliferation and migration especially in mesenchymal cell lines ... 75
5.3.3 Unique cellular reaction patterns to the combination of TGF-β
2and metformin 80 5.4 Synopsis of the functional effects of metformin, TGF-β
2and SD-208 ... 98
6 DISCUSSION ... 100
6.1 The role of metformin in GBM ... 100
6.2 The role of TGF-β
2in GBM ... 106
6.3 Possible links between metformin and TGF-β
2in GBM ... 111
6.4 Outlook ... 119
7 LITERATURE ... 121
8 APPENDIX ... 132
8.1 Table of Abbreviations ... 132
8.2 Table of Figures ... 139
8.3 Table of Tables ... 143
8.4 Table of Equations ... 145
8.5 Acknowledgments ... 146
1
1 ABSTRACT
To this day, glioblastoma (GBM) remains a brain tumor impossible to cure. Among its tumor properties are rapid proliferation and aggressive migration, two hallmarks investigated in this study. GBM's rapid recurrence after treatment is attributed to tumor cells exhibiting stem cell properties, the so called brain tumor initiating cells (BTICs). These are targeted by the anti- diabetic drug metformin which has demonstrated its anti-glioma potential in previous studies.
However, metformin's mechanisms and especially its links to transforming growth factor beta 2 (TGF-β
2) are not yet fully understood. Therefore, this study explored the effects of different doses of metformin and a single dose of TGF-β
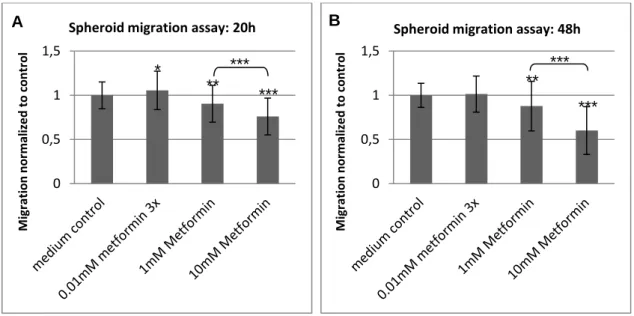
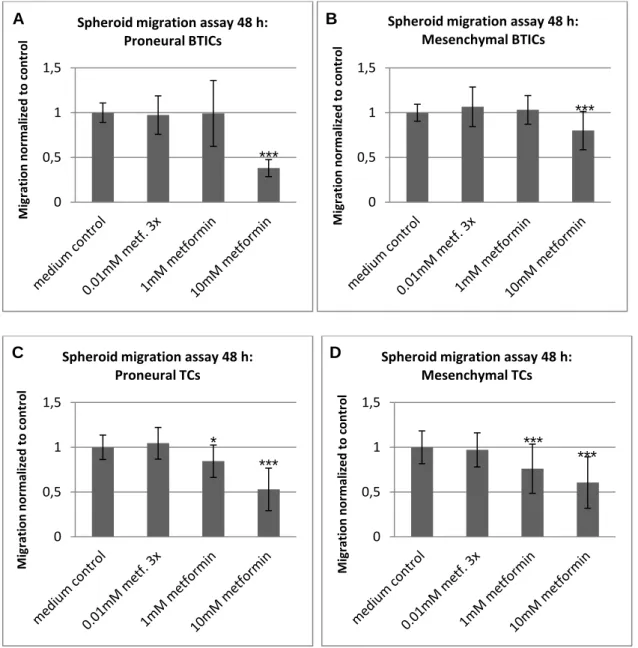
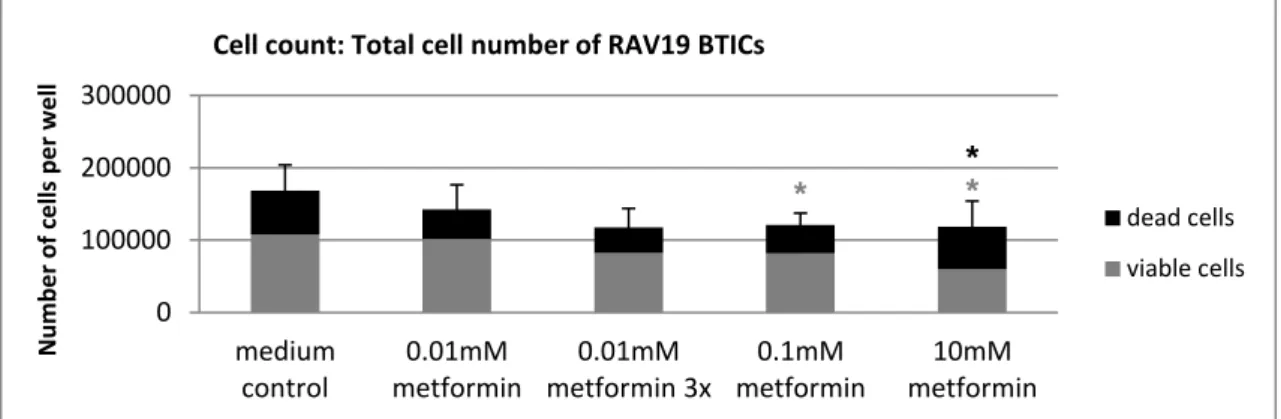
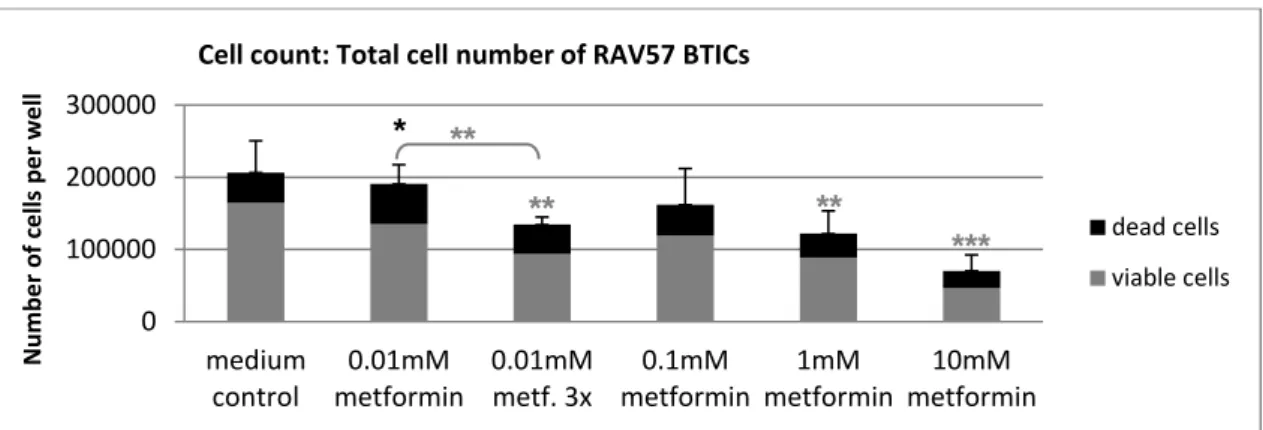
2on proliferation and migration of proneural and mesenchymal BTICs and their differentiated counterparts (TCs) as well as possible functional interactions. Proliferation and migration of 5 BTIC and 5 TC lines were assessed in cell counts, CyQuant assays, spheroid migration assays and scratch migration assays.
The functional investigation showed that 10 mM metformin reliably reduced proliferation and migration of primary GBM cell lines and also demonstrated that low doses of metformin may inhibit proliferation of proneural BTICs. Proneural cells were more susceptible to metformin than mesenchymal cells and BTICs were more susceptible than TCs providing possible predictors for successful metformin treatment. The low-dose effects of metformin also seem attainable in brain tissue of human cancer patients. Hence, this study sets the rationale to explore higher doses of metformin in patients who may profit from metformin treatment, especially since proneural cells respond less to standard temozolomide (TMZ) treatment.
The effects of TGF-β
2, a cytokine held responsible for GBM's proliferation, invasion, angiogenesis and immunosuppression, were also assessed. Unexpectedly, TGF-β
2had either no effects or it decreased proliferation and migration. Generally, mesenchymal cells showed an increased sensitivity.
As TGF-β
2has been described to increase proliferation and migration while metformin may
lower both, this study investigated whether their functional effects were opposite. This was
not the case. The effects of the combination of TGF-β
2and metformin were anti-proliferative
and anti-migratory. They were either as strong as those of the single agents or stronger
indicating that there is no functional opposition of the two but rather uniform effects possibly
potentiating each other. Thus, this study suggests that metformin and TGF-β
2exert their
functional effects independently of each other.
2
2 ZUSAMMENFASSUNG
Das Glioblastom (GBM) ist ein bis heute nicht heilbarer Hirntumor. Diese Studie untersuchte zwei der wichtigsten Tumoreigenschaften des Glioblastoms, seine rasche Proliferation und seine Migration. Die hohe Rezidivrate bei Glioblastompatienten wird einer Zellpopulation mit Stammzelleigenschaften zugeschrieben, den sogenannten Hirntumor-initiierenden Zellen (BTICs). Bisherige Studien zeigten, dass die Vermehrung und die Wanderung von GBM Zellen im Allgemeinen und von BTICs im Speziellen mithilfe von Metformin reduziert werden können. Allerdings sind die Wirkmechanismen von Metformin und insbesondere seine potentiellen Interaktionen mit dem Wachstumsfaktor transforming growth factor beta 2 (TGF- β
2) bisher nicht vollständig verstanden. Darum untersuchte diese Studie die Wirkung verschiedener Dosen Metformin und einer Dosis TGF-β
2auf die Proliferation und Migration von proneuralen und mesenchymalen BTICs und den jeweiligen differenzierten Tumorzellen (TCs) sowie mögliche Interaktionen. Proliferation und Migration von 5 BTIC- und 5 TC-Linien wurden mittels Zellzählungen, CyQuant Assays, Spheroid-Migrationsassays und Scratch- Migrationsassays untersucht.
Dabei zeigte sich, dass 10 mM Metformin zuverlässig Proliferation und Migration der GBM Zelllinien senkte und dass niedrige Dosen die Proliferation von proneuralen BTICs hemmten.
Proneurale Zelllinien sprachen insgesamt besser auf Metformin an als mesenchymale und BTICs sprachen besser an als ausdifferenzierte Zellen. Damit kann die Einteilung von GBM in proneurale und mesenchymale Tumore weiter als Prediktor für das Ansprechen auf eine Behandlung mit Metformin erforscht werden um in der Zukunft möglicherweise klinische Anwendung finden. Da niedrige Metforminkonzentrationen realistischerweise im Hirngewebe erreicht werden können und proneurale Tumore schlecht auf die Standardbehandlung mit Temozolomid (TMZ) ansprechen, sollten klinische Studien mit Metforminbehandlung insbesondere bei Patienten mit proneuralen GBM durchgeführt werden.
Außerdem wurde die Wirkung von TGF-β
2, einem Wachstumsfaktor, der bei GBM Proliferation, Migration, Invasion und Angiogenese fördert und das Immunsystem supprimiert, untersucht. Im untersuchten zellulären Modell zeigte TGF-β
2entweder keine Effekte oder senkte Proliferation und Migration. Hierbei wiesen mesenchymale Zelllinien eine höhere Sensitivität auf als proneurale.
Da TGF-β
2als Proliferations- und Migrations-fördernd beschrieben worden ist, Metformin
beides zu senken vermag und zudem als Antagonist von TGF-β
2in anderen Tumormodellen
beschrieben worden ist, untersuchte diese Arbeit des Weiteren, ob die Wirkungen von
TGF-β
2und Metformin einander entgegenstehen. Dies war nicht der Fall: Die
3
Kombinationsbehandlung war, wenn es Effekte gab, anti-proliferativer oder anti-
migratorischer Natur. Dabei war die Wirkung entweder mindestens genauso stark wie bei
Einzelbehandlung oder stärker. Insgesamt kann also nicht von einer entgegengesetzten
Wirkung von Metformin und TGF-β
2auf Proliferation und Migration von GBM Zellen
ausgegangen werden. Vielmehr scheinen die funktionalen Effekte von Metformin und TGF-β
2unabhängig voneinander zu sein.
4
3 INTRODUCTION
3.1 Glioblastoma
Although a rare tumor entity, glioblastoma (GBM) is one of the deadliest. In the US, 3.19 per 100,000 inhabitants acquire GBM per year and only 14% survive for more than two years.
Five years after diagnosis, as few as 5% of the GBM patients are still alive making the diagnosis of GBM an almost certain death sentence (Stupp et al. 2009, Ostrom et al. 2014, Weller et al. Glioma guideline 2014).
Men are 1.6 times more likely to develop GMB than women (Dubrow et al., 2011). Also, age presents one of the main risk factors with probability to develop GBM increasing exponentially to the 4
thpower of age (Dubrow et al., 2011). However, GBM can affect any age group (Dubrow et al., 2011, SEER Cancer Statistics Factsheets 2016). Although the exact mechanisms of tumor genesis remain elusive, several other GBM risk factors have been established including ionizing radiation, syndromes such as Li-Fraumeni, neurofibromatosis 1 and 2, retinoblastoma, Turcot’s, tuberous sclerosis and multiple hamartoma (Houben et al. 2005, Schwartzbaum et al. 2006, Ostrom et al. 2014) and Caucasian ethnicity (Dubrow et al. 2011, Maile et al. 2016).
Patients suffering from GBM may present with a variety of symptoms. Twenty to 40% present with first time seizures (Glantz et al. 2000). Focal signs such as hemiparesis, hemihypaesthesia or aphasia, may be due to GBM (Omuro et al. 2013). Headaches, especially combined with nausea, vomiting, and those worsening when bending over, might also present the first symptom of a brain tumor (Forsyth et al. 1993). However, it is difficult to aptly diagnose GBM from generic symptoms such as headaches, ataxia, blurred vision, or dizziness (Urbánska et al 2014). Consequently, magnetic resonance imaging (MRI) is used to diagnose brain tumors. The combination of MRI and FET-PET (O-(2-[
18F]fluoroethyl)-l- tyrosine positron emission tomography) increases specificity in glioma detection (Pauleit et al. 2005). However, only biopsy or primary resection with subsequent histological analysis can determine whether or not a brain tumor belongs to the group of GBM (Weller et al.
Glioma guideline 2014).
Until 2016, Glioma was classified solely according to histological criteria defined by the 4
thEdition of the WHO Classification of Tumors of the Central Nervous System (Louis et al.
2007). Proliferation rate, infiltration of surrounding tissue, mitotic rate and atypical mitosis,
cell and nuclear atypia, microvascular proliferation, endothelial proliferation, and necrosis,
are evaluated to determine the WHO grade (I-IV) of a central nervous system (CNS) tumor
5
(Louis et al. 2007). GBM is a WHO grade IV brain tumor entity which belongs to the astrocytic tumor group and is characterized by:
high proliferation rates
high number of atypical mitosis
increased necrosis
microvascular proliferation
The update on the 4
thEdition of WHO Classification of Tumours of the Central Nervous System from 2016 (Louis et al. 2016) also accounts for genetic markers. Thus, mutations in the isocitrate dehydrogenase (idh) gene, defining whether a GBM is primary (idh-wildtype) or secondary (idh-mutant) are represented. Overall, GBM is now classified as a grade IV tumor within the group of diffuse astrocytic and oligodendroglial tumours according to mutational status (Louis et al. 2016):
GBM, IDH-wildtype o Giant cell GBM o Gliosarcoma o Epithelioid GBM
GBM, IDH-mutant.
Idh-mutational status, histological criteria as well as molecular and genetic markers are also considered to plan treatment and predict outcome (Riemenschneider et al. 2010, Weller et al.
2014). First, idh mutations can be helpful not only to differentiate between primary and secondary GBM, but also to differentiate between grade II or III glioma from grade IV glioma, because idh-1 and -2 mutations are found in approximately 80% of patients suffering from grade II or III glioma, but in only 5 to 10% of patients suffering from grade IV glioma (Weller et al. Glioma guideline 2014). The enzyme IDH catalyzes the oxidative decarboxylation of isocitrate, which is converted into α-ketoglutarate under production of NADPH (Olar et al.
2014). However, if an idh-mutation is present, isocitrate is converted to the oncometabolite
2-hydroxyglutarate (Olar et al. 2014). Due to its correlation with low grade tumors, but also
due to other mechanisms, the presence of idh-mutations usually implies a better outcome
(Olar et al. 2014). Additionally, assessing mgmt-methylation is useful for planning therapeutic
procedures and for predicting the outcome. O
6-methyguinine-DNA-methyltransferase
(MGMT) is an enzyme involved in DNA repair. If the promoter region of mgmt is methylated,
its transcription is inhibited resulting in lower enzyme levels and consequently reduced ability
of tumor cells to repair their DNA. Thus, treatment with TMZ, a DNA alkylating agent (Stupp
et al. 2005), is more effective in patients suffering from mgmt-methylation positive GBM
(Weller et al. Glioma guideline 2014).
6
In general, gliomas are treated according to their WHO grade. For GBM, standard treatment includes complete macroscopic resection of the tumor if possible and subsequent radio- chemotherapy (Stupp et al. 2005, Weller et al. Glioma guideline 2014). Surgery aims at cytoreduction of > 98% (Adamson et al. 2009). During surgery, the tumor can be stained with 5-aminolevulinic acid to enable surgeons to distinguish cancer tissue from healthy brain tissue (Stummer et al. 2006). Alternatively, sodium fluorescein is used as it seems to have less side effects and may be helpful in detecting metastases (Schebesch et al. 2012).
Following partial or total resection, patients are treated with TMZ and focal radiation (Stupp et al. 2005). For older patients with a positive mgmt methylation status, radiation is renounced in favor of chemotherapy (Weller et al. Glioma guideline 2014). Apart from this standard regime, there are two approaches approved for treatment of recurrent glioma in the US (Swanson et al. 2016): bevacizumab and tumor treating fields (TTF). Bevacizumab is a vascular endothelial growth factor (VEGF) antibody designed to lower neo-vascularisation, which largely contributes to the malignancy of brain tumors (Würth et al. 2014). TTF are alternating electrical fields which impede mitosis and lead to reduced cell proliferation. Thus, the combination of TTF and TMZ prolongs OS from 15.6 months (TMZ treatment only) to 20.5 months (Stupp et al. 2015). The immune checkpoint inhibitors, ipilimumab, pembrolizumab, and nivolumab, are currently being evaluated in clinical trials (Theeler and Gilbert 2015). While ipilimumab is a humanized IgG1 monoclonal antibody against cytotoxic T lymphocyte antigen (CTLA-4), pembrolizumab and nivolumab are humanized monoclonal antibodies against programmed cell death 1 (PD-1) (Theeler and Gilbert 2015).
However, despite extensive research on and continuous improvement of GBM treatment, prognosis remains poor. The mean survival time after diagnosis equals approximately 15 months (Stupp et al 2005). However, prognosis of individual patients varies. Longer survival and higher quality of life are being reported for patients with (Louis et al. 2007, Adamson 2009, Verhaak et al 2010):
lower age
high Karnofsky index (indicating how well patients can perform everyday life tasks without external help)
complete macroscopic primary resection (>98%)
positive idh mutation status
positive mgmt methylation status.
The poor prognosis of GBM is, among other factors, due to rapid recurrence after initial
treatment. To explain rapid recurrence, it has been proposed that a small population of brain
tumor initiating cells (BTICs) remains in the brain tissue after resection of the primary tumor
7
(Vescovi et al. 2006; Esparza et al. 2015). In 2006, Vescovi et al. proposed that these BTICs possess characteristic functional abilities:
self-renewal
formation of tumors in xenografts (e.g. mice)
potency to form different subtypes of cells including non-tumerogenic end cells
loss of proper differentiation
genetic mutations.
In order to define brain tumor initiating cells, CD133 is widely used as a marker (Beier et al.
2011). However, this concept has been challenged by Chen et al. reporting in 2010 that CD133
-brain tumor cells are also capable of forming new tumors in nude mice. These inconsistencies within the tumor stem-cell model led to alternative explanations for differences among tumor cell subpopulations such as genetic heterogeneity and micro- environment dependent plasticity (Meacham and Morrison 2013). While the tumor stem-cell model proposes a hierarchy of tumorigenic cells which can produce tumorigenic and non- tumorigenic spouses, the concept of micro-environment dependent plasticity argues that cell fates largely depend on cues from the surrounding tissue rather than on different hierarchies of tumor cells (Meacham and Morrison 2013). This study was based on the tumor stem cell model. CD133 was utilized to define stemness of BTICs along with transcription factor Sex determining region of Y (Sox2), the intermediate filament Nestin, which is highly expressed in developing neural cells, and Oligodendrocyte transcription factor 2 (Olig2) (Würth et al.
2014).
Tumors mostly develop de novo, so only approximately 10% of GBM are secondary deriving from lower grade lesions (Urbánska et al. 2014). Primary and secondary GBM differ in their genetic mutations indicating that there might be different mechanisms of tumor genesis.
While primary glioma are distinctly characterized by over-expression of epidermal growth
factor receptors (EGFR) and phosphatase and tensin homolog (pten) mutations, they do not
exhibit idh1 mutations. Secondary glioma, on the contrary, show idh1 mutations and p53
mutations, but lack EGFR amplification (Riemenschneider et al. 2010). Examining primary
glioma's specific patterns of genetic mutations, they prove to be substantially more varied
than those of secondary gliomas, including alterations in Transforming growth factor beta
signaling (TGF-β
1) (Tso et al. 2006). Genetic mutations and variant gene products present
potential therapeutic targets. As over 50% of all GBM exhibit EGFR mutations, most
commonly EGFR variant III (EGFRvIII), anti-EGFR therapeutic approaches are being
evaluated (Francis et al. 2014, Furnari et al. 2015, Hicks et al. 2016). Also, compounds to
inhibit TGF-β receptors and signaling have been explored (Hau et al. 2007, Bogdahn et al.
8
2011) and continue to be a focus of research (Nana et al. 2015, Herbertz et al. 2015, Gallo- Oller et al. 2016, clinical trials using the TGFR inhibitor galunisertib listed on www.clinicaltrials.gov: NCT02423343, NCT01220271, NCT01582269; Nov. 2016).
The heterogeneous group of GBM cells can be clustered into subgroups according to marker expression and genetic aberrations (Verhaak et al. 2010, Van Meir et al. 2010). In 2010, Verhaak et al. were able to distinguish the four subgroups of neural, proneural, classical and mesenchymal GBM cells. As experiments of the present work were conducted using proneural and mesenchymal cell lines, these are described in more detail in Table 1.
Table 1: Molecular and genetic characteristics of proneural and mesenchymal GBM cells (Verhaak 2010)
Abbreviations: CHI3LI = Chitinase 3 like protein 1; MET = HGFR hepatic growth factor receptor; CD44 = cluster of differentiation 44; MERTK = C-Mer proto-oncogene tyrosine kinase; PDGFRA = platelet derived growth factor receptor A; IDH = isocitrate dehydrogenase; NF1 = neuro fibromatosis 1; TP53 = tumor protein 53; LOH = loss of heterozygosity; PI3KCA = phosphoinositide 3 kinase catalytic subunit alpha; PI3KR1 = phosphoinositide 3 kinase receptor 1; TRADD = gene encoding for tumor necrosis factor receptor type 1-associated DEATH domain protein;
RELB = V-Rel avian reticulo-endotheliosis viral oncogene homolog B; TNFRSF1A = tumor necrosis factor receptor superfamily member 1A.
Clustering GBM cells into subgroups is helpful to predict response to treatment and survival rates, because they are different for each subgroup. While aggressive chemotherapy prolongs survival of patients with mesenchymal GBM, it does not affect survival of patients with proneural GBM (Verhaak et al. 2010). However, radiation treatment targets proneural cells to a greater extent than mesenchymal cells (Bhat et al. 2013, Nakano 2015).
Importantly, different GBM subtypes are present within the same tumor (Patel et al. 2014).
As different subtypes respond differently to treatments, intratumoral heterogeneity needs to be considered when designing new treatment approaches (Patel et al. 2014).
Additionally, it is important to note the altered metabolism of tumor cells. Instead of channeling all incoming glucose into the citric acid cycle, many tumor cells rely heavily on
Subgroup Marker expression Characteristic mutations Furtherfrequent mutations
proneural PDGFRA alteration, IDH-
mutation
p53, LOH, PIK3CA/PI3KR1 mesenchymal CHI3LI, MET, CD44,
MERTK
NF1 deletion High expression
of TRADD,
RELB,
TNFRSF1A
9
glycolysis, a mechanism termed "aerobic glycolysis" or "Warburg effect" (Warburg 1956, Vander Heiden et al. 2009). In GBM cell lines, 70 to 80% of cellular adenosine 5'-triphosphate (ATP) stems from glycolysis (Sesen et al. 2015). Marcus et al. (2010) demonstrated, that the tumor environment differs significantly from healthy brain regions in the same patient regarding glucose and lactate levels, but also growth factors and proteases.
While glucose levels in a healthy brain are between 2 and 5 mM, only 0 to 3 mM are found in brain tumor tissue (Marcus et al. 2010). Lactate levels are normally below 25 mM, but increase to 50 - 250 mM in brain tumor tissue (Marcus et al. 2010). These findings underline that GBM cells exhibit high metabolic activity and increased glycolysis. Thus, glycolysis seems to be a preferred mechanism to generate ATP in GBM cells. However, glycolysis only yields 2 molecules of ATP instead of 36 molecules of ATP obtainable in the citric acid cycle (Vander Heiden et al. 2009). This apparent waste of resources raises the question of the utility of aerobic glycolysis in the presence of oxygen. One explanation is that the needs of rapidly dividing cells exceed the mere need for ATP. Prior to cell division, lipids, amino-acids and nucleotides have to be generated which requires acetyl-coenzyme A (Acetyl-CoA) and nicotinamide adenine dinucleotide phosphate hydrogen (NAD(P)H) on top of ATP (Vander Heiden et al. 2009). Glycolysis results in a stable NADH production enabling proliferation.
This may be one of the reasons why GBM cells engage mostly in aerobic glycolysis (DeBerardinis et al. 2007). Another reason might be that brain tumors are very well supplied with nutrients, thus not being at a selective advantage when producing ATP most efficiently (by channeling glucose towards the citric acid cycle), but rather when multiplying most efficiently (by building bio mass) (Vander Heiden et al. 2009). Due to increased lactate production, the extracellular compartment acidifies. This acidification promotes migration and invasion of tumor cells (Stock et al. 2009). Thus, an altered tumor cell metabolism may sustain invasiveness through creating a more acidic extracellular environment. Glucose withdrawal, on the other hand, resembles growth factor withdrawal as both result in increased apoptosis (Vander Heiden et al. 2001). While 70 to 80% of GBM cells' ATP stems from glycolysis (Sesen et al. 2015), BTICs rely more on oxidative phosphorylation for ATP production indicating that BTICs differ not only genetically and functionally, but also metabolically (Janiszewska et al. 2012). Thus, GBM metabolism needs to be targeted in more than one way (Kim et al. 2016, Sesen et al. 2015).
Lastly, growth factor signaling and enzyme levels in the tumor environment are crucial
factors for proliferation and invasion of GBM cells. Marcus et al. (2010) investigated the
levels of growth factors and certain enzymes such as proteases in brain tissue immediately
after resection of GBM in human patients. They found interleukin 8 (IL-8), a pro-angiogenic
cytokine, to be significantly elevated, hinting at the important role of angiogenesis in GBM
progression. Additionally, the metalloproteinase 2 (MMP2) to tissue inhibitor of
10
metalloproteinase 1 (TIMP-1) ratio was found to be elevated. Thus, MMP2's net activity, enabling tumor cells to migrate through the extracellular matrix, was increased. Overall, a great variety of growth factors, enzymes and metabolic changes seems to be responsible for GBM's aggressive proliferation, migration, angiogenesis and recurrence. Many researchers have described elevated levels of TGF-β
2in GBM (Bruna et al. 2007, Aigner and Bogdahn 2008, Hau et al. 2011, Frei et al. 2015). Therefore, the present work will focus on the effects of metformin and TGF-β
2on two key properties of GBM cells, proliferation and migration.
3.2 The role of metformin in diabetes and glioblastoma
One of the agents influencing metabolism in general and tumor cell metabolism in particular is the anti-diabetic drug metformin. Metformin (N',N'-dimethylbiguanide), is the most commonly prescribed oral anti-diabetic drug to treat type 2 diabetes (T2D) (Kourelis and Siegel 2011). As metformin effectively lowers blood glucose levels and additionally diminishes vascular complications and mortality, it is considered first line medication for treatment of obese T2D patients in Germany (German National Guideline on treatment of T2D 2013). Side effects such as weight gain or hypoglycemia are only rarely observed.
However, low glomerular filtration rates increase the risk for lactate acidosis (German National Guideline on treatment of T2D 2013).
At a pH of 7.4, as usually found in intra- and extracellular compartments, metformin exists in its cationic form that is unable to penetrate membranes. Thus, its cellular uptake depends on the presence of organic cation transporters, namely OCT1, 2 and 3 (Shu et al. 2007). If OCTs are absent in a certain tissue or morphologically different due to polymorphisms or genetic aberrations, metformin's action is impeded (Shu et al. 2007). In hepatocytes, metformin's blood glucose reducing action is ascribed to its anti-gluconeogenic effects.
Viollet et al. (2012) propose that metformin decreases gluconeogenesis by impairing
complex I of the mitochondrial respiratory chain. Subsequently, two different signaling
pathways result in lowered gluconeogenesis. Firstly, diminished ATP levels inhibit key
gluconeogenic enzymes such as fructose-1,6-bisphosphatase. Secondly, decreased ATP
and increased AMP levels activate AMP-activated protein kinase (AMPK). When AMP binds
to the γ-catalytic subunit of AMPK, its activator, liver kinase B1 (LKB1) can bind more easily
and activate AMPK (Hardie 2006). AMPK-activation inhibits transcription of various genes
leading to lower levels of gluconeogenic and lipogenic enzymes. Hence, hepatocytes
conserve energy when AMPK is activated and less glucose and fatty acids are being
released into the blood stream preventing microvascular damage (Viollet et al. 2012).
11
Apart from metformin's beneficial effects on blood glucose levels and blood vessels, epidemiological studies suggest that patients who are being treated with metformin are at a lower risk of developing cancer (Evans et al. 2005). These findings sparked an unprecedented interest in metformin as an anti-cancer drug. An epidemiological study on type 2 diabetes and GBM reveals that patients suffering from type 2 diabetes and GBM have a better outcome when taking metformin compared to all other anti-diabetic medications (Welch and Grommes 2013, Elmaci and Altinoz 2016), a result supported by Adeberg et al.
(2015) who also found that metformin treatment prolongs survival of diabetic GBM patients.
In vitro studies have been performed including breast, lung, pancreatic, colorectal, ovarian and brain tumors and they have shown that metformin is able to lower tumor cell proliferation; either when being administered as a single agent or in combination with other cytoreductive agents (Würth et al. 2014). As metformin penetrates the blood-brain-barrier (Labuzek et al. 2010), it may unfold anti-tumerogenic action in glioma. Studies investigating the functional effects of metformin on glioma are outlined in Table 2.
Table 2: Functional effects of metformin on glioma cells Study Cell
lines
Media Effects of metformin
Beckner et al.
2005
U87MG LN229
MEM eagle / α-MEM + 10% FCS
inhibits migration in cells in which mitochondria were blocked with NaN
3Isakovic et al.
2007
C6 (rat);
U251 (h)
Hepes (20 mM)- buffered RPMI1640 + 5% FCS + 10 mM glc.
no proliferation inhibition in primary astrocytes
4 mM induces morphological changes either to more spindle like shape or to granular shape
cell cycle arrest in non-confluent cells
4 mM reduces viability through caspase-mediated apoptosis in confluent cells
Sato et al. 2012
dnf dnf
1 mM reduces sphere formation
1 mM induces differentiation (astrocyte marker GFAP and neural marker βIII-tubulin)
500 mg/kg/day i.p. for 5 days delays tumor formation in transplanted mice
Ferla et al. 2012
LN18, LN229
Low-glc.
DMEM + 5%
FCS
2-16 mM reduce proliferation in a dose-dependent manner
2-16 mM decrease migration
Würth
GBM DMEM- no effects on human stem cells from the umbilical chord
12 et al.
2013
1-4 F12/Neurob asal (1:1) + 10 ng/ml bFGF + 20 ng/ml EGF
effects on TICs > differentiated cells
5-50 mM decrease viability, proliferation, and sphere formation
Gao et al. 2013
U251 DMEM +
10% FCS
10 and 30mM decrease viability
0.3-3 mM inhibit migration in a dose-dependent manner Liu et
al. 2014
T98G, A172, U87
DMEM + 10% FCS
10 mM reduces proliferation (cytostatic effect)
Sesen et al.
2015
U87, LN18, U251, SF767
DMEM + 10% FCS
10 mM decreases proliferation
in PTEN wildtype cells, proliferation decreases after 48 h, in PTEN mutated cells after 96 h
Timeline of death: cell cycle arrest --> death -->
autophagy
o
12 h: earliest time point for cell cycle arrest in G
1and transition into G
0-phase
o
24 h: beginning cell death as a consequence of cell cycle arrest
o
48 h: consistent observation of cell death -->
autophagy
300 mg/kg/day for 30 days reduces tumor volume and tumor weight in transplanted mice
Kim et al. 2016
TS1320 TS1588 TS0903 GSC11 U87
DMEM/ F-12 + 10% FCS
5 mM metformin reduces proliferation in 1/5, enhances proliferation in 1/5 and leaves proliferation unaffected in 3/5 cell lines.
15 mM inhibits sphere formation, a key factor of stemness
decreases stemness markers to some degree in 3/5 lines
5 mM / 15 mM metformin do not decrease migration
Abbreviations: MEM = Minimal essential media; FCS = Fetal calf serum; RPMI1640 = cell media developed at the Roswell Park Memorial Institute (USA); TIC = tumor initiating cell; dnf = data not found; GFAP = glial fibrillary acidic protein (astrocyte marker); glc. = glucose; i.p. = intraperitoneal administration; DMEM = Dulbecco’s modified Eagle’s medium; bFGF = basic fibroblast growth factor; EGF = epidermal growth factor; PTEN = Phosphatase and tensin homolog.
Much research has been undertaken to investigate the mechanisms of metformin's actions
on non-tumor and on tumor cells. The most important pathways, which have been identified
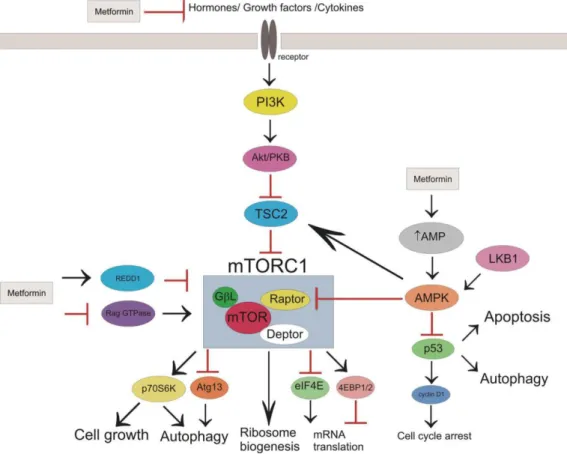
in various tumor tissues, are displayed in Figure 1.
13
Figure 1: Potential mechanisms and sites of metformin’s action in cancer cells (Republished from Kasznicki et al. 2014: "Metformin in cancer prevention and therapy." The Annals of translational medicine 2014, 2 (6): 57, © 2014. Republished with author's permission and permission of the editor of The Annals of Translational Medicine, Sept. 2016) Abbreviations: PI3K= phosphoinositide 3-kinase; Akt= refers to a mouse named "Ak", expressing spontaneous lymphomas and thymoma and Akt= PKB= protein kinase B; TSC2=
tuberous sclerosis complex protein 2; mTORC1= mammalian target of rapamycin complex 1; raptor= regulatory associated protein of mTOR; GβL= G protein beta subunit-like; deptor= DEP domain-containing mTOR-interacting protein; REDD1= regulated in development and DNA damage responses 1; RAG GTPase= Ras-related GTPase;
AMP= adenosine monophosphate; AMPK= AMP-activated protein kinase; LKB1= liver kinase 1; p53= protein 53;
p70S6K= ribosomal protein S6 kinase; Atg13= autophy-related protein 13; eIF4E= eukaryotic translation initiation factor 4E; 4EBP1= eIF4E binding ptotein.
Some of the functional effects of metformin that are listed in Table 2, such as decreased
proliferation via cell cycle arrest, apoptosis and viability reduction can be explained on a
molecular level. To begin with, some effects of metformin on cancer cells seem similar to
those on hepatocytes. Hence, AMPK is activated through the inhibition of complex I of the
mitochondrial respiratory chain (Viollet et al. 2012). Generally, AMPK activation returns a cell
to energy safe mode, thus impairing the energy consuming process of self-replication. In
order to self-replicate, cancer cells need to produce amongst others fatty acids, proteins and
nucleotides. AMPK mediates these biosynthetic processes via several pathways. On the one
hand, AMPK inhibits acetyl-CoA carboxylase (ACC), an enzyme involved in fatty acid
synthesis, thus reducing lipid production (Viollet et al. 2012). On the other hand, it has been
proposed by several authors that p53 and Cyclin D1 are mediated by AMPK and result in cell
cycle arrest and apoptosis (Kasznicki et al. 2014, Würth et al 2014). In addition, metformin
inhibits mammalian target of rapamycin (mTOR) signaling that regulates cell growth and
14
proliferation. According to Viollet et al. (2012) and Kasznicki et al. (2014), four pathways lead to the inhibition of mTOR by metformin. To begin with, AMPK phosphorylates tuberous sclerosis 2 (TSC2) which then inhibits mTOR. Secondly, AMPK impairs the association of mTOR and its regulatory associated protein (raptor) by phosphorylating raptor. Thirdly, AMPK-independent mechanisms of mTOR inhibition have been proposed such as metformin's potential to modulate a Ras-related GTPase (RAG GTPase), which subsequently leads to the inhibition of mTOR or, independently, metformin’s ability to activate “regulated in development and DNA damage responses 1” (Redd1) which also entails mTOR inhibition. Last but not least, metformin can modulate the PI3K/Akt axis.
Normally, insulin, insulin-like growth factor (IGF) and other growth factors bind to corresponding receptors and trigger a signal transduction cascade. Phosphoinositide 3-kinase (PI3K) catalyzes the reaction from phosphatidylinositol-4,5-bisphosphate (PIP2) to phosphatidylinositol-3,4,5-triphosphate (PIP3). PIP3 binds to Akt and facilitates its activation by kinases such as the mTOR complex 2. Once activated, Akt inhibits tuberous sclerosis complex 2 (TSC2) thus enabling the activation of mTOR. mTOR in turn up-regulates lipogenesis, glucose uptake, protein synthesis and inhibits autophagy (Schultze et al. 2012).
This cascade is impaired by metformin at different levels. First and foremost, metformin lowers circulating insulin levels and consequently, IGF-levels also. As these substrates bind to their receptors less frequently, mTOR activation is being reduced. On the other hand, metformin can activate TSC2 via the AMPK-pathway resulting in mTOR inhibition. As mTOR regulates proliferation, inhibiting mTOR has an anti-proliferative effect, which constitutes of several aspects (Kasznicki et al. 2014, Würth et al. 2014). Cell growth is impaired, because p70S6K, normally in charge of phosphorylating the ribosome protein S6K, is not activated anymore. Autophagy is induced due to lack of p70S6K activation and lack of inhibition of autophagy-related protein 13 (Atg13). Protein synthesis is decreased as mRNA translation is diminished by decreased inhibition of eukaryotic translation initiation factor 4E (eIF4E) and by decreased activation of eIF4E-binding protein 1 (4E-BP1). The mechanisms of metformin's anti-cancer properties mentioned above have been elucidated using different tissues derived from breast, colon and prostate cancer, et cetera.
Regarding metformin's molecular mechanisms on glioma, researchers mostly agree that either by Akt inhibition or AMPK activation, mTOR signaling is being inhibited which leads to decreased proliferation (Isakovic et al. 2007, Ferla et al. 2012, Sato et al. 2012, Würth et al.
2013, Sesen et al. 2015, Yu et al. 2015). Metformin partially inhibits complex I of the
respiratory chain in mitochondria thus leading to AMPK activation or Redd 1 / DDIT4
activation (DNA damage-inducible transcript 4 protein) and thus mTOR inhibition (Sesen et
al. 2015). AMPK activation through metformin may also activate c-Jun N-terminal kinase
(JNK) and lead to production of reactive oxygen species (ROS) (Isakovic et al. 2007) or
15
cause STAT3 downregulation and Akt inhibition (Ferla et al. 2012). Also, both Akt inhibition and AMPK activation can lead to FOXO3 activation, a trigger for differentiation of BTICs (Sato et al. 2012). Metformin may as well decrease migration through fibulin-3 downregulation and consequent MMP2 downregulation (Gao et al. 2013). These common notions are challenged by Würth et al. (2013) who state that Akt inhibition rather than AMPK activation leads to mTOR inhibition and by Liu et al. (2014) who report that no AMPK signaling is needed for mTOR inhibition but rather an association of PRAS40 and RAPTOR (Proline-rich Akt substrate of 40 kDa; Regulatory-associated protein of mTOR). Kim et al.
(2016) observe neither AMPK activation nor mTOR inhibition while Gritti and Würth et al.
(2014) report a completely independent mechanism of metformin's action: it blocks a chloride ion channel (CLIC1) in its open state thus trapping cells in G1 phase and lowering proliferation. Even though metformin's molecular mechanisms seem manifold, its main signaling axis seems to be AMPK activiation or Akt inhibition leading to mTOR inhibition.
Metformin seems to selectively affect brain tumor initiating cells more than differentiated tumor cells and this to a greater extent than astrocytes or human stem cells (Isakovic et al.
2007; Würth et al. 2013, Gritti et al. 2014). Accordingly, Würth et al. (2013) demonstrated that metformin's anti-proliferative effects are more pronounced in CD133
+cells, making metformin an ideal drug to target cancer initiating cells, which are claimed to be responsible for GBM recurrence.
Several studies exist exploring the in vitro possibilities of metformin as a combination partner for other anti-glioma treatments. While Aldea et al. (2014) found metformin by itself unable to reduce glioma proliferation, its combination with sorafenib, a RAF inhibitor, attains high apoptotic rates. Kim et al. (2016) propose targeting more than one metabolic pathway by blocking oxidative phosphorylation (OXPHOS) using metformin and glycolysis using 2-desoxy-glucose (2DG). This combination is able to reduce cell viability, sphere formation, expression of stemness makers and invasion in vitro and prolongs survival in tumor bearing mice. Sesen et al. (2015) investigated the effects of combining metformin with TMZ and / or irradiation and found the combination of the three most effective in inducing cell death.
Soritau et al. (2011) and Yu et al. (2015) also found that the combination of TMZ and metformin is more effective in reducing GBM proliferation in vitro (Soritau et al.) and in tumor bearing mice (Yu et al.) than each agent by itself.
According to Würth et al. (2013), the IC
50for metformin, indicating a 50% proliferation
inhibition in vitro, is at 10 mM. Below 10 mM, metformin's action is cytostatic, because cell
growth recovers after metformin withdrawal. At concentrations higher than 10 mM, however,
metformin's effects are cytotoxic and at 50 mM, cells do not recover growth after removal of
the drug (Isakovic et al. 2007; Würth et al. 2013). Therefore, 10 mM metformin was used as
16
highest dose for this study. Yet, clinically observed concentrations are lower than those used in vitro. Generally, concentrations of metformin can be discussed as plasma concentration and tissue concentration. Plasma concentrations in diabetic patients with oral treatment usually range from 8 to 31 µM and even at maximum oral treatment dosage rarely exceed 39 µM (Menendez et al. 2014). In acute overdosing, concentrations as high as 300-800 µM were observed and doses between 600-1500 µM were considered fatalities; however, lethal doses have not been clearly defined (Menendez et al. 2014).
At present, clinical trials mainly investigate the oral route of metformin application. There are two studies on metformin use in glioblastoma patients (NCT01430351, NCT02780024 on www.clinicaltrials.gov; Nov. 2016). In the first study, 1000 mg metformin twice a day and 150 m/m
2TMZ are combined for post-radiation treatment. The other study investigates the effects of re-irradiation, metformin and a low carbon diet on recurrent GBM but does not provide information on metformin doses. Two other studies also include lower-grade glioma patients (NCT02149459, NCT02496741 on www.clinicaltrials.gov; Nov. 2016). One study (NCT02149459) combines temozolomide and metformin as treatment before and after radiation therapy for grade 2-4 glioma and the other study (NCT02496741) is a dose-finding study for metformin and chloroquin to treat IDH1/2-mutated solid tumors.
Taking into account current research on metformin's role in GBM, several aspects have not been investigated so far. Firstly, the concentrations of metformin used in GBM experiments were higher than what seems achievable in the human brain tissue raising the question whether lower doses of metformin are effective in lowering proliferation and migration of GBM cells as well. Secondly, the effects of metformin on GBM were mainly explored in one to five cell lines (see Table 2), possibly resulting in bias due to a low case number. And thirdly, the exact molecular mechanisms of metformin's action in GBM are not fully understood to this date especially concerning possible interactions with growth factors such as TGF-β
2.
3.3 The role of TGF-β
2in glioblastoma
Transforming growth factor beta 2 (TGF-β
2) is a cytokine involved in complex regulations of
proliferation, differentiation and the immune response. In healthy tissues, TGF-β controls
proliferation; in cancer however, this control is lost and TGF-β becomes oncogenic (Bruna et
al. 2007). This phenomenon is called the TGF-β paradox and has been explored in different
cancerous tissues (Tian et al. 2009). In GBM, TGF-β promotes cell growth, migration,
invasion, angiogenesis and immunosuppression (Platten et al. 2001, Hau et al. 2006, Joseph
et al. 2014).
17
TGF-β belongs to the TGF-β superfamily which also encompasses other proteins such as bone morphogenic protein (BMP), nodal, activin and inhibin (Aigner and Bogdahn 2008).
Three isoforms of TGF-β exist in humans: TGF-β
1, TGF-β
2, and TGF-β
3. All of them are found in GBM, but levels vary. Some researchers have found TGF-β
2levels to be the highest in glioma (Bodmer et al. 1989, Kjellman et al. 2000, Leitlein et al. 2001), while Frei et al.
(2015) found mRNA of TGF-β
1to be highest. Nonetheless, researchers agree that TGF-β
2plays an important role in GBM (Bruna et al. 2007, Aigner and Bogdahn 2008, Hau et al.
2011, Frei et al. 2015).
Figure 2: Smad-dependent TGF-β signaling (Aigner and Bogdahn 2008. Republished with author's permission and permission from Springer from "TGF-beta in neural stem cells and in tumors of the central nervous system." Cell and tissue research 2008 (1): 225–241, © 2008. Permission conveyed through Copyright Clearance Center, Sept. 2016). Abbreviations: TGF-beta = transforming growth factor beta; TGFRI and II = TGF- receptor type I and II; R-Smad = regulatory small body size mother of decapentaplegic; ATP = adenosine triphosphate; ADP = adenosine diphoshate; Co-smad = smad4; DNA = deoxyribonucleic acid.
TGF-β proteins are homodimers of 12.5 kD that bind to specific receptor serine/threonine kinases, the TGF-β receptors type I and type II (TGFR-I and II). Seven isoforms have been identified for receptor type I and five for receptor type II (Aigner and Bogdahn 2008, Massagué 2008). After binding the ligand, two TGFR-II units associate with two TGFR-I units to form a complex. A third receptor type, also known as betaglycan, increases the affinity of TGFR-II for TGF-β
2in GBM (Aigner and Bogdahn 2008). Other membrane proteins such as EMP3 (epithelial membrane protein 3) may increase TGF-β signaling in CD44
+mesenchymal GBM cells (Jun et al. 2016). In the receptor complex, TGFR-II activates TGFR-I by phosphorylation and TGFR-I subsequently phosphorylates Smad2 and 3 (small body size mothers against decapentaplegic) (Massagué 2000, Massagué 2008, Dong et al. 2015).
Smad2 and 3 are receptor substrate smads (Rsmads). Upon activation, they associate with
18
co-smads (Smad4) and translocate into the nucleus. There, several other DNA-binding cofactors associate with the complex before it binds to specific gene regions. Depending on the type of cell and its environment, different cofactors are present which determine genes and groups of genes targeted by TGF-β signaling. Thus, TGF-β's effects are highly context- dependent and promote or inhibit the expression of a great variety of genes (Massagué 2008). In GBM, several Smads have been identified to play a leading role, namely Smad2 and Smad3. However, there is no clear evidence to date, which one is more important in GBM. In 2007, Bruna et al. found mRNA of smad2 to be highly expressed in GBM while Kjellman et al. (2000) found mRNA of smad2, smad3 and smad4 decreased in GBM specimens.
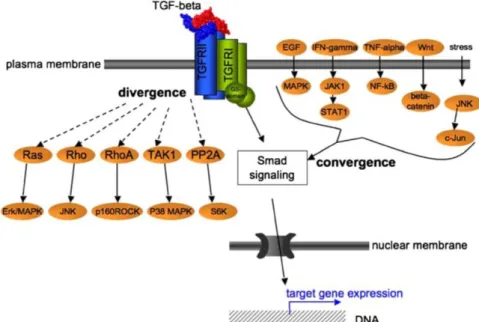
Figure 3: Signaling pathways diverging from and converging on TGF-β signaling (Aigner and Bogdahn 2008. Republished with author's permission and permission from Springer from " TGF-beta in neural stem cells and in tumors of the central nervous system." Cell and tissue research 2008 (1): 225–241, © 2008.
Permission conveyed through Copyright Clearance Center, Sept. 2016). Abbreviations: TGF-beta = transforming growth factor beta; TGFRI and II = TGF-receptor type I and II; EGF = epidermal growth factor; IFN- gamma = interferon gamma; TNF-alpha = tumor necrosis factor alpha; Wht = data not found; MAPK = mitogen- activated kinase also known as Ras-Raf-MEK-ERK pathway; JAK1 = Janus kinase 1; NF-kappaB = nuclear factor kappa-light-chain-enhancer of activated B cells; JNK = c-Jun N-terminal kinase; STAT1 = Signal transducer and activator of transcription 1; c-Jun = p39 = Jun Proto-Oncogene; Ras, Rho, RhoA = small GTPaseses of the Ras superfamiliy; TAK1 = TGF-β activated kinase 1; PP2A = protein phosphatase 2; Smad = small body size mother of decapentaplegic; ERK = extracellular signal-regulated kinase = nowadays known as MAPK; MAPK = mitogen- activated kinase also known as Ras-Raf-MEK-ERK pathway; JNK = c-Jun N-terminal kinase; p160ROCK = a serine/threonine protein kinase; S6K = Ribosomal protein S6 kinase; DNA = deoxyribonucleic acid.