Molecular mechanism of early metastatic breast cancer
dissemination
Dissertation
zur Erlangung des Doktorgrades der Naturwissenschaften (Dr. rer. nat.) der Fakultät für Biologie und Vorklinische Medizin der
Universität Regensburg
vorgelegt von
Hedayatollah Hosseini
aus Ahwaz, Iran 2016
2
Das Promotionsgesuch wurde eingereicht am 14.Dec. 2016
Die Arbeit wurde angeleitet von Herr Prof. Dr. Christoph A. Klein Untershrift:
3
Contents
1 Introduction ... 7
1.1 Metastasis ... 7
1.2 Local invasion and migration ... 8
1.3 Cancer stem cells in metastasis ... 9
1.4 Mammary gland development and breast cancer ... 10
1.5 Early versus late dissemination of cancer cells... 14
1.6 Balb-NeuT as a mouse model for early dissemination ... 15
1.7 Aim of work ... 17
2 Materials and Methods ... 19
2.1 Methods ... 19
2.1.1 Animal Experiments ... 19
2.1.2 Laser Microdissection and microarray analysis ... 21
2.1.3 Cell culture experiments ... 22
2.1.4 Differentiation of mammosphere cells ... 25
2.1.5 Migration/Invasion assays ... 25
2.1.6 Proliferation assay ... 27
2.1.7 Staining ... 27
2.1.8 PCR ... 29
2.1.9 Viral transduction ... 30
2.1.1 Western blot analysis ... 33
2.1.10 miRNA analyses and sequencing ... 35
2.1.11 Analysis of Breast Cancer Patients: ... 36
2.1.12 Bioinformatic and Statistical analysis ... 36
2.2 Materials ... 37
2.2.1 Reagent ... 37
2.2.2 Consumable ... 39
2.2.3 Kits ... 40
2.2.4 Devices ... 40
2.2.5 Primers ... 42
2.2.6 Antibodies ... 43
2.2.7 miRNAs ... 43
2.2.8 Cell lines ... 44
2.1.2 Special cell culturing media ... 46
2.2 Abbreviation ... 47
3 Results ... 49
3.1 Cancer cell dissemination starts at early stages in Balb-NeuT model ... 49
3.2 Progesterone and Her2 signaling regulate gene expression program of early lesions ... 51
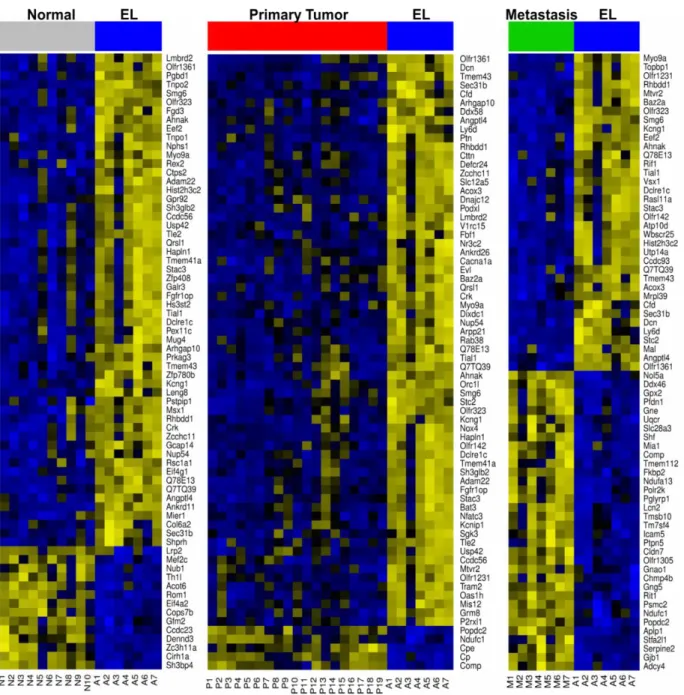
3.2.1 Gene expression analyses revealed an exclusive expression profile for early lesions ... 51
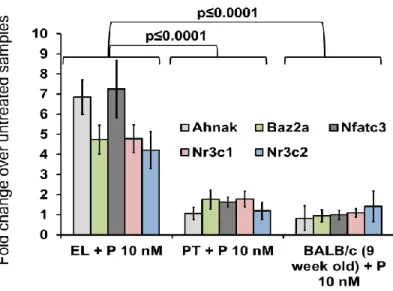
3.2.2 Progesterone as regulator of EL gene expression profile ... 56
3.2.3 Her2 and progesterone cooperate to generate EL signature ... 59
3.3 Progesterone signaling regulates the migration program in EL and is linked to side branching and morphogenesis ... 61
3.3.1 Role of Progesterone in side branching and morphogenesis ... 61
3.3.2 Progesterone and its paracrine factors regulate in vitro migration of PT and EL cells ... 63
3.4 Progesterone signaling regulates migration, stemness, and proliferation of cancer cells ... 64
4
3.4.1 Higher sphere formation ability of young mammary epithelial cells ... 64
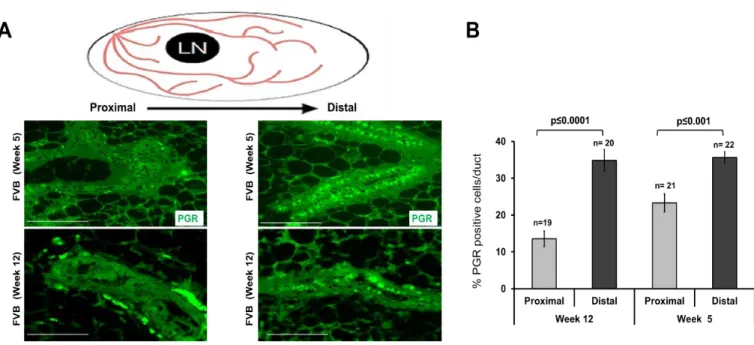
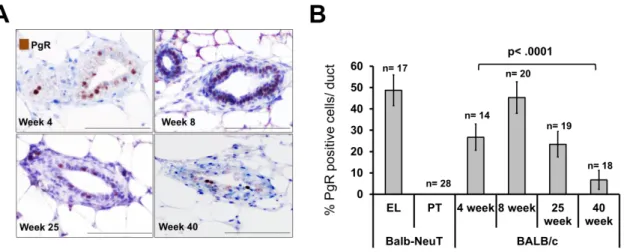
3.4.2 Higher expression of PgR in young mammary glands ... 65
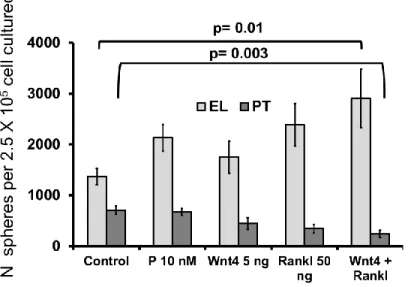
3.4.3 Progesterone-induced paracrine factors regulate stemness of PT and EL cells ... 66
3.4.4 Stemness feature of migrating cells ... 67
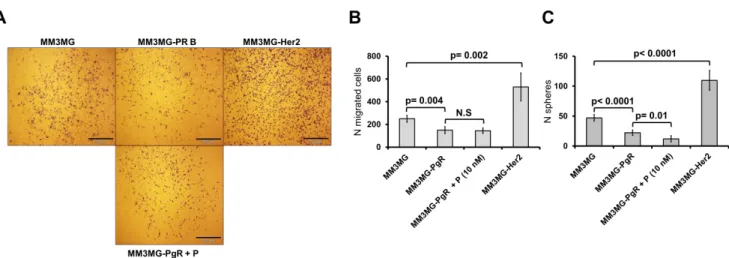
3.5 Her2 expression levels determine migratory vs. proliferative cellular responses ... 68
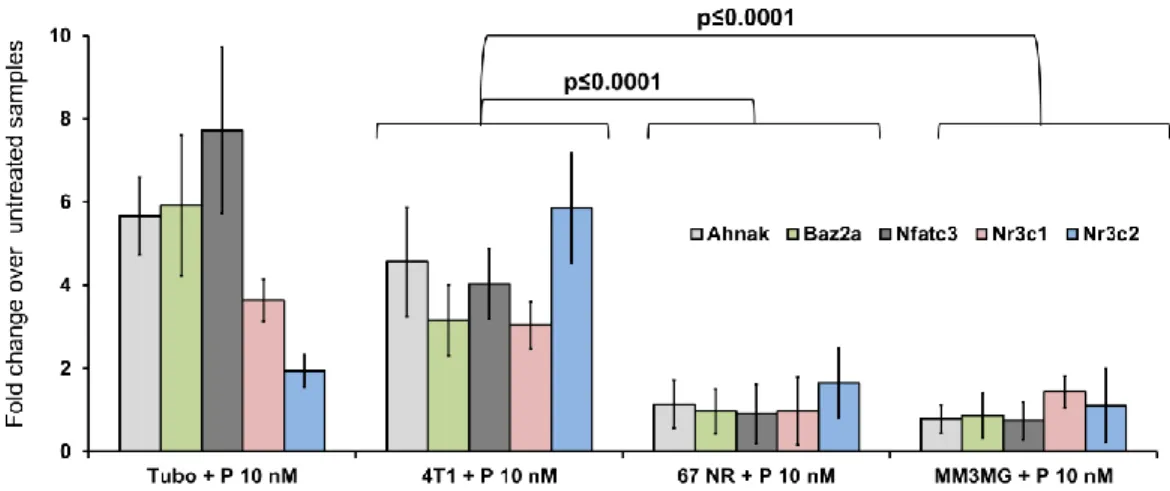
3.5.1 Progesterone-induced paracrine factors act as inducer of stemness and migration for EL-like cells and supressor for PT-like cells ... 68
3.5.2 Her2 expression level defines types of responses to the progestrone signaling ... 71
3.5.3 Her2 and PgR expression in the migratory cells ... 72
3.6 In vivo support for the identified mechanism ... 74
3.6.1 Proliferation and metastasis properties of PT and EL ... 74
3.6.2 Proliferation and metastasis traits are constant phenotypes over the time ... 76
3.6.3 Higher metastatic property of EL cells comes from higher dissemination ... 77
3.7 PgR is the distinticive environmantal factor in regulation of dissemination ... 78
3.7.1 Impact of mammary gland environment on dissemination of PT and EL cells ... 78
3.7.2 PgR expression changes dissemination behaviour of cancer cells ... 81
3.7.3 Pregnancy induces migration of EL and proliferation of PT cells ... 82
3.8 Cell density regulates proliferation and dissemination phenotypes ... 83
3.8.1 PgR expression in PT cells regulated by cell density ... 83
3.8.2 PT cells regulate PgR expression via miRNAs ... 86
3.8.3 miR9-5p and miR30a-5P regulate PgR expression in PTs of Balb-NeuT ... 86
3.8.4 Cell density regulates phenotypic characteristics of cancer cells ... 88
3.8.5 Human cell line model ... 90
3.9 Human samples and patient data analyses ... 94
3.9.1 Her2 and PgR expression in primary tumors are correlated to cancer cell dissemination ... 94
3.9.2 New subtype of human breast cancer with caractarastics like EL of Balb-NeuT ... 96
3.9.3 miR9-5p and 30a-5p are upregulated in Her2high/PgRneg ... 97
3.9.4 Human DCCs do not express hormone receptors ... 99
3.10 Summary of numbers and type of replications ... 99
4 Discussion ... 102
4.1 Mechanisms of early metastatic dissemination... 102
4.1.1 A transient cooperation of progesterone and Her2 signaling in early mammary lesions of Balb-NeuT mice 102 4.1.2 A branching morphogenesis program is recruited for migration and dissemination of cancer cells from early lesions ... 103
4.1.3 Expression of Her2 regulates the switch from migration to proliferation ... 104
4.1.4 Migration and stemness are concomitant phenotypes ... 105
4.1.5 Loss of PgR and strong expression of Her2 marks the switch from migration to proliferation ... 107
4.1.6 Early and late lesions of Balb-NeuT represent different subtypes of breast cancer ... 108
4.2 Potential relevance for human breast cancer ... 108
4.2.1 Progesterone mechanisms in tumor growth and dissemination can explain pregnancy-associated breast cancers... 108
4.2.2 Risk of breast cancer is related to PgR expression, age, and subtypes ... 109
4.2.3 Early dissemination can explain CUP syndrome ... 110
4.2.4 Her2-PgR crosstalk in dissemination mechanism and DCC subtypes in patients ... 110
4.2.5 New subtype of breast cancer as the most aggressive group of breast cancer is similar to EL of Balb- NeuT 111 4.3 Significance and conclusion ... 111
5 Summary ... 113
5
6 Bibliography ... 115
7 Supplementary Data ... 123
7.1 Supplementary data1 ... 123
7.2 Supplementary data 2 ... 133
7.2.1 miRNAs upregulated in TUBO... 133
7.2.2 miRNAs upregulated in exosomes of TUBO ... 136
7.2.3 miRNAs upregulated in exosomes free supernatant ... 138
7.2.4 miRNAs upregulated in MM3MG v.s MM3MG-Her2 ... 140
7.3 Supplementary data3 ... 143
7.3.1 Source data for Figure 13 ... 143
7.3.2 Source data for Figure 15 ... 144
7.3.3 Source data for Figure 16 ... 145
7.3.4 Source data for Figure 17 ... 145
7.3.5 Source data for Figure 18 ... 147
7.3.6 Source data for Figure 20 ... 147
7.3.7 Source data for Figure 22A ... 148
7.3.8 Source data for Figure 22B ... 149
7.3.9 Source data for Figure 23B ... 150
7.3.10 Source data for Figure 24B ... 151
7.3.11 Source data for Figure 24D ... 151
7.3.12 Source data for Figure 25A ... 152
7.3.13 Source data for Figure 26B ... 153
7.3.14 Source data for Figure 27 ... 154
7.3.15 Source data for Figure 28c ... 154
7.3.16 Source data for Figure 29B ... 155
7.3.17 Source data for Figure 29C ... 155
7.3.18 Source data for Figure 30B ... 156
7.3.19 Source data for Figure 30C ... 156
7.3.20 Source data for Figure 30E ... 156
7.3.21 Source data for Figure 30F ... 157
7.3.22 Source data for Figure 31 ... 158
7.3.23 Source data for Figure 32A ... 158
7.3.24 Source data for Figure 32B ... 159
7.3.25 Source data for Figure 33B ... 160
7.3.26 Source data for Figure 36A ... 161
7.3.27 Source data for Figure 36B ... 165
7.3.28 Source data for Figure 36D ... 169
7.3.29 Source data for Figure 37A ... 169
7.3.30 Source data for Figure 37B ... 172
7.3.31 Source data for Figure 37c ... 172
7.3.32 Source data for Figure 38A ... 176
7.3.33 Source data for Figure 38 ... 176
7.3.34 Source data for Figure 38C ... 177
7.3.35 Source data for Figure 39A ... 178
7.3.36 Source data for Figure 39B ... 178
7.3.37 Source data for Figure 41A ... 179
7.3.38 Source data for Figure 42A ... 179
7.3.39 Source data for Figure 42B ... 179
7.3.40 Source data for Figure 43A ... 180
7.3.41 Source data for Figure 43C ... 180
7.3.42 Source data for Figure 47A ... 180
7.3.43 Source data for Figure 47B ... 181
7.3.44 Source data for Figure 47C ... 181
7.3.45 Source data for Figure 49A ... 181
7.3.46 Source data for Figure 50A ... 182
6
7.3.47 Source data for Figure 50B ... 182
7.3.48 Source data for Figure 51 ... 183
7.3.49 Source data for Figure 52A ... 184
7.3.50 Source data for Figure 52B ... 184
7.3.51 Source data for Figure 53A ... 185
7.3.52 Source data for Figure 53B ... 186
7.3.53 Source data for Figure 54A ... 187
7.3.54 Source data for Figure 54B ... 188
7.3.55 Source data for Figure 55 ... 189
7.3.56 Source data for Figure 57A ... 191
7.3.57 Source data for Figure 57B ... 191
7.3.58 Source data for Figure 58 ... 191
7.3.59 Source data for Figure 60 ... 192
7.4 Supplementary data4 ... 193
7.4.1 Source blotting figure 21A ... 193
7.4.2 Source blotting figure 21B ... 194
7.4.3 Source blotting figure 21C ... 194
7.4.4 Source blotting figure 21D ... 195
7.4.5 Source blotting figure 21E ... 195
7.4.6 Source blotting figure 33A ... 196
7.4.7 Source blotting figure 46B ... 196
7.4.8 Source blotting figure 47B ... 196
7.4.9 Source blotting figure 47D ... 197
7.4.10 Source blotting figure 49B ... 197
7.4.11 Source blotting figure 54A ... 198
8 Acknowledgment ... 199
7
1 Introduction
1.1 Metastasis
Metastasis is a multistage process during which malignant cells spread from the primary tumor to distant organs (Récamier, 1829; Talmadge and Fidler, 2010). Despite significant improvements in diagnosis and therapies, 90% of deaths from cancer are due to metastases that are resistant to conventional therapies (Fidler, 2003; Weigelt et al., 2005). Therefore, there are many gaps in our knowledge about metastasis. Understanding molecular players and processes involved in metastasis should lead to effective, targeted approaches to prevent and treat cancer metastasis.
During last decades many attempts have been allotted to unravel underlying mechanisms of metastasis and only few recent discoveries led to some mechanistic aspects of the process (Hanahan and Weinberg, 2011; Talmadge and Fidler, 2010; Valastyan and Weinberg, 2011). All molecular findings and supporting clinical data suggest a stepwise cascade for carcinoma invasion-metastasis including (1) local invasion of primary tumor cells through surrounding extracellular matrix (ECM) and stromal cell layers, (2) intravasation of cancer cells into the lumen of blood vessels, (3) surviving circulation within the vasculature, (4) arresting at distant organ sites, (5) extravasation into the parenchyma of distant tissues, (6) surviving in distant possible hostile microenvironments, and (7) reinitiating their proliferative programs at metastatic sites, in order to form micrometastases, and followed by generation of macroscopic, clinically detectable neoplastic growths (the step often referred to as ‘‘metastatic colonization’’; Figure 1) (Chaffer and Weinberg, 2011; Fidler, 2003; Valastyan and Weinberg, 2011). Since we are going to investigate mechanisms of dissemination in early and late course of tumour development, local invasion as the first distinctive step comes to the main focus.
8
Figure 1. Cascade of metastasis. Clinically detectable metastases represent the end products of a complex series of cell-biological events, which are collectively termed the invasion-metastasis cascade. During metastatic progression, tumor cells exit their primary sites of growth (local invasion, intravasation), translocate systemically (survival in the circulation, arrest at a distant organ site, extravasation), and adapt to survive and thrive in the foreign microenvironments of distant tissues (micrometastasis formation, metastatic colonization). Carcinoma cells are depicted in red (Valastyan and Weinberg, 2011).
1.2 Local invasion and migration
During local invasion, cancer cells must acquire the ability to migrate and invade which implies an alteration in the genetic programs and phenotypic characteristics of cancer cells. In addition, cancer cells in the primary site are surrounded by a complex microenvironment comprising numerous cells including endothelial cells of the blood and lymphatic circulation, stromal fibroblasts and a variety of bone marrow-derived cells including macrophages, myeloid-derived suppressor cells, different types of monocytes and mesenchymal stem cells (Joyce and Pollard, 2009). It is increasingly apparent that crosstalk between cancer cells and cells of the neoplastic stroma is involved in the acquired capability for invasive growth and metastasis (Egeblad et al., 2010; Qian and Pollard, 2010; Joyce and Pollard, 2009; Kalluri and Zeisberg, 2006). Hence, local invasion on one hand depends on the phenotype and genotype of tumor cells and on the other hand is an outcome of crosstalk between cancer cells and microenvironment (Chiang and Massague, 2008).
Another component of tumor microenvironment is extra-cellular matrix (ECM).
Interaction of ECM with cancer cells plays important role during local invasion and migration of cancer cells. When cancer cells grow at the primary sites, they interact with the adjacent ECM
9 and initiate binding via adhesion molecules (Hynes, 2002). Depending on the cell type and ECM substrate, focal contact assembly and migration can be regulated by different components of ECM such as integrins which connected the ECM to the cytoskeletons of cells (Friedl and Wolf, 2003). Suggesting, depending on the genotype of cells and composition of microenvironment, cancer cells can use different types of migration comprised of amoeboid and mesenchymal migration and in a singular or a multicellular process. Moreover, microinvasion can also happen as a result of protrusion of cells from the proliferative tumor (Friedl and Alexander, 2011).
When epithelial-derived tumors metastasize, the basal membrane is the first barrier that invading cells have to breach into. For breaching through the basal membrane, mechanisms and players all are conserved across species as well as cancer cells (Sherwood, 2006). Maybe the best characterized cell migration and invasion program shared between normal development and cancer is EMT (epithelial to mesenchymal transition) which is also conserved across species. The EMT emerged from abundant observations that demonstrated downregulation of E-cadherin in human carcinomas (Berx and van Roy, 2009), goes along with changes in the expression of genes encoding other cell-to-cell and cell-to-ECM adhesion molecules (Cavallaro and Christofori, 2004). These changes were found to confer abilities to invade, to resist apoptosis, and to disseminate (Hanahan and Weinberg, 2011; Mani et al., 2008; Polyak and Weinberg, 2009). This mechanism is similar to what was originally described for the normal early embryonic development (Micalizzi et al., 2010). Hence, it was not surprising when researchers found that molecular pathways classically associated with EMT, including Snail/Slug, Twist, Six1, Cripto, TGF-β, and Wnt/β-catenin, are highly conserved across species (Micalizzi et al., 2010; Nieto, 2013). Moreover, carcinoma cells that have passed through an EMT show stem-like state. It was speculated that stem cell character is critical in dissemination and launching new colonies of cancer cells in distant site (Chaffer and Weinberg, 2011).
1.3 Cancer stem cells in metastasis
A successful metastasis requires not only a local invasion, but also a property to support cancer cell growth in the primary site and the metastatic niche. Even among heterogeneous tumors only subsets of cells which are known as cancer stem cells (CSCs) support a proliferation hierarchy (Beck and Blanpain, 2013). They are defined as cancer cells able to initiate tumor growth in host
10 organs and differentiate into non-CSC (Clarke and Fuller, 2006; Palmer et al., 2012). The current CSC concept holds that disease relapse and later progression is largely due to the intrinsic therapy resistance of CSC, and. therefore, a successful eradication of cancer is only possible if the applied therapies are able to target CSC (Gupta et al., 2009).
There are several reasons that favor the view that cancer stem cells are the main migratory population in the primary site and the ultimate metastatic cells in the distant site: (1) Metastases of most carcinomas recapitulate the hierarchy and organization of their primary tumours (Brabletz et al., 2005); (2) Cells that have undergone EMT demonstrate CSC-like characteristics (Chaffer and Weinberg, 2011). It has also been shown that CSC spontaneously undergo Mesenchymal-Epithelial Transition (MET) which helps extravasation in the distant sites (Mani et al., 2008); (3) Signaling pathways regulating stemness (e.g. Wnt/β-catenin) are selectively expressed in the migratory front of tumors (Brabletz et al., 2005); (4) Migration of stem cells not only has a pivotal role during embryogenesis, but adult stem cells (also known as tissue stem cells) can also increase their migratory activity when their microenvironment is altered. For example, these cells play a key role in tissue damage repair - tissue injury activates developmental programs by activating adult stem cell migration to the site of damage (Imitola et al., 2004; Scadden, 2006); (5) It has frequently been observed that metastatic cells are carrying stem cell signatures. For example in breast cancer it was shown that there was similarity between gene expression profiles of breast cancer stem cells and the normal mammary stem cells (MaSCs). Interestingly, the stem cell phenotype is dominant in the metastatic lesion and disseminated cancer cells (Balic et al., 2006; Lawson et al., 2009). Therefore, it may be a plausible hypothesis that metastatic cancer cells are stem like cells.
1.4 Mammary gland development and breast cancer
The mammary gland, which distinguishes mammals from all other animals, works as an organ to produce and secrete milk for nourishing offsprings. The full development of this organ happens after birth (Inman et al., 2015). Terminal end buds (TEBs) are the main structures seen at the birth. TEBs are club-shaped structures comprising an outer layer of cap cells and a multilayered inner core of cells called body cells, appear at the tips of the ducts and start to invade the fat pad.
After birth, mammary development is arrested until puberty, when extensive elongation of the
11 ducts and secondary branching takes place. Upon hormonal induction during puberty, proliferation within the TEBs results in ductal elongation and lumen formation. Consequently, TEBs disappear because of the limits of the fat pad space and ceasing of growth (Watson and Khaled, 2008).
The tissue architecture of mammary gland consists of different cell types: epithelial cells that form the ductal network of the gland; adipocytes, which constitute the fat pad and in which the ductal network is embedded; vascular endothelial cells, which make up the blood vessels;
stromal cells, including fibroblasts; and a variety of immune cells. The epithelium in the mammary gland can be divided into two types: luminal and basal. The luminal epithelium forms the ducts and the secretory alveoli, whereas the basal epithelium consists essentially of myoepithelial cells (Sternlicht, 2005). These two types of epithelium form a bi-layered structure of simple epithelium that is embedded within the fatty stroma (Figure 2; (Watson and Khaled, 2008)). Comparative molecular studies of different normal mammary epithelial gene expression signatures and different subtypes of breast cancer have suggested that distinct cells of origin may give rise to the different subtypes (Visvader and Stingl, 2014).
Figure 2. Schematic diagram depicting the salient architectural features of TEBs and their subtending ducts, including their fibroblast-rich stromal collar and high mitotic index. Though there is no evidence that normal ductal cells ever cross the basal lamina, thinning of the basement membrane (dotted lines) does seem to occur at the tips of invading ducts as a result of their partial enzymatic degradation and/or incomplete de novo synthesis. Stromal macrophages and eosinophils are also depicted (Sternlicht, 2005).
12 Extensive lineage tracing studies in mammary gland have been performed to define mammary stem cell (MaSC) population. The latest results suggested that the pubertal gland contains several different stem and progenitor cell populations, including bipotent stem cells that give rise to both the luminal and myoepithelial cells of the duct, or mono potent which give rise to luminal and alveolar cells alone.(Inman et al., 2015). The importance of MaSC became evident when it was seen that the MaSC/basal signature is most closely aligned with the expression profile of more aggressive subtypes of breast cancer (Shehata et al., 2012). Interestingly, mouse MaSCs are ER/PgR negative, and are localized in the basal compartment of mouse mammary epithelium in close proximity of ER/PgR positive mature luminal epithelial cells. It has been suggested that MaSCs need hormone receptor expressing cells for their expansion (Asselin-Labat et al., 2006).
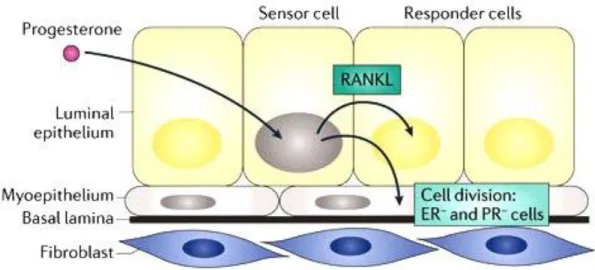
Progesterone, estrogen and their nuclear receptors play essential roles during mammary gland morphogenesis. However, they are differently acting on mammary epithelial cells. While estrogen is mostly responsible for elongation of ducts (Ciarloni et al., 2007), progesterone induces side branching and expansion of epithelial structure into the mammary fat pad (Brisken, 2013). Progesterone induces mouse MaSC proliferation and expansion via RANKL (Figure 3;
(Brisken, 2013; Joshi et al., 2010)). Furthermore, progesterone inhibits tight junction formation and terminal differentiation in mammary epithelial cells. The progressive reduction of PgR expression that occurs during late pregnancy has also been suggested to contribute to the onset of lactation and terminal differentiation of mammary epithelial cells (Ismail et al., 2002). It has been speculated that the impact of progesterone on MaSCs expansion and proliferation targets them for further cell transformation events leading to breast cancer (Joshi et al., 2010). The expansion of the MaSC pool by progesterone has been also suggested as underlying mechanism of the observation that menstrual cycling predisposes to breast cancer (Asselin-Labat et al., 2010).
13
Figure 3. Models of cell-intrinsic and paracrine mechanisms of progesterone induced cell proliferation in the mouse mammary epithelium. A hormone receptor (HR)+ cell is indicated by a grey nucleus. Progesterone induces the expression of receptor activator of nuclear factor-κB (NF‑κB) ligand (RANKL) secretion, which triggers the proliferation of adjacent HR– cells. (Brisken, 2013).
Steroid hormone receptors, PgR (progesterone receptor) and ER-α (estrogen receptor alpha) also serve as markers of breast cancer subtypes. These subtypes were originally identified by gene expression studies, which confirmed the fundamental distinction between hormone receptor positive and negative cancers. Nuclear hormone receptor negative subtypes comprise triple-negative cancer (negative for HER2/ERα/PgR), the basal-like subtype, and cancers with Her2 gene amplification. Nuclear receptor positive subtypes comprise the luminal types which are further divided into luminal A and B (Bombonati and Sgroi, 2011) and form the majority of breast cancers. Luminal A tumours express ERα and/or PgR and differ to luminal B with higher proliferation rate (as frequently assessed by Ki-67 staining) or HER2 expression levels. Patient prognosis differs for various subtypes. Luminal A subtype has an overall good prognosis, and can be treated by hormone therapy. Her2-amplified breast cancers have a poor prognosis and are treated by targeted therapy using trastuzumab or lapatinib. However, no specific therapy is currently available for the other subtypes, although the prognosis of basal and luminal B tumors is poor (Adelaide et al., 2007; Bombonati and Sgroi, 2011; Williams et al., 2009).
Her2 and triple negative breast cancer are enriched with stem-like (May et al., 2011;
Velasco-Velazquez et al., 2011). Consistently, it was shown that expression of Her2 induces stemness in mammary epithelial cells (Ginestier et al., 2007; Korkaya et al., 2008), which is partly mediated via the canonical NF-κB pathway and RANKL (Liu et al., 2010a). RANKL is a direct regulated target gene of progesterone (Brisken, 2013). Moreover, it was shown that
14 progesterone and its receptor modulate Her2 signalling and induce Her2 nuclear translocation (Beguelin et al., 2010). Therefore, progesterone on one hand regulates mammary gland side branching and migration of epithelial cells into the fat pad and on the other hand may regulate stemness in a crosstalk with Her2.
1.5 Early versus late dissemination of cancer cells
Until to date, many functional studies addressing mechanisms of metastasis used cell lines derived from advanced tumours or metastases. This appears to be justified as long as late metastatic dissemination from large tumours is the prevailing concept of metastasis (Fearon and Vogelstein, 1990; Hanahan and Weinberg, 2000). The late dissemination model holds that the majority of aberrations accumulate within the primary tumour before additional genetic hits lead to metastatic spread (Fearon and Vogelstein, 1990; Jones et al., 2008). Though intriguing at first sight this concept is inconsistent with some clinical and experimental observations. For example, it is well known that small tumours can indeed seed metastases and T1 stage (i.e. small) tumours diagnosed with metastasis at primary presentation are not such a rare event in clinical settings.
Since it has been convincingly deduced from large epidemiological and imaging studies of breast cancer that growth of metastases takes several years (Engel et al., 2003), T1M1 (patients already diagnosed with primary tumours and suffering metastasis) stage cancers must have seeded cells when they were composed of less than 105 – 106 tumour cells (Klein and Holzel, 2006). In addition, “cancer of unknown primary”, a condition where metastasis is detected in the absence of a detectable primary tumour, comprises about 5% of all hospitalized cancer patients, and therefore is as frequent as esophageal cancer (Abbruzzese et al., 1994; van de Wouw et al., 2002).
Therefore, cancer cells should have departed the primary lesion very early and before the acquisition of fully malignant phenotypes.
More empirical evidences come from the analysis of DCCs isolated from bone marrow before and after manifestation of metastasis. Genetic data indicated that DCCs from the two stages (M0, without metastasis, and M1, with metastasis) of metastatic spread differ (Klein et al., 2002; Schmidt-Kittler et al., 2003) and it was suggested that they might have disseminated early and evolved in parallel to the primary tumor (Figure 4; (Klein, 2009)). Subsequently, studies in transgenic mouse models (Eyles et al., 2010; Hüsemann et al., 2008; Rhim et al., 2012) and in
15 patients with in-situ carcinomas (Banys et al., 2012; Hüsemann et al., 2008; Sanger et al., 2011) corroborated this concept.
Figure 4. Evolution of malignancy. (Top) The late metastasis model places selection of genetic and epigenetic alterations mostly inside the primary tumor. If so, late-disseminating cells are genetically similar to the primary tumor, which can be used as a surrogate marker to choose a drug against disseminated tumor cells. (Bottom) By contrast, early-disseminated tumor cells accumulate such alterations at distant sites and diverge genetically from the primary tumors. Consequently, they may respond differently to drugs that are administered systemically (Klein, 2008).
1.6 Balb-NeuT as a mouse model for early dissemination
The ERBB2 (also known as HER2) receptor is a tyrosine kinase receptor that belongs to the epidermal growth factor receptor (EGFR) family. The rat homologue of the ERBB2 gene is called the NEU gene and was originally identified from chemically-induced neuroblastomas1 (Schechter et al., 1984). Amplification of ERBB2 has been observed in 20–30% of sporadic human breast cancers and, correlates with poor patient outcome (Slamon et al., 1987; Slamon et al., 1989).
HER2 overexpression and amplification is also seen in subsets of gastric, esophageal, and endometrial cancers and also associated with poor prognosis (Mimura et al., 2005; Morrison et al., 2006; Yano et al., 2006). Moreover, when breast cancer patients with HER2 amplification were treated with trastuzumab (Herceptin), a neutralizing monoclonal ERBB2 antibody, prolonged disease-free survival were observed when compared to control patients (Robert et al., 2006).
After first hints indicated a prominent role of Her2 in breast cancer, transgenic animal models for study breast cancer related Her2 subtype were generated. Transgene regulation via the
16 mouse mammary tumour virus-long terminal repeat (MMTV-LTR) promoter was ideally suited for this purpose, as it directs the high-level expression of a transgen specifically in the mammary epithelium (Sinn et al., 1987). These attempts resulted in different ERBB2-driven breast cancer murine models with different growth kinetics of tumors. It was speculated that these differences are due to the type of insert (wild type or activated mutant form), the background of host strains and some technical differences such as insertion site and copy number of inserts (Ursini-Siegel et al., 2007).
The over-expression of wild type Neu resulted in mammary tumors with a long latency about 1 year (Muller et al., 1988). Thus, researchers shifted to the use of an activated form of Neu (NeuT). The first NeuT mice were generated by Philip Leder’s Group in FVB mouse strain (Muller et al., 1988). Tumors of this model were arising in a stochastic fashion in different organs other than mammary gland and, therefore, Libero Clerici’s group tried to overcome that problem by changing vector construct and strain of mice. They changed to CD1 strain and generated a new NeuT model, but tumor onset was not similar in the following generations as well as some problems in the fertility of transgenic mice (Lucchini et al., 1992). Guido Forni’s group developed the Balb-NeuT mouse model for the first time by breeding transgenic CD1 random- bred breeder male mouse with BALB/c females (Boggio et al., 1998). They generated a BALB/c background mouse model carrying the mutated rat HER-2/neu oncogene (Tg-NeuT; amino acid 664 ValGlu) driven by the MMTV promoter. This mouse model is known as one of the fastest Her2-driven breast tumor forming model (Figure 5) with a constant onset of tumors in offsprings and little involvement of other organs. However, MMTV–NEU mice models serve not only as a simple breast cancer model, but also many studies used and are using these models in concert with additional transgenic animals, to identify key candidate genes and correlated signaling involved in various biological processes in tumor biology (Ursini-Siegel et al., 2007).
17
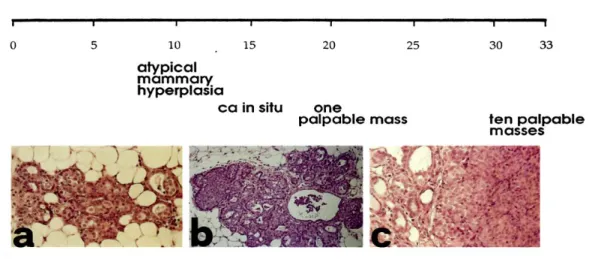
Figure 5. Progression of HER-2/neu carcinogenesis in untreated Balb–NeuT. Histology shows that ductular atypical hyperplasia (a) is already evident and widely distributed in all mammary glands at 3 weeks of age. This hyperplasia progresses to carcinoma in situ (b) between weeks 13 and 17, and then to an invading lobular carcinoma (c) (Boggio et al., 1998).
1.7 Aim of work
Although, many studies support the concept of early dissemination of cancer cells, the concept of parallel progression of primary tumors and metastasis is still under debate (Valastyan and Weinberg, 2011). That is because experimental data derived from cell lines suggest metastasis to be a consequence of increasing aggressiveness and loss of differentiation, acquisition of epithelial-mesenchymal transition and genetic deterioration. Therefore, it is unclear how early- disseminated, “normal-like” cancer cells should be able to successfully overcome critical metastatic steps (Valastyan and Weinberg, 2011) unlike late disseminating cancer cells thought to be similar to primary tumor cells. Based on previous data from the Balb-NeuT model and patients, this work aims to elucidate underlying mechanisms responsible for early dissemination of tumor cells in breast cancer.
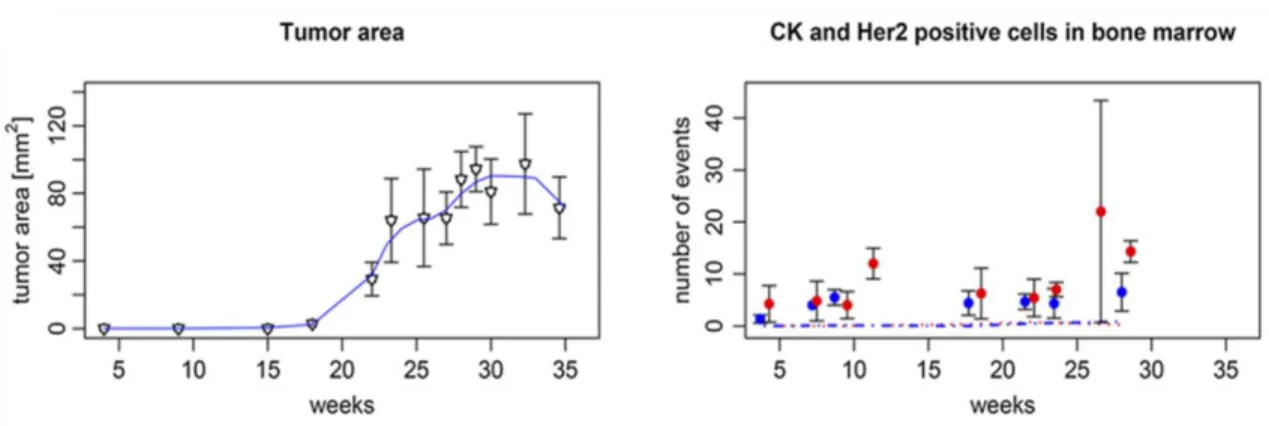
In the Balb-NeuT model, we previously noted that dissemination was not only an early event but also observed that the frequency of DCCs in bone marrow did not increase with tumor size (Figure 6; (Hüsemann et al., 2008)).
18
Figure 6. Progression of local and systemic disease in Balb-NeuT mice over time. Left panel: Increase of tumor area. Right panel: number of CK+ (red dots) and HER-2+ (blue dots) cells per 5 x 10⁵ bone marrow. Number of disseminated cancer cells does not increase by increasing tumor size (Hüsemann et al., 2008).
The same was true for breast cancer patients, suggesting that both in mice and men seeding propensity is relatively (i.e. related to the number of tumor cells) lower in large as compared to small cancers. Moreover, even in breast cancer patients without histologically invasive cancers but pre-invasive lesions such as atypical ductal hyperplasia (ADH) or in situ carcinomas (DCIS), we could detect DCCs in bone marrow as in mice (Hüsemann et al., 2008).
Therefore, this project was designed to address several critical questions in this regard:
1) How do breast cancer cells disseminate in very early stage before tumor manifestation?
2) To what extent are early disseminated cancer cells fit to colonize and form metastasis?
3) Which mechanism reduces metastatic seeding from advanced stages of cancer growth?
4) What is the relevance of our findings to human data and disease courses in breast cancer?
19
2 Materials and Methods 2.1 Methods
2.1.1 Animal Experiments 2.1.1.1 Maintenance
Balb-NeuT transgenic mice were obtained through collaboration with Dr. Guido Forni and maintained in our facilities according to the European Union guidelines. All animal experiments were performed according to the EU and national institutional regulations (Government of Upper Palatinate, 55.2-2532.1-27/14). Mice were screened at 3 to 4 weeks of age for hemizygosity (neuT+/neuT-), and negative littermates served as wild-type BALB/c mice controls. Mammary glands of Balb-NeuT female mice were inspected twice a week and arising tumors were measured in two perpendicular diameters.
2.1.1.2 Surgery
Mice were anaesthetized with Midazolam 5mg/kg, Fentanyl 0,05mg/kg, Medetomidin 0,5mg/kg i.p. Thorax and abdomen were shaved, and skin was incised from caudal to cranial region in the midline. For sphere injection experiments, 50 spheres (see section 2.1.3.4 for sphere generation) were mixed with matrigel (final concentration was 40%) and injected into the fourth right mammary gland of BALB/c mice. In case of tissue transplantation, a piece (approximately 1 mm3) of donor mammary tissue from 4-week-old Balb-NeuT mice or PT (21-23 week-old) was implanted in the cleared mammary fat pad of recipient mice. The skin was closed by a suture using polygelatin string and anesthesia was antagonized with Flumazenil 0,5mg/kg, Atipamezol 2,5mg/kg, Naloxon 1,2mg/kg s.c.. Postoperative analgesia was achieved by Buprenorphin (0,1 mg/kg) s.c.. Curative surgery or sacrifice of mice was done when the diameter of tumors was between 5-10 mm.
20 2.1.1.3 Mice dissection
Mice were sacrificed by asphyxiation with CO2 or by cervical dislocation. The organs of interest were either embedded in paraffin (see section 2.1.1.5 for paraffin embedding tissue) or used for snap freezing (see section 2.1.1.6 for tissue snap frizzing). The following organs were preserved for the later immunohistochemical analysis: 1) mammary glands, 2) tumors, 3) lungs, 4) liver and 5) spleen. Bone marrow was prepared by the protocol described in the next section (section 2.1.1.4).
2.1.1.4 Bone marrow preparation for staining
Tibias and femurs were collected either from BALB/c or Balb-NeuT in PBS or basal medium.
The soft tissue surrounding the bones was removed. Epiphyses were cut with scissors to flush out the bone marrow. Using a 26G needle and 1 ml syringe the bone marrow was flushed out into a 50 ml tube. Alternatively, for some experiments the flushed bones were put into a mortar to break the bones using mortar and pestle. The broken bones were washed with 1x PBS to collect the remaining bone marrow cells after flushing. Afterwards, the cells were pooled and centrifuged at 200x g for 10 min. The supernatant was discarded and the pellet was resuspended in 9 ml of 1x PBS. The cell suspension was slowly and carefully overlaid onto 6 ml of 65% percoll in a 15 ml tube to form a layer and centrifuged for 20 min at 1000x g to remove erythrocytes. The interphase was then carefully collected using a 5 ml pipette and transferred into a new 50 ml tube.
The tube was filled up with 1x PBS and centrifuged for 10 min at 500x g for washing the cells.
The cells were resuspended in 5 ml of 1x PBS and counted. Finally, 5 x 10⁵ cells were dropped on adhesion slides.
2.1.1.5 Extent of dissemination relative to tumour area
Data were taken from reference (Hüsemann et al., 2008). Briefly, gland/tumour areas were calculated from 270 mammary glands/tumours of 27 mice assuming the shape of an ellipse/circle for each tumour. The tumour area of mammary glands without palpable (i.e. not measurable by a caliper) tumours was set to 0.1 mm2 (i.e. assuming a diameter of 350 µm of a total, circular hyperplastic lesion within a mammary gland) for lesions from week 4 to week 9 old mice and 0.4 mm2 for week 11 mice. The adjustment for week 11 was based on a microscopic evaluation
21 revealing an about fourfold increase in hyperplastic lesions. CK positive cells from 27 mice were calculated as the mean of single disseminated cells per 106 BM cells.
2.1.1.6 Paraffin embedding of murine tissue samples
The dissected tissue samples were fixed in a 4% paraformaldehyde (PFA) solution for 12 h.
Following fixation, the samples were washed 3 times in 1x PBS. The major obstacle during the tissue sectioning represents residual water in the embedded tissue. Therefore, dehydration of the paraffin embedded samples was achieved by series of washing steps in alcohol (70%, 85% and 100% ethanol, each step 1 hour). Then the fixed and dehydrated tissue was washed twice for 30 min in 100% xylene. This step serves not only the removal of alcohol from the tissue, but also facilitates the penetration of the paraffin during the subsequent embedding. After three incubation steps with paraffin (parablast embedding media), tissues were embedded. Paraffin embedded tissue is stored at room temperature.
2.1.1.7 Tissue snap freezing
Tissue were labeled appropriately and packed in aluminum foils. Then, they were drawn in 50 ml falcon filled with 2-methyl butane. Falcon tube has carefully been placed into the liquid nitrogen.
Complete freeze is achieved at ~60 seconds (90 seconds maximum for larger specimens). Finally, samples were removed and stored in -80⁰C freezer. These samples have been used for RNA extraction or IHC staining.
2.1.2 Laser Microdissection and microarray analysis
Laser microdissection was performed to dissect metastatic lesions from lung, primary tumors, epithelial layers of mammary glands of Balb-NeuT mice at the time point of EL, and BALB/c mice at different age. Small pieces summing up to 105 μm2 for each sample were catapulted into a cap with 10 μl paramagnetic oligo-dT bead suspension and lysis buffer. The extraction of mRNA and microarray experiments were performed as described previously (Hartmann and Klein, 2006).
22 2.1.3 Cell culture experiments
2.1.3.1 Cell lines
All used cell lines, characteristics and media are listed in section 2.2.8. Cell lines were preserved in liquid nitrogen in appropriate medium containing 5% DMSO. They were propagated until 70%
confluence apart from the cases when the experimental strategy implied differently. Cell lines were detached using Trypsin/EDTA and re-plated in an appropriate cell density. All cells were incubated at 37°C with 5% CO2 and were routinely tested for mycoplasma and were found to be negative.
2.1.3.2 Cell culture treatments
Steroid hormones (progesterone, aldosterone, β-estradiol, testosterone, and hydrocortisone) were dissolved in ethanol. Rankl and Wnt4 were dissolved according to the manufacturer’s instructions. Cells were cultured 24 hours before treatment in appropriate densities. The desired concentration of that given hormone or factors were prepared in fresh media and added to the cultured cells only after cells were washed 2 times with PBS. These treatments were repeated for three times in each 24 hours interval. Cells were washed 2 times with PBS and fresh media containing additives were added. Three hours after last treatment, cells were washed 2 times with PBS and harvested with cell scraper for RNA or protein extraction.
2.1.3.3 Cell density experiments
TUBO cells were cultured in 3 x 10⁴ cells/cm2 forhigh density and 5.2 x 10³ cells/cm2 for low density experiments. PT primary cells were cultured in 10.6 x 10⁴ cells/cm2 forhigh density and 2.2 x 10³ cells/cm2 for low density experiments. Criterions for human cell lines, was 100%
confluency for high density and 20-30% confluency for low density. For hormone treatment and comparisons between low and high density experiments, cells were incubated for 76 h and fresh hormone treatment as well as washing (PBS 2x) was done in 24 h intervals. I avoided changing medium and washing steps during incubation of cells when miRNA analyses were aim of experiment. In migration experiments 104 cell/well were seeded (24 well migration chambers) for low density and 5 x 10⁴ cell/well for high density. For migration experiments (see section 2.1.5) low density was 1 x 10⁴ cells per well (24 well plate) and high density was 5 x 10⁴ cell per well.
23 For sphere culture experiments (see section 2.1.3.5) low density was 103 cells/ml and high density was 104 cell/ml.
2.1.3.4 Primary cultures
Mammary glands were collected either from BALB/c or Balb-NeuT in a 50 ml tube with PBS.
The tissue was minced with surgical blades to small pieces and digested in basal medium (DMEM/F12, 100 nM HEPES buffer, 10 mg/ml insulin, 0.5% BSA and 0.5x penicillin/streptomycin) with 200 U/ml collagenase, 10 ng/ml EGF and 200 U/ml hyaluronidase.
The tissue was digested for 1.5-2 hours at 37° C in the incubator mixed every 1 hour. The digested tissue was transferred to a 50 ml tube. After a first centrifugation step of 1 min at 80 g to isolate the organoids the supernatant was collected into a new 50 ml tube and centrifuged at 200 g for 3 min to isolate mammary epithelial cells (MEC) which are in the pellet fraction. The supernatant consist of fibroblastic cells. Cells were re-suspended in DMEM medium (for primary 2D culturing) or basal medium (for sphere culturing), counted and cultured in appropriate densities in plates.
2.1.3.5 Sphere culture
The epithelial cells isolated after digestion were re-suspended in basal medium and subsequently cultured in a density of 5×10⁴ cells/ml in ultra- low adherent plates coated with 1.2% poly- HEMA. Sphere culture medium was basal medium supplemented with 2% B27, 10 μg/ml EGF, 10 ng/ml bFGF, 20 ng hIL6 (a gift of Dr. Stefan Rose-John Christian-Albrechts-University, Kiel, Germany), 4 ng/ml heparin, 5 ng/ml Gro-α, and in case of progesterone treatment with 10 nM progesterone. Sphere cultures were incubated at 37°C with 5% CO2 and 7% O2 and spheres were screened after 10 days. Size and number of mammospheres was inspected under light microscope and measured using Zeiss Axiovision software after 10-14 days.
Sphere assay for cell lines was performed similarly. Cultured cells were tripsinized and dissociated to single cell suspension. Then, cells were re-suspended in basal medium and seeded in appropriate densities in poly-HEMA coated plates. Size and number of spheres was inspected under light microscope and measured using Zeiss Axiovision software after 3-5 days.
24 2.1.3.6 Preparation of poly-HEMA and low attachment plates
To prepare coating solution, 2.4 g of poly-hydroxy-ethyl-methyl-acrylate (poly-HEMA) were added to 20 ml of 95% ethanol and put on a shaker at 65° C to dissolve for ~8 hours. To the above dissolved poly-HEMA, 80 ml of 95% ethanol was added and mixed. The prepared solution could be stored indefinitely at 4° C. Poly-HEMA solution was added to the cell culture dishes at a final density of 0.8 mg/cm (w/v). The plates were dried overnight in a sterile hood with lids slightly opened. The poly-HEMA-coated plates can be stored indefinitely until use at +4° C.
2.1.3.7 Sphere counting
Spheres were counted after 10-14 days for primary cells and 3-5 days for cell lines. Only spheres with size bigger than 50 µm were counted. Sphere counting for cell lines were done by screening whole plates in10X magnification of microscope. In case of primary cell culture when number of spheres increased to thousand or more (i.e. progesterone or Wnt4/Rankl treatment), each plate were centrifuged in 1000 g for 5 minutes. Sphere pellet was resuspended in 1 ml PBS and 20 µl of sphere suspension was taken while pipetting was processing by 1ml pipettor. That was done in triplicates for each plate and the 20 µl sphere suspension were spread as one strip-line in the surface of one empty culturing plate. The average number of spheres in all strip-lines multiplied to factor 50 in order to estimate total number of spheres per plate.
2.1.3.8 Conditioned medium preparation
Cell media supernatant of confluent cultured cell has been collected in 50 ml tubes and centrifuged for 10 min at 1000xg to pellet cells and cell debris. The supernatant was sterile filtered through a 0.22 µm filter to remove any cells in the conditioned medium. The medium was used immediately or stored at -80° C until further use. Target cells for treatment were cultured 24 hours before.
2.1.3.9 Transwell assay
Transwell insert with a microporous membrane of 0.4 µm were used to separate the upper and lower compartments. The microporous membrane allows only soluble factors to pass through
25 between the compartments. EL cells were cultured in the lower chamber and PT cells were cultured in the upper chamber. Both were cultured in a density of 106 cells per well of 6 well plates (DMEM 10% FCS; Figure 7).
Figure 7. Schematic representation of transwell assay experimental setup.
2.1.4 Differentiation of mammosphere cells
Chamber slides were coated with a layer of 100 % matrigel. Then freshly isolated and digested single cells from mammary glands or primary tumors were seeded on the top of solidified Matrigel (Figure 8). The differentiation condition was as previously described (Debnath et al., 2003; Ghajar and Bissell, 2008). The formation of acini was monitored every 24 h for 4 weeks.
The media was changed every 3 days. Additionally, a long time sphere culture was performed to evaluate differentiation. Spheres were kept in culture without passaging for 5 weeks but with adding fresh medium every week. The formation of acini like structures was used as criterion for differentiation. I recorded the time point when EL and PT cells formed acini structures upon control or progesterone treatment conditions.
Figure 8. Schematic representation of differentiation assay experimental setup.
2.1.5 Migration/Invasion assays 2.1.5.1 3D Migration/Invasion assay
Transwell inserts (Corning; cat no: 3422) with 8 µm pores were coated with 40% matrigel. 4x10⁴ cells from cell lines and 105 cells isolated from tissue or spheres were resuspended in FCS-free medium before seeding. Cells were then seeded in 200 µl of FCS-free medium (DMEM) on the
26 top of matrigel layer and FCS medium (DMEM) was added to the lower chamber (Figure 9). For additional treatments both upper and lower media were supplemented with progesterone (10 nM), Wnt4 (5 ng/ml) or Rankl (50 ng/ml). After 72 hours incubation of cells isolated from mammospheres or freshly digested tissues, inserts were removed and cells were fixed with methanol (-200C for 10 min) and stained with trypan blue. Cells were counted from 3 fields (4x magnification) when visualized under the microscope.
Figure 9. Schematic representation of migration/invasion assay experimental setup.
2.1.5.2 Stem cell migration assay
To evaluate stemness of migratory cells, we established new invasion-sphere formation assay where the cells were sandwiched between two layers of 40% matrigel in the upper chamber and the lower chamber was coated with poly-HEMA. Lower medium was mammosphere medium which has been described in sphere assay section (Figure 10). After 72 hours, inserts have been removed, fixed and stained with trypan blue for single cell migration analysis. 600 µl of fresh sphere medium was added to the lower chamber and cells incubated for 14 days until spheres were counted.
Figure 10. Schematic representation of migration-Sphere formation assay experimental setup.
27 2.1.6 Proliferation assay
Single cell suspensions were cultured in 96 well plates and proliferation was evaluated by XTT colorimetric assay kit (Roche; cat no: 11465015001) based on manufacturers instruction. Cell seeding concentration was 3000 cells/well which was done in 6 replications. The media were supplemented with investigated factors (see appropriate experiments) or hormones as well as vehicle and were changed every second day.
2.1.7 Staining
2.1.7.1 Haematoxylin and eosin staining
Paraffin embedded tissue was cut into 5 µm sections onto poly-L-lysine-coated slide. Sections were dewaxed in Xylol for 10 min twice and rehydrated first in 100% ethanol for 3 min and then in 80% ethanol for 3 min. The sections were washed in PBS for 1 min thrice and incubated with hematoxylin for 45 sec. The slides were rinsed in tap water for a short duration and washed in tap water for 30 min in a glass cuvette. Eosin (0.1%) was added to the tissue sections and after 2 min they were washed with ddH2O for 1 min. The stained sections were dehydrated in 70% ethanol for 2 min, 100% ethanol for 2 min and finally in xylol for 15 min. Mounting gel was added to the tissue sections and a cover slip was placed carefully on the gel avoiding bubbles and were left to dry overnight.
2.1.7.2 Bone marrow staining for DTC detection
At least 106 cells per mouse were stained to detect positive cells. Blocking solution (5% rabbit serum in 1x TBS) was added to the slides to rehydrate the cells and to block unspecific binding of antibodies to the cells. After 20 min the blocking solution was discarded and primary antibody against CK 8 and 18 (all antibodies and working concentrations are listed in section 2.2.6) was added and incubated for 60 min. The primary antibody was discarded and slides were washed 3 times for 3 min in 1x TBS. Then slides were incubated with the secondary antibody for 25 min, and washed 3 times for 3 min in 1x TBS followed by incubation with ABC complex for 25 min.
Finally, the development system of the BCIP/NBT for alkaline phosphatase enzymatic substrate was added for 10 min. The slides were washed 3 times for 3 min and screened for CK8/18 positive cells. The positive cells were typically violet-to-black in color. TUBO, a tumor cell line