Role of melanoma-derived ADAM-9 for invasion and metastasis of melanoma
Inaugural-Dissertation
Zur
Erlangung des Doktorgrades
der Mathematisch-Naturwissenschaftlichen Fakultät der Universität zu Köln
vorgelegt von
Alexander Schönefuß aus Mülheim an der Ruhr
Hundt Druck GmbH, Köln
2012
Berichterstatter (Gutachter): PD Dr. Roswitha Nischt Prof. Dr. Matthias Hammerschmidt
Tag der mündlichen Prüfung: 18.06.2012
Table of Contents
Summary 1
Zusammenfassung 3
1. Introduction 5
1.1 Human melanoma 5
1.1.1 Melanoma origin 5
1.1.2 Etiology of melanoma 6
1.1.3 Melanoma development, growth and metastasis 7
1.2 Mouse models to study melanoma 10
1.3 ADAM proteases 11
1.3.1 Structure 11
1.3.2 Regulation 12
1.3.3 ADAM function in physiology and pathology 13 1.4 Current knowledge on ADAM-9 function in physiology and patholgy 14
1.5 Aims of the thesis 16
2. Materials and Methods
17
2.1 Material 17
2.1.1 Chemicals 17
2.1.2 Recombinant and purified proteins 17
2.1.3 Cell culture material 17
2.1.4 Consumable materials 18
2.1.5 Buffers and solutions 18
2.1.6 Devices 18
2.1.7 Software 19
2.2 Methods 20
2.2.1 Cell culture 20
2.2.1.1 Melanoma cell lines 20
2.2.1.2 Endothelial cell lines 21
2.2.1.3 Isolation and culture of primary human dermal fibroblasts 21
! !
2.2.1.4 Stimultion of BLM melanoma cells and fibroblasts 21 2.2.1.5 Generation of IL-1α or ADAM-9 silenced stable
melanoma cell clones 22
2.2.1.6 Cell area and volume determination 23
2.2.1.7 Proliferation Assay 23
2.2.1.8 Soft agar colony formation assay 23
2.2.1.9 Dead de-epidermized skin assay 24
!
2.2.1.10 Cell migration assay 25
2.2.1.11 Adhesion assay 25
2.2.1.12 Cell-cell adhesion assay 26
2.2.1.13 Fluorescence activated cell sorting (FACS) 26
2.2.2 Protein analysis 27
2.2.2.1 Preparation of cell lysates 27
2.2.2.2 SDS-PAGE and immunoblotting 28
2.2.2.3 Immunohistochemistry 28
2.2.2.4 Immunocytochemistry 30
2.2.2.5 Histological analysis 31
2.2.2.6 Processing of basement proteins by ADAM-9 31
2.2.2.7 Cytokine antibody array 32
2.2.3 Analysis of nucleic acids 32
2.2.3.1 RNA isolation 32
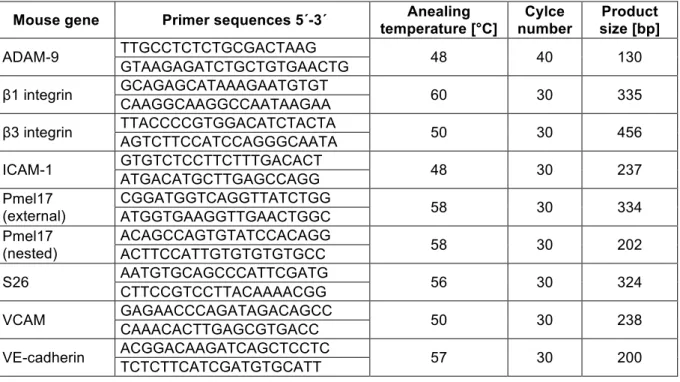
2.2.3.2 Reverse transcription and polymerase chain
chain reaction (RT-PCR) 32
2.2.3.3 Quantitative real time PCR 34
2.2.3.4 Analysis of genomic DNA 35
2.2.4 In vivo experiments 35
2.2.4.1 Animal housing 35
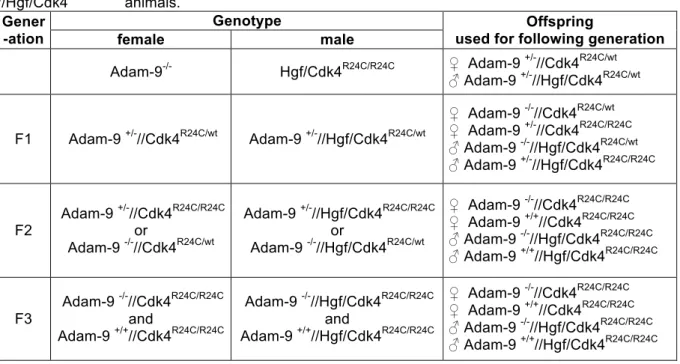
2.2.4.2 Generation of Adam-9
-/-//Hgf/Cdk4
R24C/R24Canimals 35 2.2.4.3 Induction and analysis of melanoma formation 36 2.2.4.4 Tail vein injection of B16-F1 melanoma cells 37
2.2.5 Statistical analysis 37
3. Results
38
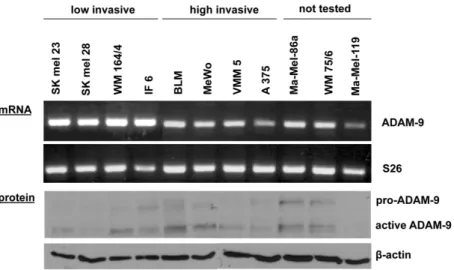
3.1 Analysis of ADAM expression in melanoma cells 38 3.1.1 ADAM expression in human melanoma cell lines 38 3.1.2 ADAM-9 transcript and protein expression 38 3.2 In vitro analysis of ADAM-9 function in melanoma cells 39
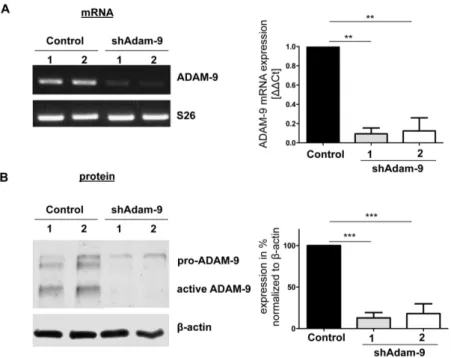
3.2.1 Stable down-regulation of ADAM-9 39
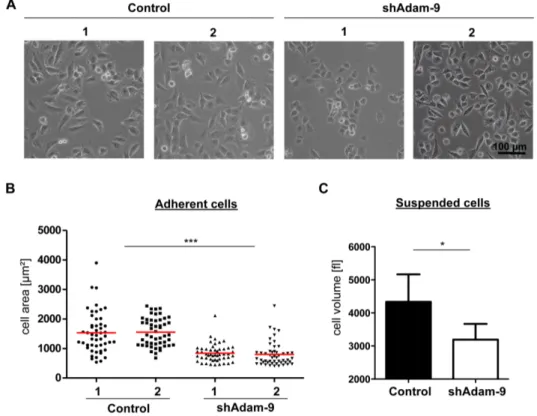
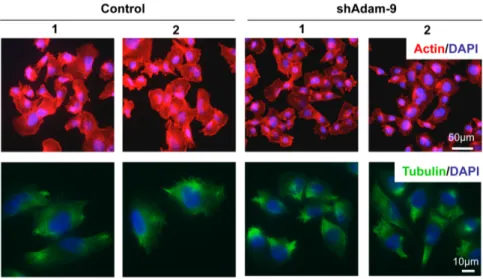
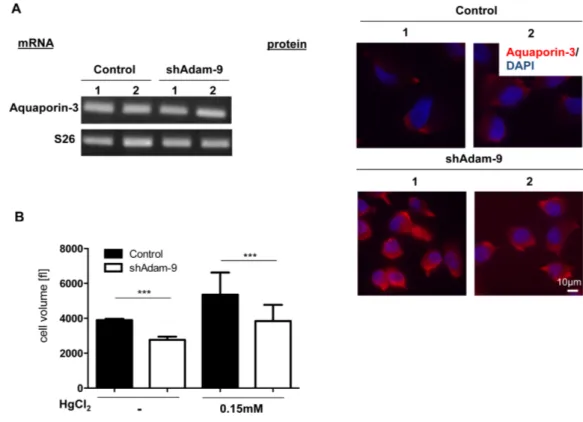
3.2.1.1 Regulation of cell size by ADAM-9 41
3.2.1.2 Analysis of proliferation 44
3.2.1.3 In vitro cell invasion 45
3.2.1.4 Adhesion to basement membrane proteins 47
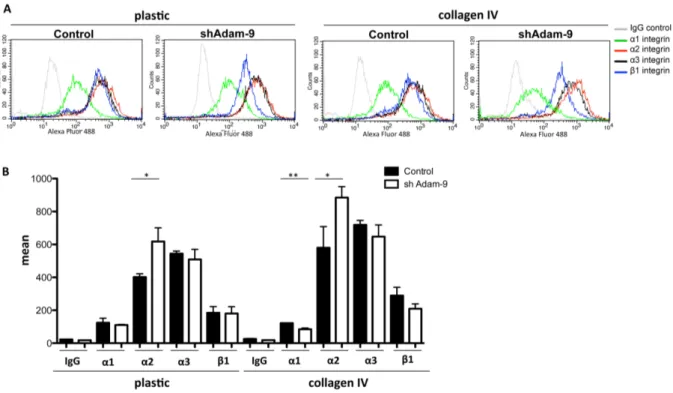
3.2.1.5 Analysis of integrin expression 48
3.2.1.6 Analysis of cell migration 50
3.2.2 Processing of basement membrane proteins by ADAM-9 51
3.3 Regulation of ADAM-9 expression 54
3.3.1 Analysis of ADAM-9 regulation by IL-1
α54
3.3.1.1 Regulation of ADAM-9 by exogenous IL-1α 54 3.3.1.2 Analysis of melanoma cell derived IL-1
αon ADAM-9
expression in high invasive melanoma cells 56 3.3.1.3 Invasion through the basement membrane
upon IL-1α down-regulation 58
3.3.2 Modulation of ADAM-9 expression by indirubins 60 3.4 In vivo analysis of ADAM-9 function in a mouse model for
spontaneous melanoma development 61
3.4.1 Generation of Adam-9
-/-//Hgf/Cdk4
R24C/R24Canimals 62 3.4.1.1 Analysis of skin architecture and differentiation 63 3.4.2 ADAM-9 expression in melanomas developed in control mice 66 3.4.3 Analysis of DMBA-induced tumor growth and development 67
3.4.3.1 Histology of DMBA-induced tumors 69 3.4.3.2 Analysis of vascularization and proliferation of DMBA-
induced tumors 70
3.4.3.3 Inflammatory infiltration of DMBA-induced tumors 71 3.4.4 Metastatic spread in control and Adam-9
mutated/koanimals 72 3.4.5 Charaterization of mechanisms responsible for reduced lung
metastases formation in Adam-9
mutated/koanimals 76
3.4.5.1 Melanoma cell chemoattraction 76
3.4.5.2 Basement membranes in DMBA-induced tumors 78 3.4.5.3 Intra- and extravasation of melanoma cells 80 3.5 Role of ADAM-15 in growth and invasion of melanoma 83
4. Discussion
85
4.1 Expression of ADAMs in melanoma cells 85
4.2 Role of ADAM-9 for melanoma growth and invasion in vitro 86 4.2.1 Involvement of ADAM-9 in melanoma cell proliferation 86
4.2.2 Regulation of cell size by ADAM-9 88
4.2.3 Basement membrane penetration mediated by ADAM-9 89 4.3 Regulation of ADAM-9 expression in melanoma cells by IL-1α 92 4.4 Role of ADAM-9 for melanoma growth and invasion in vivo 93 4.4.1 Role of ADAM-9 for melanoma development and growth 93 4.4.2 Role of ADAM-9 for metastases formation 95
4.5 Outlook 98
5. References
99
6. Abbreviations
107
!
Acknowledgement
111
Publication ADAM-15
112
Erklärung
118
Curriculum vitae
119
1 Summary
The protein ADAM-9 (A disintegrin and metalloprotease-9) belongs to the family of the ADAM proteases, which are type I transmembrane proteins and are unique among transmembrane proteins as they exhibit protease as well as adhesive functions. The ADAM proteases are involved in ectodomain shedding of membrane-bound molecules as well as in cell-cell and cell-matrix interactions.
In human melanoma ADAM-9 is located at the tumor-stroma border in the stromal cells, but also in the melanoma cells. The aim of this work was to find out the function of ADAM-9, produced by the melanoma cells, for the development and invasion of melanoma.
In vitro experiments, in which high invasive melanoma cells with stable down-regulation of
ADAM-9 mediated via shRNA were used, showed that silencing of ADAM-9 slightly increased melanoma cell proliferation and remarkably reduced basement membrane penetration in an
in vivo like invasion system. The reduced invasion through the basementmembrane might be due to decreased adhesion to the basement membrane, as the ADAM-9 down-regulated cells exhibited significantly reduced adhesion towards type IV collagen and matrigel. Additionally it was found that the laminin
β3-chain, which is a component of thebasement membrane protein laminin 332, was cleaved by ADAM-9 in the N-terminal region.
This work further confirmed that extracellular IL-1α down-regulates ADAM-9 expression in melanoma cells, which is mediated via a JNK dependent pathway and showed that in melanoma cells intracellularly active IL-1α controls constitutive expression levels of ADAM-9 via the involvement of ERK. Despite the activity of IL-1α as regulator of ADAM-9 expression, also indirubins, which are anti-cancer drugs, were identified as molecules down-regulating ADAM-9 expression in high invasive melanoma cells, but not in fibroblasts.
To analyze if ADAM-9 also influences melanoma development and invasion
in vivo,HGF/CDK
R24C/R24Canimals, which spontaneously develop melanomas as well as upon DMBA treatment, were crossbred with ADAM-9
-/-mice. This strategy enabled to investigate melanoma development and progression in the absence of ADAM-9 in stromal as well as in the tumor cells. The created Adam-9
mutated/ko(Adam-9
-/-//Hgf/Cdk4
R24C/R24C) animals developed more tumors compared to control (Adam-9
+/+//Hgf/Cdk4
R24C/R24C) mice at week four after DMBA treatment, whereas from week six onwards the Adam-9
mutated/koanimals exhibited a reduced tumor number. This finding it most likely attributed to a differential proliferation of the tumor cells at both analyzed time-points.
Interestingly lung metastases formation was significantly reduced in the Adam-9
mutated/komice.
This might be attributed to an impaired extravasation generated by a decreased adhesion of
2 ADAM-9 deficient melanoma cells to endothelial cells, because it could be shown that ADAM-9 down-regulated melanoma cells exhibited a significantly reduced adhesion towards endothelial cells. Additionally the intravasation might also be reduced indicated by immunohistochemical stainings for laminin
β3-chain. This staining was confined to thebasement membrane zone and appeared continuous in the tumors obtained from the Adam- 9
mutated/koanimals, whereas in the control animals the basement membrane appeared destructed and discontinuous. This indicates that in the absence of ADAM-9 break down of the basement membrane by the melanoma cells might be reduced resulting in decreased intravasation.
To summarize the
in vitro and in vivo data, melanoma-derived ADAM-9 is involved inbasement penetration and melanoma metastases formation in the lungs. The obtained data suggest that ADAM-9 can contribute to lung metastases formation by facilitating basement membrane penetration and mediating adhesion of melanoma cells to endothelial cells.
!
!
!
!
!
!
!
!
!
!
!
!
!
!
!
!
!
!
3 Zusammenfassung
Das Protein ADAM-9 (A disintegrin and metalloprotease-9) ist ein Mitglied der Familie der ADAM Proteasen, welche zur Klasse der Typ I Transmembranproteine gehören und als einzige Transmembranproteine eine Funktion als Protease sowie als Adhäsionsmolekül ausüben. ADAM Proteasen sind beteiligt an der Prozessierung von membrangebundenen Proteinen (ectodomain shedding) sowie an Zell-Zell und Zell-Matrix Interaktionen.
In histologischen Färbungen von humanen Melanomen ist ADAM-9 an der Stroma-Tumor Grenze, sowohl in stromalen Zellen als auch in Melanomzellen, nachgewiesen worden. Das Ziel dieser Arbeit war es die Beteiligung von ADAM-9, das in Melanomzellen produziert wird, an der Melanomentstehung und -invasion herauszufinden.
In
in vitro Experimenten mit hoch invasiven Melanomzellen, in welchen die ADAM-9Expression mittels shRNA stabil herunterreguliert wurde, zeigte sich dass die Herunterregulation von ADAM-9 die Proliferation von Melanomzellen leicht erhöht und die Invasion der Zellen durch die Basalmembran stark verringert. Ein Grund für die reduzierte Basalmembraninvasion könnte eine verringerte Adhäsion der ADAM-9 herrunterregulierten Melanomzellen auf der Basalmembran sein, da diese Zellen eine signifikant reduzierte Adhäsion gegenüber Typ IV Kollagen sowie Matrigel aufwiesen. Außerdem wurde gezeigt, dass die Laminin
β3-Kette, welche ein Bestandteil des Basalmembranproteins Laminin 332ist, von ADAM-9 in ihrem N-terminal Ende proteolytisch geschnitten werden kann.
Des Weiteren konnte durch diese Arbeit bestätigt werden, dass extrazelluläres IL-1α die Expression von ADAM-9 in Melanomzellen, unter der Beteiligung von JNK, herrunterregulieren kann und dass in Melanomzellen interzellulär aktives IL-1α die konstitutive Expression von ADAM-9 durch einen ERK abhängigen Signalweg kontrolliert.
Außer der Aktivität von IL-1α als Regulator der ADAM-9 Expression, konnten zudem Indirubine, welche in der Krebstherapie eingesetzt werden, als Moleküle identifiziert werden, welche die ADAM-9 Expression in hoch invasiven Melanomzellen, aber nicht in Fibroblasten reduzieren.
Um die Beteiligung von ADAM-9 an der Melanomentstehung und -invasion in der
in vivoSituation zu analysieren, wurden HGF/CDK
R24C/R24CMäuse, welche sowohl spontan als auch nach DMBA Behandlung Melanome entwickeln, mit ADAM-9
-/-Mäusen gekreuzt. Diese Strategie ermöglichte es die Melanomentstehung und -progression in einer Situation, in der sowohl die Stroma-, als auch die Tumorzellen kein ADAM-9 exprimieren, zu untersuchen.
Die generierten Adam-9
-/-//Hgf/Cdk4
R24C/R24CTiere wiesen vier Wochen nach der DMBA
Behandlung zunächst mehr Tumore im Vergleich zu Adam-9
+/+//Hgf/Cdk4
R24C/R24C4 Kontrolltieren auf ab Woche sechs hingegen entwickelten die Adam-9
-/-//Hgf/Cdk4
R24C/R24CTiere weniger Tumore. Dieses Ergebnis könnte auf eine unterschiedliche Proliferation der Tumorzellen zu beiden untersuchten Zeitpunkten zurückzuführen sein.
Interessanterweise entwickelten die Adam-9
-/-//Hgf/Cdk4
R24C/R24CMäuse signifikant weniger Lungenmetastasen als die Adam-9
+/+//Hgf/Cdk4
R24C/R24CTiere. Dieser Effekt könnte auf eine gestörte Extravasation zurückzuführen sein, da gezeigt werden konnte, dass die Adhäsion von Melanomzellen, in denen ADAM-9 herrunterreguliert wurde, gegenüber Endothelzellen signifikant reduziert ist. Zusätzlich könnte auch die Intravasation reduziert sein, da in immunhistochemischen Färbungen der Tumore gegen die Laminin β3-Kette, die Färbung in den Adam-9
-/-//Hgf/Cdk4
R24C/R24CTieren eine intakte und kontinuierliche Basalmembran zeigte. In den Adam-9
+/+//Hgf/Cdk4
R24C/R24CTieren hingegen war die Basalmembran degradiert und diskontinuierlich. Dieses Ergebnis weist darauf hin, dass in ADAM-9 defizienten Tieren die Degradierung der Basalmembran durch die Melanomzellen vermindert sein könnte, was zu einer reduzierten Intravasation führt.
Zusammenfassend haben die
in vitro und in vivo Daten gezeigt, dass von Melanomzellenproduziertes ADAM-9 an der Basalmembraninvasion und der Entstehung von Lungenmetastasen beteiligt ist. Die erhaltenen Ergebnisse lassen vermuten, dass ADAM-9 in der Überwindung der Basalmembran durch Melanomzellen eine Rolle spielt und in der Lage ist Adhäsion zwischen Melanom- und Endothelzellen zu vermitteln.
!
5 1. Introduction
1.1 Human melanoma
1.1.1 Melanoma originMelanoma is a highly malignant tumor arising from the malignant transformation of melanocytes (de Vries
et al., 2003). Melanocytes are derived from highly migratoryembryonic cells called neural crest cells (Uong and Zon, 2010). These cells differentiate into melanocyte precursor cells, the melanoblasts, and subsequently, under the influence of melanocyte-stimulating hormone, are converted into pigment producing melanocytes (Herlyn
et al., 2000). In healthy human epidermis melanocytes are scattered among keratinocytes atthe epidermal-dermal border, forming structural and functional contacts with keratinocytes, which control melanocyte proliferation, differentiation and expression of surface molecules (Mc Gary
et al., 2002). The localization of melanocytes in the skin differs between humanand mice, being present in hair follicles and the basal layer of the interfollicular epidermis in humans and in the hair follicles and dermis, but not in the epidermis in the mouse (Herlyn et
al., 2000). In Figure 1 the development of melanoma is illustrated.Figure 1: Development of melanoma. Melanoma evolves from normal melanocytes located in the basal layer of the epidermis. The melanocytes can either develop directly into melanoma cells or fist transform into nevi cells, which can also give rise to melanoma cells. In the radial growth phase (RGP) melanoma first grows in horizontal direction without substantial penetration of the underlying dermis.
With entering the vertical growth phase (VGP) the transformed cells invade into the dermis and finally enter the circulation where they are transported to distant organs with the potential to form metastases (Gaggioli and Sahai, 2007). The right panel shows some examples of the macroscopic appearance of melanoma with typical morphologic characteristics like unequal borders, brown-black color, asymmetry and elevation.
In human skin, increased proliferation of melanocytes in the epidermis marks their benign
transformation into melanocytic nevi. These nevi can show some cellular aberrations, but are
not invasive. Although some melanomas can develop from pre-existing nevi, most
6 melanomas evolve
de novo from melanocytes without the presence of a premelanocyticnevus lesion (Haass and Herlyn, 2005). Initially melanoma grows in horizontal direction within in epidermis without crossing the basement membrane (BM), this phase is called the radial growth phase. In later stages the tumor cells degrade the BM and enter the dermis, which is defined as vertical growth phase. Invasion through the dermis is followed by invasion into the circulation via the bloodstream or the lymphatic vessels and leads to metastatic spread to distant organs (Gaggioli and Sahai, 2007).
1.1.2 Etiology of melanoma
Risk factors for melanoma comprise light skin phenotype, high number of nevi, chronic sun exposure, particularly in childhood and a familial history of melanoma (Tucker
et al., 2003;Benjamin et al., 2007). The influence of exposure to UV irradiation as a cause for melanoma is discussed controversially, because melanomas lack typical UV signature mutations, as induction of thymidin dimers in DNA by UV-B radiation (Fu et al., 2003; Holmes et al., 2007).
Moreover melanoma can also arise in completely sun-protected areas. On the other hand UV treatment in animal models suggests a connection between melanoma and UV exposure.
Thus for example irradiation of hepatocyte growth factor/scatter factor (HGF/SF) transgenic mice with UVB, but not UVA light, induces melanoma formation (De Fabo et al., 2004).
The recent advances in sequencing technology allowed performing genome-wide screening studies using melanoma cell lines and tissues, identifying several chromosomal aberrations, like alterations in gene copy number or loss of heterozygosity, in melanoma. These studies discovered several hot spots, which are frequently mutated in melanoma including the
CDKN2A locus, BRAF, NRAS or MITF, suggesting that the onset of melanoma is caused bythe sequential accumulation of inherited and/or acquired mutations (Curtin et al., 2005; Stark and Hayward, 2007).
As already mentioned several genes are frequently mutated in melanoma, including the
CDKN2A locus encoding the two tumor suppressor genes p16Ink4aand
p14ARF. Germline
mutations in this locus were observed in 25-50% of familial and somatic mutations in about
40% of sporadic melanomas (Tsai and Tsao, 2004; Hocker et al., 2007). The protein p16
Ink4ainhibits CDK4, which no longer phosphorylates the retinoblastoma protein thereby blocking
transition from G
1- to S-phase of the cell cycle. On the contrary, abrogation of the inhibitory
activity of p16
Ink4aresults in constantly active CDK4 and increased cell survival and
proliferation (Hocker et al., 2007). Activating mutations in CDK4 have also been described in
familial melanoma and lead to enhanced cell proliferation and survival (Zuo et al., 1996). The
other protein encoded by the
CDKN2A locus, p14ARFfunctions as tumor suppressor by
inhibiting the action of MDM2 thereby promoting the activity of p53. Mutations in p14
ARFlead
to increased levels of MDM2, subsequent inhibition of p53 and loss of cell cycle control
(Lowe and Sheer, 2003). Mutations in melanoma are also often found in the RAS pathway,
7 particular in
NRAS as well as in downstream targets of NRAS in the MAPK pathway, like BRAF. Thus in up to 90% of melanomas activating mutations in one of the two key MAPKgenes,
BRAF or NRAS are present (Hocker et al., 2007). Genome-based oncogenescanning studies showed that the most common mutation in
BRAF is an amino acidsubstitution in exon 15 in codon 600 from valine to glutamic acid (BRAF
V600E) (Davies et al., 2002). Interestingly, selective inhibition of this mutated BRAF in clinical trials led to complete or partial tumor regression in the majority of the patients (Flaherty
et al., 2010), howeverfollow up studies showed that one third of the patients developed squamous cell carcinomas (Sosman
et al., 2012). In 50-60% of melanomas mutations are found in molecules of thePI3K/AKT pathway, e.g. in
PTEN and AKT (Chudnovsky et al., 2004; Hocker et al., 2007),resulting in increased cell survival and proliferation (Wu
et al., 2003). Mainly these twonetworks, the MAPK and the PI3K/AKT pathway, regulate melanoma proliferation, survival and invasion. Mutations in one of the most prominent tumor suppressor genes
TP53encoding for the p53 protein were only found in 10% of melanomas, suggesting that this pathway is not one of the major networks responsible for melanoma development (Chudnovsky et al., 2004; Tsai and Tsao, 2004; Hocker et al., 2007).
1.1.3 Melanoma development, growth and metastasis
Under physiological conditions melanocyte growth and behaviour is controlled by growth factors released from keratinocytes as well as by direct cell-cell interactions or interactions with the underlying matrix (Haass
et al., 2005). It has been shown for example in vitro thatthe intercellular adhesion molecule E-cadherin is the main mediator of human melanocyte adhesion to keratinocytes (Tang et al., 1994) and loss of expression of E-cadherin, leads to melanoma cell escape from keratinocyte-mediated control during melanoma progression (Kuphal and Bosserhoff, 2011). Moreover, while expression of E-cadherin is lost, melanoma cells acquire expression of other receptors, e.g. N-cadherin, which mediate homotypic interaction of melanoma cells and heterotypic interaction of melanoma cells with other N- cadherin expressing cells in the stroma, like fibroblasts and endothelial cells (McGary
et al.,2002; Alonso
et al., 2007). Another up-regulated receptor found in melanoma cells is themelanoma cell adhesion molecule (MCAM), which mediates cell interactions with the extracellular matrix or other adhesion molecules on endothelial cells (e.g. platelet endothelial cell adhesion molecule-1 (PECAM-1) (McGary et al., 2002).
Other cellular receptors, which are altered during the transformation of a melanocyte into a
melanoma cell, are integrin receptors, which are known to mediate prominently cell-matrix
interactions. Melanocytes were shown to express
α3β1, α6β1 and αvβ1 integrins, but inmelanoma cells increased expression of the fibronectin binding integrins αvβ3 and α5β1 was
detected (Haass et al., 2005). Likely, these receptor are necessary for cells to better adhere
8 and migrate though the underlying tissue or they can bind proteolytic enzymes, e.g. MMP-2, localizing them to the cell surface as shown for the αvβ3 integrin (Brooks et al., 1996).
As soon as the tumor cells have lost contact to their surrounding cells, they interact with and degrade the BM in order to invade the underlying tissue. It was shown that membrane-type matrix metalloproteases (MT-MMPs) expressed by cancer cells are mainly responsible for the breakdown of the BM in an ex vivo invasion system. This was true for all three members of this family, MMP-14, MMP-15 and MMP-16 (Hotary
et al., 2006). However, in vitro, otherMMPs, like MMP-2 or MMP-9, are also able to degrade type IV collagen, one of the main components of the BM, but these molecules were not able to promote cell penetration of the BM in an
ex vivo like invasion system in which different cancer cells including melanomawere used (Hotary et al., 2006).
These proteolytic enzymes may also play a role in the invasion through the dermal tissue, not only by mediating cellular migration, but also necessary to modify the extracellular matrix and release factors to create more favourable environment for melanoma progression (Zigrino
et al., 2005). Expression of a number of MMPs, including MMP-1, -2, -9, -13 andMMP-14 has been detected in melanoma (Hofmann et al., 2000). High expression of MMP-1 and MMP-3 correlated with shorter patient survival in agreement with the known function of MMP-1 to degrade type I and type IV collagens (Durko
et al., 1997; Nikkola et al., 2002).Similarly MMP-9 seems to be involved in metastases formation (Itoh
et al., 1999). In vitrostudies with melanoma cells have further shown that expression of MMP-2 and MMP-14 in melanoma cells modulates melanoma cell adhesion, spreading and migration in the extracellular matrix (Nakahara et al., 1997; Iida et al., 2004). Stromal expression of MMP-13 seems instead to be required for the induction of peritumoral angiogenesis in melanoma (Zigrino
et al., 2009). Other enzymes have also been implicated in mediating melanomainvasion, one example of these are cathepsins, lysosomal proteases. Inhibition of cathepsin K reduced invasion of melanoma cells through matrigel (Quintanilla-Dieck
et al., 2008). Theactivity of cathepsins B and L were detected in high invasive melanoma cells in vitro (Klose
et al., 2006a) and contact of high invasive melanoma cell lines with type I collagen inducedthe release of cathepsin B in the extracellular environment (Klose
et al., 2006b). Morerecently, also ADAM proteases have been implicated in melanoma progression. Stromal expression of ADAM-15 contributes to melanoma metastases formation (Schönefuß
et al.,2012), whereas stromal expression of ADAM-8 decreased melanoma growth (Guaiquil et al., 2010). Interestingly, also expression of ADAM-9 by the host is required to counteract murine melanoma growth in vivo (Abety et al., 2012).
During the invasive process, tumor cells not only degrade the extracellular matrix, but also
influence the surrounding cells. Via the secretion of growth factors and cytokines or cell-cell
interactions, tumor cells can alter the activities of fibroblasts and inflammatory cells with
9 respect to migration, proliferation and release of additional growth factors and proteases (Zigrino
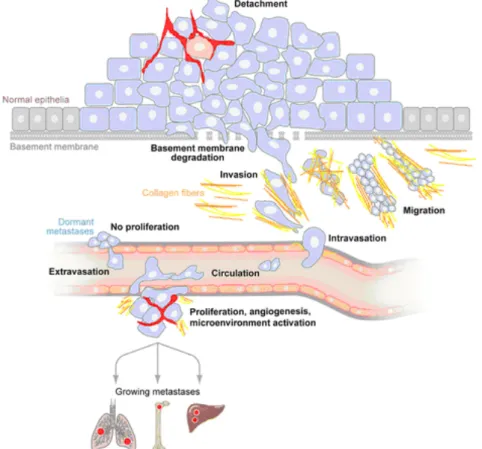
et al., 2005). Tumor cells that left the primary tumor, once migrated into the dermalcompartment can form metastases using three principal routes: The cells can either disseminate via the lymphatic vessels (lymphogenous), the blood vessels (haematogenous) or via migration along visceral cavities (cavitary). The most common routes are the lymphogenous, mainly found in carcinomas, and the hematogenous, predominately occurring in sarcomas (Bacac and Stamenkovic, 2008). In Figure 2 the principal steps of melanoma invasion and metastases formation are summarized.
Figure 2: Principal steps of melanoma invasion and metastases formation. Upon transformation from normal cells into an invasive cancer, cells first loose adherens junctions and detach from the surrounding cells. Subsequentely they degrade the basement membrane and invade into the underlying tissue, penetrate the circulation and are transported to distant organs. Upon attachment to the vessel wall, cells extravasate and adapt to the new microenvironment, where they proliferate and form a metastasis. Some cancer cells have also the ability to be dormant in the invaded tissue for a long period of time before they begin to proliferate (modified according to: Bacac and Stamenkovic, 2008).
In melanoma the most frequently metastasized organs are the skin, lymph nodes, subcutaneous tissues, lung, liver, central nervous system and the bone (Leiter et al., 2004).
Attraction of tumor cells to these organs is thought to occur by the interaction of chemokines
with their receptors located on tumor cells. It was for example shown that melanoma cells
express the chemokine receptors CXCR4, CCR7 and CCR10 (Leiter
et al., 2004) and therelease of the respective ligands CXCL12, CCL21 and CCL27 in the lung, lymphatic system
or the skin, respectively contributes to the spreading of metastatic tumor cells to these
10 specific organs (Kakinuma and Hwang, 2006). After the cells have been transported to the target organs, the circulating tumor cells are retained in the target organs mechanically due to size restrictions in small capillaries and/or interact with endothelial cells and transmigrate into the tissue (Chambers et al., 2002; McGary et al., 2002).
1.2 Mouse models to study melanoma
Since the past 50 years different in vivo models for the investigation of the complex biological
processes involved in melanoma have been established. One of the earliest models relied on
the grafting of murine B16 melanoma cells into mice (Fidler and Nicolson, 1976). While this
may represent a syngeneic system when using C57BL6 mice, xenogeneic models are also
available and in these cells from a different species are injected (human cells into a mouse),
requiring the use of immunodeficient mice to prevent cell rejection by the immune system
(Becker
et al., 2010). Since syngeneic models are often used to study melanomaimmunology, xenogeneic models are employed to determine the behaviour of melanoma
cells with respect to their invasiveness, metastatic potential or the role of melanoma stem
cells. In contrast to transplantation models, genetically modified animals are largely used to
analyze melanomagenesis (Becker
et al., 2010). Currently several genetic models areavailable, in which mutations lead to spontaneous melanoma development after a period of
latency and/or after physical or chemical treatment of the animals with UV light or
carcinogens, e.g. 7,12-dimethylbenzanthracene (DMBA) (Larue and Beermann, 2007). One
of these models is the hepatocyte growth factor overexpressing / cyclin dependent kinase 4
knock-in mutant (HGF/CDK4) mouse model. The HGF/CDK4 mice carry a mutation in the
CDK4 gene (Cdk4R24C), which was knocked into the germline. This mutation creates an
altered binding pocket for p16
Ink4a, the most important inhibitor for CDK4, and renders the
CDK4 protein insensitive to inhibition by p16
Ink4aresulting in a constitutively active CDK4 and
impaired control of the G
1phase of the cell cycle (Tormo
et al., 2006). The Cdk4R24Cmutation, which functions as a dominant negative oncogene was also observed in some
cases of sporadic and hereditary melanomas in humans (Zuo et al., 1996). It was shown that
melanoma cells, but not normal melanocytes, express HGF and c-met, leading to constitutive
autocrine activation of the MAPK and PI3K pathway (Li
et al., 2001). In human melanomaspecimen c-met expression correlated with melanoma growth and metastatic spread (Cruz et
al., 2003) and the HGF was shown to stimulate the proliferation of melanocytes (Hirobe et al., 2004). In the HGF/CDK4 mouse model, different from wild-type mice, but similar to thehuman situation, melanocytes are not only located in the hair follicels and the dermis, but
also in the basal layer of the epidermis and the dermo-epidermal junction. These mice
develop melanomas spontaneously after about eight-to-ten month after birth and tumor
formation can also by promoted by treatment with DMBA. The spontaneous as well as
induced tumors recapitulate the histopathology of human melanoma and metastasize to the
11 lymph nodes and lungs (Tormo
et al., 2006; Landsberg et al., 2010). Moreover melanomaformation can also be induced in these animals by neonatal UVB treatment, which closely mimics the human situation (Gaffal et al., 2011).
For the sake of completeness it should be mentioned that several other transgenic models exist, which develop melanomas after carcinogen treatment as well as spontaneously. These mice carry different mutated genes under the control of melanocyte specific promoters. For example one widely used model is the transgenic overexpression of mutated NRAS or HRAS genes under the control of a melanocyte specific tyrosinase promoter (Walker and Hayward;
2002; Larue and Beermann, 2007).
1.3 ADAM proteases
1.3.1 StructureThe protein family of the ADAMs are multidomain type I transmembrane glycoproteins, which belong to the adamalysin family of proteins a subgroup of the metzincin zinc metalloproteases (Wolfsberg et al., 1995). To date 40 ADAMs have been identified in various species from human (23 ADAMs) and mice (33) to
Xenopus laevis (6) and Drosophila melanogaster (2) (Blobel, 2005).ADAMs exhibit a conserved domain structure containing a pro- and a metalloprotease domain, a disintegrin-like and a cysteine-rich domain. Additionally most ADAMs also contain an EGF-like domain and a short cytoplasmic tail (Edwards et al., 2008). Only 13 of the known 23 human ADAMs are suggested to be proteolytically active (Edwards
et al., 2008) as theycontain an HExxHxxGxxH….M motif with three histidine residues binding the zinc ion in the metalloprotease domain and an invariant methionin turn in the active site (Murphy, 2008).
The inactive state of the ADAMs is maintained by the interaction of a cysteine residue located in the prodomain with the zinc ion in the catalytic site of the metalloprotease domain (Edwards et al., 2008). Enzyme activation is achieved by removal of the prodomain mediated via proprotein-convertases such as furin or by autocatalytic processing, by which the prodomain is cleaved off in the Golgi network (Blobel, 2005). This process is called the
“cysteine switch mechanism”. Furthermore, the released prodomain functions as a
chaperone mediating correct protein folding (Edwards
et al., 2008). Once activated themetalloprotease domain exhibits proteolytic activity towards extracellular matrix proteins
(Mochizuki and Okada, 2007) and acts as sheddase for many cell surface bound molecules
activating and liberating them from the cell membrane. This leads to the induction of signals
in auto- and paracrine manner (Blobel, 2005; Mochizuki and Okada, 2007). The disintegrin
and the cysteine-rich domains can mediate cell-cell and cell-matrix interactions, via binding
to integrins or heparansulfate proteoglycans, e.g syndecans (Edwards
et al., 2008). Thecytoplasmic domain of the individual ADAMs is highly variable, but the majority contains
signalling motifs, such as phosphorylation sites for serine-threonine or tyrosine kinases and
12 proline rich regions, which bind Src-homolgy-3 (SH-3) domain containing proteins important for signal transduction (Edwards
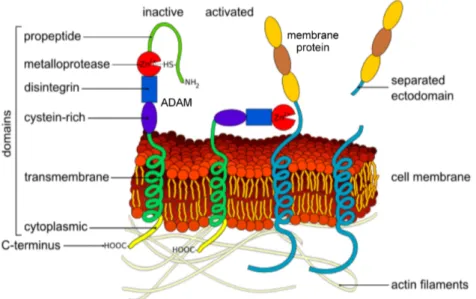
et al., 2008). In Figure 3 the structure of the ADAMs ininactive and active state is illustrated.
Figure 3: Structure of ADAMs and ectodomain shedding. The general structure of the ADAM proteases with the C-terminal cytoplasmic tail, the transmembrane domain, the cysteine-rich, the disintegrin, the metalloprotease and the prodomain is shown. The metalloprotease domain contains a zinc ion in the catalytic site, which binds to a cysteine residue located in the prodomain keeping the protein in a latent state. In the trans-Golgi network the prodomain is removed leading to the activation of the protein (modified according to: http://en.wikipedia.org/wiki/File:Ectodomain_shedding_en.svg).
1.3.2 Regulation
The ADAM proteases can be regulated on transcriptional as well as on posttranscriptional
level. The interaction of the cytoplasmic tail with intracellular proteins might be important for
the localization and activation of the ADAMs (Edwards
et al., 2008). Thus for examplephosphorylation of the cytoplasmic tail of ADAM-17 by extracellular signal related kinase
(ERK) induces translation of ADAM-17 to the cell surface (Soond
et al., 2005). Otherposttranscriptional control points for ADAM activity include regulation on the level of the
zymogen activation and by interaction with tissue inhibitors of metalloproteinases (TIMPs)
(Mochizuki and Okada, 2007). In contrast to the MMPs, ADAMs are only selectively inhibited
by TIMPs, thus for example ADAM-17 is exclusively inhibited by TIMP-3 and ADAM-10 can
be inhibited by TIMP-1 and -3, but not TIMP-2 and -4 (Amour
et al., 1998; Amour et al.,2000). Other ADAMs, like ADAM-8 and -9, are not sensitive to inhibition by TIMPs (Amour et
al., 2002). Apart form the posttranscriptional regulation, ADAMs can also be regulated ongene expression level. It was shown that the estrogen receptor can bind to the ADAM-9
promotor region, thereby acting as a transcription factor (Cong and Jia, 2009). ADAM-17
expression was induced by the transcription factor Sp1 in glioma cells (Szalad et al., 2009)
and TGF-β can induce ADAM-12 expression by degradation of the transcriptional repressor
SnoN (Solomon et al., 2010).
13
1.3.3 ADAM function in physiology and pathologyDue to their multidomain structure, physiologically ADAMs are involved in various cellular processes such as cell proliferation, adhesion, migration and signalling (Rocks et al., 2008).
The first ADAMs, which have been described were ADAMs 1 and 2 and were identified in the testis as molecules mediating the fusion of sperm and egg (Wolfsberg et al., 1995). Beside their function in fertilization, ADAMs contribute to proliferation, angio-, neuro and myogenesis, by their ability to mediate cellular interactions leading for instance to cell fusion or by shedding of surface molecules, which can induce para- and autocrine signalling (Edwards
et al., 2008). ADAM-17 was described as the major sheddase for pro tumornecrosis factor-
α(TNF-
α) (Black et al., 1997), inducing paracrine TNF-α signalling, which for instance is crucial for adult myogenesis (Liu
et al., 2010). ADAM-9 and ADAM-17 can shedheparin binding-hepatocyte growth factor (HB-EGF), which can induce proliferation and was for example shown to be important for heart development (Jackson
et al., 2003). Themechanism, by which ADAM mediated activation of the EGF receptor is achieved, is called
“triple membrane-passing signalling” (Blobel, 2005). This includes the activation of a membrane bound ADAM by ligand binding to a G-protein-coupled-receptor (GPCR), inducing intracellular signalling molecules, which phosphorylate the cytoplasmic domain of ADAMs, leading to their activation and subsequent shedding of ligands for the EGFR (Blobel, 2005).
Another process, in which ADAM mediated shedding of surface molecules, plays an important role is called “regulated intramembrane proteolysis” (RIP). This process is defined as a sequential proteolytic cascade, which includes an initial shedding of the ectodomain of a transmembrane protein by an ADAM and a second cleavage in the membrane itself by another enzyme, generating an intracellular fragment, which can induce other intracellular events (Edwards
et al., 2008; Murphy, 2008). The classical examples for RIP are theprocessing of amyloid-precursor-protein (APP) and Notch signalling (Edwards et al., 2008). It was shown that ADAM-10 and -17 cleave the extracellular domain of Notch, when it is bound to ligands like Delta or Jagged, followed by subsequent intramembrane processing of Notch by
γ-secretase activity. This process is particularly important in neurogenesis (Bray, 2006).Similarly APP is processed by
α-secretase activity of ADAM-9, -10 and -17, followed bysequential cleavages by
β- and γ-secretases (Edwards et al., 2008). Also the adhesivefunctions of the ADAMs contribute to biological processes, like the involvement of ADAM-8 in neuron-glia interactions or the binding of ADAM-12 to integrins, which leads to cell differentiation during muscle development (Schlomann et al., 2000; Lafuste et al., 2005).
In various studies it has been shown that members of the ADAM family of proteases play a
role in cancer. ADAMs can promote tumor cell adhesion and migration, shown for example
for ADAM-12 (Iba
et al., 1999). In addition, ADAMs exhibit enzymatic activity towardsextracellular matrix proteins as shown for the cleavage of type IV collagen by ADAM-10 and
14 ADAM-15, whereas ADAM-12 can degrade in addition also fibronectin (Mochizuki and Okada, 2007). Even though the relevance of these activities for the in vivo situation has not been clarified, one can envision that all these activities may contribute to migration through tissues. Furthermore, ADAMs can shed as well as bind to cell adhesion molecules, which mediate tumor cell interactions with the vasculature, like selectins and VCAM-1 (Murphy, 2008). ADAM proteases are also involved in the inflammatory reaction, which accompanies cancer progression. Hence ADAM-9 and -17 are able to shed ligands of the activating natural killer cell receptor, NKG2D, like major histocompatibility complex chain 1 related proteins, MICA and MICB, from the tumor cell surface, leading to escape from NKG2D-mediated tumor immunosurveillance (Waldhauer et al., 2008; Kogha et al., 2009).
1.4 Current knowledge on ADAM-9 function in physiology and pathology
ADAM-9 was first identified in 1996 in breast carcinoma (Weskamp et al., 1996). The protein is produced as a 110kDa glycosylated proprotein, which is activated in the Golgi apparatus by furin activity to the 85kDa mature form that is found on the cell surface after prodomain removal (Roghani
et al., 1999). As some other members of the ADAM family, in addition toits membrane bound form, ADAM-9 exists also as soluble form derived either from a deletion in the EGF-like domain creating an early stop codon or from alternative splicing (Hotoda et
al., 2002; Mazzocca et al., 2005). The protein is ubiquitously expressed, however ADAM-9deficient mice show no obvious phenotype and develop normally (Weskamp et al., 2002). In adult animals at 20 month after birth, retinal degeneration appeared (Parry
et al., 2009). In vitro proteolytic activity of ADAM-9 was shown towards various proteins like EGF (epidermalgrowth factor), FGFR2iiib (fibroblast growth factor receptor2 iiib), a murine variant of the human FGFR2, type XVII collagen or EphB4 (ephrin type-B receptor 4) (Peduto, 2009). The shedding of FGFR2iiib for example has been shown to be relevant for the regulation of growth factor signalling during pathological events such as prostate cancer development (Peduto
et al., 2005). In vivo, shedding of type XVII collagen by ADAM-9 modulatedkeratinocyte migration during skin repair (Mauch
et al., 2010). ADAM-9 is also able todegrade extracellular matrix proteins such as fibronectin, gelatin and laminin 111
in vitro(Schlöndorff and Blobel, 1999; Schwettmann
et al., 2001). Due to the presence of thedisintegrin domain ADAM-9 provides also adhesive functions. The adhesive activity of ADAM-9 to integrin receptors has been shown by several
in vitro studies, showing a cell–type specificity. Thus for example binding to
α2β1 integrins was observed in activated stellate cells, but to the
α3β1 integrin in keratinocytes and fibroblasts (Mazzocca et al., 2005;
Zigrino et al., 2007; Zigrino et al., 2011). Furthermore in vitro studies showed that membrane
bound ADAM-9 suppresses, whereas the soluble from promoted breast cancer cell migration
(Fry et al., 2010).
15
In vitro studies revealed that among several environmental factors, IL-1α and fibrillar type Icollagen regulate the expression of ADAM-9 in melanoma cells (Zigrino
et al., 2005).Additional studies have also identified reactive oxygen species as regulators of ADAM-9 expression in prostate cancer cells (Sung et al., 2006) and in myeloma cells (Fischer et al., 2004). Recently several studies showed that ADAM-9 expression in hepatocellular carcinoma and pancreatic cancer cells is also regulated by microRNAs (Zhou
et al., 2011;Kim et al., 2011; Hamada et al., 2011).
Several authors detected increased expression of ADAM-9 in different cancers including breast, intestinal, renal and prostate cancer (Lendeckel
et al., 2005; Sung et al., 2006;Fritzsche
et al., 2008) suggesting a role for ADAM-9 in cancerous processes. In prostatecancer ADAM-9 expression was associated with shorter relapse-free survival of patients (Fritzsche et al., 2008) and in agreement with these results in animals lacking expression of ADAM-9, development of aggressive prostate tumors was reduced (Peduto
et al.,2005).
Various melanoma cell lines also express ADAM-9 and
in vivo itis expressed in primary human melanomas in both, the peripheral parts of the tumor and in stroma cells adjacent to the tumor border, whereas little if any expression was detected in metastases (Zigrino et al., 2005).
In vivo, the role of ADAM-9 in melanoma development is controversial beingdescribed as both a tumor suppressor and promoter in mouse studies (Guaiquil et al., 2009;
Abety
et al., 2012). Microarray analysis of human melanoma revealed an association ofADAM-9 expression with melanoma progression (Alonso
et al., 2007). Thus the functionalrole of ADAM-9 in melanoma is presently unclear.
16 1.5 Aims of the thesis
ADAM-9 is expressed in human melanoma cell lines and in tumor cells located at the tumor- stroma border (Zigrino
et al., 2005). Stromal expression of ADAM-9 influences melanomagrowth
in vivo (Abety et al., 2012), however the function of ADAM-9 expression in themelanoma cells remains unclear. The overall aim of this thesis is to elucidate the role of ADAM-9 produced by melanoma cells for tumor growth, invasion and metastases formation.
To first study the function of ADAM-9 expression in melanoma cells for these processes
in vitro, ADAM-9 expression in melanoma cells will be stably down-regulated using shRNA.This strategy allows to perform long-term experiments in vitro and to investigate proliferation and invasiveness of melanoma cells in an
in vivo like system. According to the knownfunction of ADAM-9 as an adhesive and proteolytic molecule, besides key processes for melanoma progression, like proliferation and invasion, further investigations are aimed to address melanoma cell adhesion, migration and matrix proteolysis, cellular processes also contributing to melanoma progression.
To answer the question what is the function of melanoma-cell derived ADAM-9 for
melanomagenesis and progression
in vivo, ADAM-9-/-mice are planned to crossbred with
HGF/CDK4 double mutant transgenic mice, which develop spontaneous melanomas and
closely resemble human tumors (Tormo
et al., 2006). These animals can be treated withDMBA to induce tumor growth and to monitor melanoma development and metastases
formation in the absence of ADAM-9. These analyses will clarify if ADAM-9 participates in
any of these processes and further investigations will help to unreveal underlying cellular and
molecular mechanisms by which ADAM-9 contributes to melanoma formation and
progression. On the one hand it is important to understand the function of melanoma-derived
ADAM-9 in all processes involved in melanoma formation, but it is equally important to
understand how this protein is regulated in these processes. The cytokine IL-1α, which is
expressed in high amounts intracellularly and as well as secreted protein by melanoma cells
(Löffek et al., 2005; Apte et al., 2006), was indicated as one key regulatory factor of ADAM-9
expression in melanoma cell lines (Zigrino
et al., 2005). Thus we hypothesized that thereexists a threshold of this cytokine above which ADAM-9 is down-regulated and vice versa in
these cells. To prove this hypothesis and to understand the molecular events leading to the
regulation of the expression and activity of ADAM-9 in melanoma cells the intracellular
pathways mediating regulation of ADAM-9 by either exogenous as well as intracellular IL-α
will also be analyzed. For this purpose the effect of exogenously added IL-1
αwill be
investigated using a pharmacological approach by inhibiting downstream mediators of the IL-
1α signalling pathway (JNK, NFκB). To investigate the intracellular pools, high invasive
melanoma cells, in which IL-1
αexpression was stably down-regulated, will be used.
17 2. Material and Methods
2.1 Material
2.1.1 ChemicalsAll chemicals were purchased in analytical grade from Roth (Karlsruhe, Germany), Sigma Aldrich (München, Germany), Merck (Darmstadt, Germany), GIBCO (Karlsruhe, Germany) and Perbio (Lausanne, Switzerland).
Tissue-Tek
®(Polyvinyl alcohol < 11%, carbowax< 5%, nonreactive ingredients 85% was purchased from Sakura, Zoeterwoude, Netherlands. RNA inhibitors, Oligod(T)
16primers primers and MuLV reverse transcriptase were used from Applied Biosciences (Foster City, CA, USA); dNTPs were purchased from Roche (Mannheim, Germany).
Molecular weight markers for proteins, PageRuler
TMPlusPrestained Protein ladder and PageRuler
TMUnstained Protein ladder were from Fermentas (St. Leon-Roth, Germany). DNA marker, 100bp DNA ladder were from NEB (Frankfurt/Main, Germany). The indirubin derivates SL-22, SL-85 and KD-65 were synthesized in the Department for Organic Chemistry at the University of Rostock and were a kind gift of Prof. Manfred Kunz.
2.1.2 Recombinant and purified proteins
Human recombinant or purified proteins used are summarized in Table 1.
Table 1: Human recombinant and purified proteins.
Human protein Source Application
rec. ADAM-9 R&D Systems enzymatic assay
rec. collagen I BD Biosciences enzymatic assay
rec. collagen IV BD Biosciences adhesion, enzymatic
assay, migration
rec. fibronectin R&D Systems migration,
enzymatic assay laminin 332, isolated from
foreskin kerationcytes Immundiagnostik adhesion, enzymatic assay, migration rec. laminin β3-chain
Prof. M. Koch, Institute for Experimental Dental Medicine and Oral Muscoskeletal Biology,
Cologne
enzymatic assay
rec. laminin 511 BioLamina enzymatic assay
matrigel BD Biosciences adhesion, migration
2.1.3 Cell culture material
Plastic ware for cell culture was purchased from Greiner (Nürtingen, Germany), TPP
(Trasadingen, Switzerland) and BD Biosciences (Heidelberg, Germany). Cell culture medium
was purchased from PAA (RPMI, Cölbe, Germany) and GIBCO (DMEM, Karlsruhe,
Germany). Antibiotics (Penicillin/Streptomycin) and L-Glutamine were from Biochrom (Berlin,
Germany), FCS and non-essential amino acids from PAA (Cölbe, Germany).
18
2.1.4 Consumable materialsCL-XPosure
TMX-Ray exposure films Thermo Fischer Scientific Cryomolds (standard, intermediate) Sakura
Embedding cassettes KABE Labortechnik
Eppendorf tubes (1.5 ml, 2 ml) Eppendorf
PCR tubes (0.5 ml) peQlabBiotechnologie
Microscopic slides Menzel
Microscopic coverslips, ø 12 mm Assistent
®Nitrocellulose membrane AmershamBioscience
Syringes and needles BD Biosciences
Whatman paper VWR
2.1.5 Buffers and solutions
Anode Buffer I Tris 0.3M, 20% methanol
Anode Buffer II Tris 25mM, 20% methanol
Cathode Buffer 6-Aminohexan acid 40mM, 20% methanol
DEPC-treated H
2O H
2O, 0.1% DEPC
DNA extraction buffer 50mM Tris base, pH 8.0, 100mM EDTA, 100mM NaCl, 1%SDS
FACS buffer PBS, 1% BSA, 2mM EDTA
Laemmli reducing loading 60mM Tris-HCl pH 6.8, 2% SDS, 0.1%
bromphenolblue buffer 25% glycerol, 14.4mM 2-mercaptoethanol
PBS 137mM NaCl, 2.7mM KCl, 8.4mM Na
2HPO
4,
1.4mM KH
2HPO
4, pH 7.4
PBST 0.5% Tween/PBS
Ponceau Red solution 0.1% Ponceau S (w/v) in 5% acetic acid (v/v) Running Buffer (PAGE) 250mM Tris base, 0.2M glycin, 1%SDS, pH 8.3
RIPA Buffer 150mM NaCl, 0.5% sodium deoxycholate, 2%
SDS, 1%NP40, 50mM Tris pH 7.4
Substrate buffer 25mM Tris, 2.5µM ZnCl
2, 0.005% Brij-35, pH 9.0
TBE 90mM Tris, 20mM Na
2EDTA, 90mM boric acid pH 8.0
2.1.6 DevicesAgarose gel electrophoresis Easy-Cast Electrophoresis System Model 2B, Owl Scientific Model 40-0911,
peQlabBiotechnologie
Cell counter CASY
®device model TT
Cell incubators HERAcell 150i CO
2-incubator,
Thermo Fisher Scientific
19
Centrifuges Eppendorf Centrifuge 5415 R, Eppendorf
Centrifuge 5415 C, HeraeusSepatechMegafuge 1.0
Cool plate Thermo Shandon
Cryostat Microm HM 650
ELISA MicroPlate Reader 1420 Multilabel Counter, VICTOR
3TM, Perkin Elmer
Flow cytometer FACSCalibur flow cytometer, BD Biosciences
Microscopes Leica DM 4000 B, Nikon Eclipse TS100, Nikon
Eclipse E800, Olympus IX81
Microtome Thermo Shandon Finesse microtome
pH-meter WTW inolab pH level 1
Photometer Eppendorf Bio Photometer, Eppendorf
Real-time PCR 7300 Real-time PCR System, Step One Plus
Real-time PCR System, Applied Biosystem
Shaker KS 250 basic, KIKA Labortechnik
Sterile hoods Lamin Air 2448, Heraeus Instruments
Safa 2020, Thermo Fischer Scientific
Thermocycler T3 Thermocycler, Biometra
Thermomixer EppendorfThermomixer 5437, TS 100
Thermoshaker
Water bath GFL, Julabu SW-20C
Western Blot equipment Mighty Small II SE 250, Hoefer Scientific Instruments
X-Ray film development Curix 60 developing machine, AGFA
2.1.7 Software
Adobe Photoshop 7.0
BD CellQuest Pro, BD Biosciences CellR
®Imaging Software, Olympus Diskus 4.50, Hilgers
Graph Pad Prism 4.03
Image J 1.41(http://rsb.info.nih.gov./ij) NIS-Elements AR 2.30, NIS-Elements
Step One
TMSoftware v2.1, Applied Biosystems
20 2.2 Methods
2.2.1 Cell culture
2.2.1.1 Melanoma cell lines
The human melanoma cell lines Skmel23, Skmel28, WM164/4, IF6, BLM, MeWo, VMM5, WM75/6, A375, Ma-Mel-86a and Ma-Mel-119 were used. In Table 2 the invasive capacities of the different cell lines including references are shown. All cell lines were cultured in RPMI 1640 medium containing 10% FCS, 1% non-essential amino acids, 2% L-Glutamine, Penicillin/Streptomycin (100U/ml) (normal growth medium). Additionally, the murine melanoma cell line B16-F1 (Fiedler and Nicolson, 1976), which was stably transfected with GFP was used (Zigrino
et al., 2009). These cells were cultured in DMEM mediumsupplemented with 10% FCS, Penicillin/Streptomycin (100 U/ml) and 800µg/ml G-418 (PAA, Cölbe, Germany). All cells were cultured at 37°C and 5% CO
2in humidified atmosphere.
Cells were passaged at a ratio of 1:5 twice per week. Confluent cells were detached by incubation in Trypsin/EDTA (1% Trypsin/ 2.5% EDTA) and seeded in normal growth medium.
Table 2: Information about the used human melanoma cell lines.
Cell line Invasive capacity
in vivo Origin References
A375 high Primary
melanoma
Giard, et al., 1973 Kozlowski et al., 1984
Luca et al., 1995
BLM high Lung
metastasis
Lockshin et al.,1985 Van Muijen et al.,1991
IF6 low Lymph node
metastasis Van Muijen et al., 1991 Ma-Mel-86a not tested Lymph node
metastasis
Ugurel et al., 2007 Schwinn et al., 2003
Ma-Mel-119 not tested Skin metastasis Ugurel et al., 2007
MeWo high Lymph node
metastasis
Carey et al., 1976 Ishikawa et al., 1988a Ishikawa et al., 1988b Welch et al., 1991
Skmel23 low Primary
melanoma Carey et al., 1976
Skmel28 low Primary
melanoma
Carey et al., 1976 Luca et al., 1995
VMM5 high
(in collagen I matrix)
Metastatic
melanoma Benbow et al., 2002
WM164/4 low Melanoma
metastasis Herlyn, D. et al., 1990
WM75/6 not tested Primary
melanoma Herlyn, M. et al., 1985
21
2.2.1.2 Endothelial cell linesThe mouse endothelial cell line sEND-1, which was originally isolated from middle T oncogene of polyoma virus induced hemangiomas (Williams
et al., 1988), was cultured inDMEM medium supplemented with 10% FCS and Penicillin/Streptomycin (100U/ml) and sub- cultivated in a ratio of 1:5 two times per week by incubation in Trypsin/EDTA (1% Trypsin/
2.5% EDTA) and reseeding in normal growth medium.
2.2.1.3 Isolation and culture of primary human dermal fibroblasts
Primary dermal human fibroblasts were isolated from human skin obtained during surgeries in the Clinic for Dermatology and Venerology, University of Cologne. All samples were taken with the patients consent and approved by the local ethic committee (Ethikantrag: 08-144).
Directly after the preparation by the surgeon the skin was freed from fat tissue and cut in ~ 5 x 5mm small pieces. These pieces were adhered to the bottom of a culture flaks and incubated for 2h at 37°C and 5% CO
2in a humidified atmosphere. Cell culture medium (DMEM medium supplemented with 10% FCS and Penicillin/Streptomycin, 100U/ml) was introduced and the skin pieces cultured for two-three weeks until cells migrated out of the tissue. The fibroblasts were further cultured in DMEM medium supplemented with 10% FCS and Penicillin/Streptomycin (100U/ml) and used for experiments in passages two-six.
2.2.1.4 Stimulation of BLM melanoma cells and fibroblasts
For stimulation experiments melanoma cells were seeded in a density of 85,000 cells/cm² in RPMI 1640 medium containing 10% FCS, 1% non-essential amino acids, 2% L-Glutamine, Penicillin/Streptomycin (100U/ml). Human dermal fibroblasts (passages two-six) were seeded with a density of 60,000/cm² in DMEM medium containing 10% FCS and Penicillin/Streptomycin (100U/ml). All cells were grown as monolayer for 24h and washed twice with PBS before stimulation. The cells were stimulated with 10µM of indirubins (chapter 2.1.1) or 10U/ml recombinant human IL-1
α(tebu-bio, Offenbach, Germany) in medium containing 1% FCS. As a control, cells were also treated with 0.001% DMSO, the solvent for the indirubins.
For pharmacological inhibition studies 10µM of the NFκB inhibitor SN50 (Biomol GmbH,
Hamburg, Germany) and 18µM of the JNK inhibitor SP600125 (Biomol GmbH, Hamburg,
Germany) were used. The melanoma cells were incubated for 24h with 10U/ml IL-1α alone
or in combination with one of the inhibitors. Cells incubated with 0.0002% DMSO, the solvent
for SP600125, were used as control. RNA or protein isolation was performed 24h after
stimulation.
22
2.2.1.5 Generation of IL-1α or ADAM-9 silenced stable melanoma cell clonesBLM or B16-F1 melanoma cells were stably transfected with shRNA plasmids targeted to IL- 1α or ADAM-9 by using Lipofectamine
®(Invitrogen, Karlsruhe, Germany) or nucleofection using the Nuleofector
®Technology and the Nucleofector
®Kit V (both Lonza AG, Cologne, Germany), respectively, according to the manufactures instructions. When shRNAs targeted to IL-1
αor ADAM-9 were applied, five different shRNA plasmids provided by SA Biosciences (Frederick, USA) were used for the transfection: one control plasmid containing a scrambled artificial sequence, which does not match any human gene, and four additional plasmids each expressing a different shRNA sequence targeted to different areas of the IL-1
αor ADAM-9 transcript under the control of the U1 promoter. The targeting vector is shown in Figure 4 and the different inserted sequences of the shRNAs are listed in Table 3.
For transfection of B16-F1 cells one control plasmid containing a scrambled artificial sequence, which does not match any mouse gene and a pool of five plasmids expressing different shRNA sequences targeted to ADAM-9 were used. The manufacturer (Santa Cruz, Heidelberg, Gemnay) does not provide the different shRNA sequences. The shRNAs were under the control of a H1 promoter. Two days post transfection BLM melanoma cells were selected using 600µg/ml G-418 (PAA, Cölbe, Germany) and B16-F1 cells using 400ng/ml puromycin (PAA, Cölbe, Germany), added to the normal growth medium (selection medium).
After 14 days in culture under selection pressure, single colonies were isolated with cloning rings and further cultured in selection medium, until enough cells were available for analysis of IL-1α or ADAM-9 expression on mRNA and protein level. The IL-1α clones have been generated within the frame of the diploma thesis of Mrs. Birgit Seyfarth and clones used here, displayed the most efficient down-regulation of IL-1α on mRNA and protein level.
ADAM-9
Number Sequence
1 AAAGCTTCAGTGTGAGAATGT
2 GGAGGAAACTGCCTTCTTAAT
3 AGATGATTCTCCTGGCAAACT
4 TCAACTGTGGAGAAGCTACTT
Control GGAATCTCATTCGATGCATAC IL-1α
Number Sequence
1 GGCTGCTGCATTACATAATCT
2 CTCCTCTTCTTCTGGGAAACT
3 TGACTCGAGGAAGAAATCAT
4 GCCCATCCAAACTTGTTTATT Control GGAATCTCATTCGATGCATAC Table 3: Sequences of the four different shRNAs targeted to human ADAM-9 or IL-1α and the scram- bled control sequence.
!
Figure 4: pGeneClipTM Neomycin vector carrying the shRNA sequen- ces.
!
23
2.2.1.6 Cell area and volume determinationFor measurement of cell area, 35,000 cells/cm² were plated on 100mm plastic petri dishes and grown for 24h to about 60% confluence in selection medium. Images (200x magnification) of the cells were captured with a Nikon Eclipse TS100 microscope connected to a Nikon DS-Fi1 camera. The cell area of 50 single grown cells of each clone was measured with the ImageJ program (http://rsb.info.nih.gov./ij).
To quantify the cellular volume of ADAM-9 down-regulated or control cells 35,000 cells/cm² were seeded on 100mm plastic petri dishes in selection medium and cultured for three days until the cells were confluent. The cells were detached with Trypsin/EDTA (1% Trypsin/2.5%
EDTA) and centrifuged at 100g for 5min at room temperature (RT). After centrifugation the cell pellet was resuspended in 10ml selection medium and 100µl of the cell suspension was diluted in 10ml isotonic NaCl solution. In this suspension cellular volume was determined using the CASY
®device model TT (Schärfe System, Reutlingen, Germany). For each sample cell volume was determined in triplicate.
For aquaporin inhibition studies, the cells were detached (1% Trypsin/2.5% EDTA) and centrifuged at 100g for 5min at RT. Afterwards the cells were resuspended in selection medium supplemented with 0.15mM mercuric chloride (HgCl
2; Sigma Aldrich, München, Germany) and incubated at RT for 1h. Subsequently cell volume was determined as described above.
2.2.1.7 Proliferation Assay