Hox-C9 activates the intrinsic pathway of apoptosis and is associated with spontaneous regression in
neuroblastoma
Inaugural Dissertation
zur
Erlangung des Doktorgrades Dr. nat. med.
der Medizinischen Fakultät und
der Mathematisch Naturwissenschaftlichen Fakultät der Universität zu Köln
vorgelegt von
Dipl. Biol. Hayriye Kocak aus Lauf a. d. Pegnitz
Köln, 2013
Berichterstatter: Prof. Dr. Roman Thomas
Prof. Dr. Matthias Hammerschmidt
Tag der letzten mündlichen Prüfung: 19. 12. 2013
Zusammenfassung __________________________________________________________ I Summary _________________________________________________________________III 1. Introduction _____________________________________________________________ 1 1.1 Neuroblastoma _____________________________________________________________ 1
1.1.1 International Neuroblastoma Staging System (INSS) ____________________________________ 2 1.1.2 Neuroblastoma risk stratification ____________________________________________________ 3 1.1.3 Molecular biology of neuroblastoma _________________________________________________ 5 1.1.3.1 MYCN amplification __________________________________________________________ 5 1.1.3.2 ALK amplification and activating mutations ________________________________________ 6 1.1.3.3 Chromosome 1p deletion ______________________________________________________ 6 1.1.3.4 Chromosome 11q deletion _____________________________________________________ 7 1.1.3.5 Chromosome 17q gain ________________________________________________________ 7 1.1.3.6 DNA index _________________________________________________________________ 7 1.1.3.7 Aberrant gene expression ______________________________________________________ 8 1.1.4 Hereditary neuroblastoma __________________________________________________________ 9 1.1.5 Origin of neuroblastoma ___________________________________________________________ 9 1.1.6 Spontaneous regression and differentiation in neuroblastoma _____________________________ 12 1.2 Homeobox genes ___________________________________________________________ 13
1.2.1 HOX gene expression ____________________________________________________________ 14 1.2.2 Hox cofactors __________________________________________________________________ 15 1.2.3 HOX genes in human diseases _____________________________________________________ 16 1.2.3.1 HOX genes in cancer _________________________________________________________ 16 1.2.3.2 HOX genes in neuroblastoma __________________________________________________ 19 1.2.4 HOXC9 gene expression in development and tumorigenesis ______________________________ 20
2 Aim of the study _______________________________________________________ 22 3 Materials and Methods __________________________________________________ 23 3.1 Microarrays and data analysis ________________________________________________ 23
3.1.1 Neuroblastoma patient characteristics _______________________________________________ 23 3.1.2 Gene expression arrays ___________________________________________________________ 24 3.1.2.1 Analysis of gene expression data _______________________________________________ 25 3.1.2.2 HOX gene expression-based classification ________________________________________ 25 3.1.2.3 Gene Ontology enrichment analyses _____________________________________________ 26 3.1.3 Array-based Comparative Genomic Hybridization _____________________________________ 26 3.2 Statistics __________________________________________________________________ 27 3.3 Cell Culture _______________________________________________________________ 27 3.3.1 Neuroblastoma cell line characteristics ______________________________________________ 28 3.3.2 Stable inducible neuroblastoma cell lines _____________________________________________ 29 3.3.3 In vitro growth properties _________________________________________________________ 29 3.3.3.1 Trypan blue dye exclusion ____________________________________________________ 29 3.3.3.2 Cell cycle distribution ________________________________________________________ 29 3.3.3.3 Anchorage independent growth ________________________________________________ 30 3.3.4 Cell viability analyses ____________________________________________________________ 31 3.3.4.1 TUNEL assay ______________________________________________________________ 31 3.3.4.2 Annexin-V binding assay _____________________________________________________ 32 3.3.4.3 Hypoploidy assay ___________________________________________________________ 33 3.3.5 In vivo growth properties _________________________________________________________ 33 3.4 Molecular Biology __________________________________________________________ 34
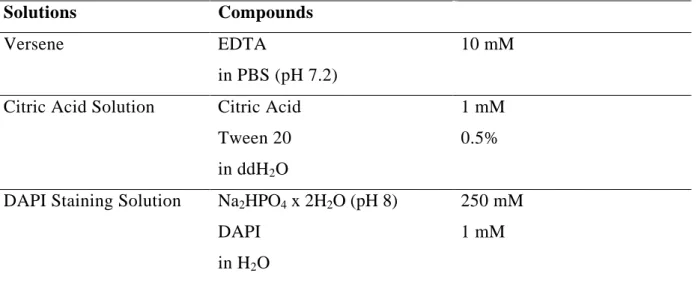
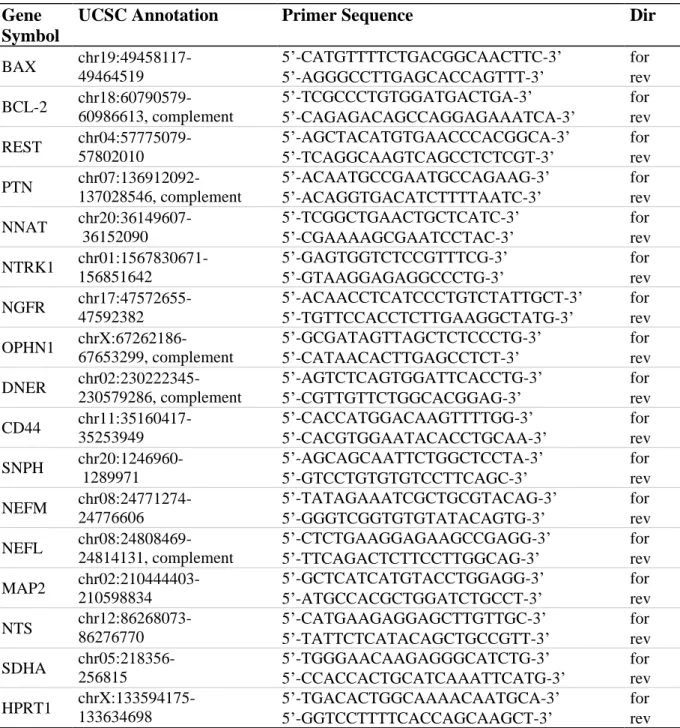
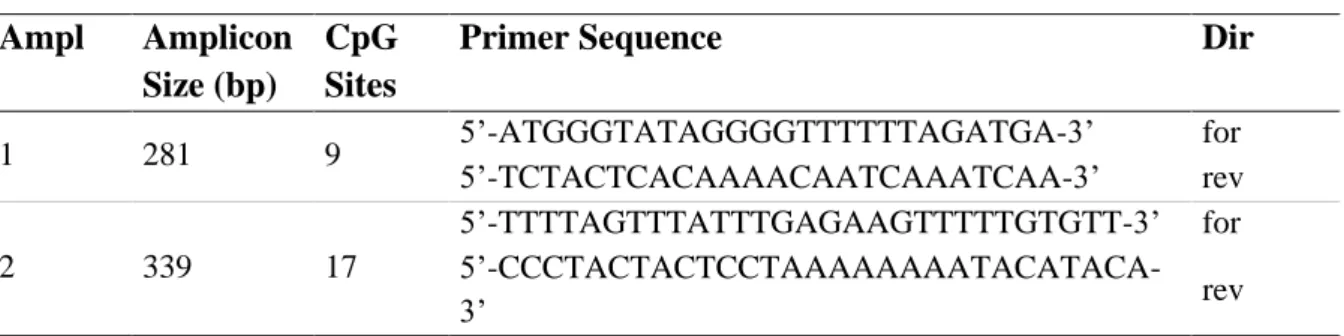
3.4.1 RNA isolation __________________________________________________________________ 34 3.4.2 DNA isolation __________________________________________________________________ 35 3.4.3 cDNA synthesis ________________________________________________________________ 35 3.4.4 Whole Genome Amplification _____________________________________________________ 36 3.4.5 Quantitative real-time reverse transcriptase-polymerase chain reaction ______________________ 36 3.4.6 Methylation analysis _____________________________________________________________ 38
Index
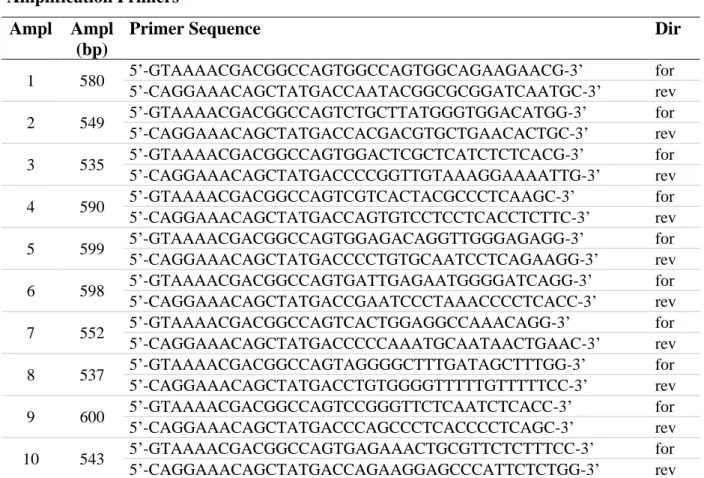
3.4.7.1 Sequencing of the HOXC9 locus in neuroblastoma tumors and cell lines ________________ 39 3.4.7.2 Sequencing of Plasmid DNA __________________________________________________ 40 3.4.8 Retroviral plasmids and cloning procedure ___________________________________________ 41 3.4.9 Immunobloting _________________________________________________________________ 42 3.4.10 Immunofluorescence ___________________________________________________________ 44 3.4.10.1 Hox-C9 immunofluorescence _________________________________________________ 44 3.4.10.2 F-Actin cytoskeleton staining _________________________________________________ 45
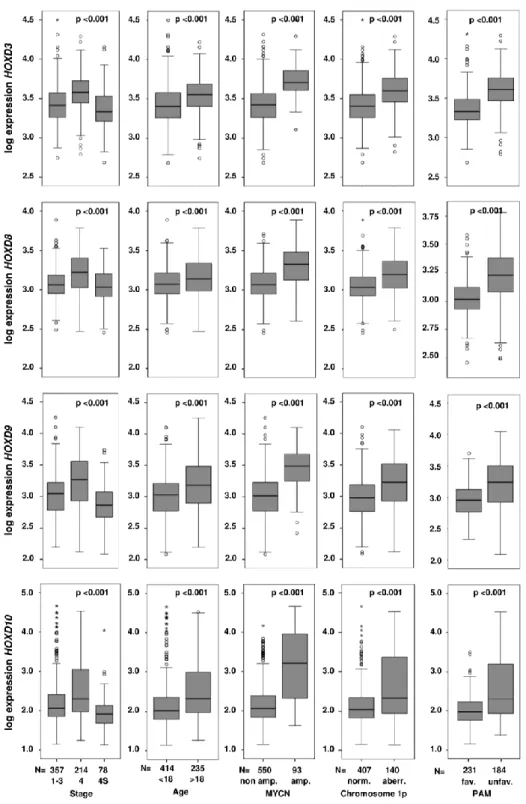
4. Results _________________________________________________________________ 47 4. 1 HOX gene expression in neuroblastoma _______________________________________ 47
4.1.1 Prediction of neuroblastoma outcome based on a HOX gene expression-based classifier ________ 51 4.2 Elevated HOXC9 expression is associated with favorable prognostic markers, beneficial patient outcome and spontaneous regression in neuroblastoma _______________________ 54
4.2.1 Elevated HOXC9 expression is associated with abdominal neuroblastoma ___________________ 57 4.3 Molecular basis for differential expression of HOXC9 in neuroblastoma _____________ 60
4.3.1 Numerical gain of chromosome 12 correlates with elevated expression of HOXC9 ____________ 60 4.3.2 Sequencing of HOXC9 ___________________________________________________________ 61 4.3.3 Methylation pattern of the promoter region of HOXC9 __________________________________ 62 4.4 Functional investigation of HOXC9 in neuroblastoma ____________________________ 64
4.4.1 Doxycycline-inducible expression of HOXC9 in neuroblastoma cell lines ___________________ 64 4.4.2 HOXC9 expression inhibits neuroblastoma cell growth __________________________________ 66 4.4.2.1 HOXC9 expression inhibits growth of neuroblastoma cells in vitro _____________________ 66 4.4.2.2 HOXC9 expression abrogates neuroblastoma tumor growth in vivo_____________________ 68 4.4.3 Hox-C9 induces neuronal differentiation in neuroblastoma _______________________________ 70 4.4.3.1 Hox-C9-induced neuronal differentiation of IMR-32 cells is accompanied by down-regulation of REST ___________________________________________________________________________ 70 4.4.4 HOXC9 re-expression induces apoptosis in neuroblastoma cell lines _______________________ 72 4.4.4.1 Hox-C9 activates the intrinsic pathway of apoptosis ________________________________ 74 4.4.5 HOXC9 expression affects transcriptional pathways regulating differentiation and cell death ____ 76
5 Discussion ______________________________________________________________ 82 5.1 Expression patterns of HOX genes in neuroblastoma _____________________________ 82 5.2 Expression patterns of HOXC9 in neuroblastoma ________________________________ 84 5.3 The functional relevance of HOXC9 expression in neuroblastoma __________________ 85 5.3.1 HOXC9 leads to neuronal differentiation in IMR-32 cells ________________________________ 85 5.3.2 HOXC9 suppresses growth of neuroblastoma cells in vitro and in vivo ______________________ 87 5. 3.3 HOXC9 induces apoptosis in neuroblastoma cells _____________________________________ 87 5.4 HOXC9 expression and the association with spontaneous tumor regression in
neuroblastoma ________________________________________________________________ 88 6 Conclusion ______________________________________________________________ 90 7 References ______________________________________________________________ 91 8 Appendix ______________________________________________________________ 105 8.1 Abbreviations ____________________________________________________________ 105 8.2 List of Figures ____________________________________________________________ 108 8.3 List of Tables _____________________________________________________________ 109 9 Erklärung ______________________________________________________________ 110 10 Danksagung ___________________________________________________________ 112
Zusammenfassung
Das Neuroblastom ist eine maligne Erkrankung des sympathischen Nervensystems und im Kindesalter der häufigste extrakranielle solide Tumor. Die klinischen Verläufe sind vielfältig und reichen von spontaner Regression oder Differenzierung des Tumors bis zu aggressiven, fatalen Verlaufsformen. Unter Berücksichtigung der embryonalen Entwicklung des sympathischen Nervensystems wird eine verzögerte Aktivierung apoptotischer Prozesse als Grundlage der spontanen Regression im Neuroblastom diskutiert. HOX Gene spielen eine entscheidende Rolle bei der embryonalen Entwicklung und sind maßgeblich an den Prozessen der Zelldifferenzierung und Apoptose beteiligt.
In dieser Arbeit wurde anhand eines umfangreichen Datensatzes von 649 Genexpressionsprofilen primärer Neuroblastome gezeigt, dass die Expression einer Mehrzahl der Klasse I HOX Gene signifikant mit klinischen Markern beim Neuroblastom assoziiert ist.
Die prognostische Bedeutung der HOX Gen Expressionsmuster wurde darüber hinaus durch die Beobachtung verdeutlicht, dass eine HOX Gen Expressions-Signatur, unabhängig von den derzeit angewandten Prognosemarkern Alter, Stadium und MYCN-Amplifikationsstatus eine zuverlässige Vorhersage der Krankheitsverläufe im Neuroblastom ermöglicht.
In prognostisch günstigen Neuroblastomen, bei denen es regelhaft zu einer spontanen Regression kommt, wurde eine auffallend hohe HOXC9 Expression detektiert. Um die Bedeutung des Transkriptionsfaktors Hox-C9 für die Pathogenese der unterschiedlichen Krankheitsverläufe des Neuroblastoms zu untersuchen, wurden Tetrazyklin-induzierbare HOXC9-transgene Neuroblastom-Zelllinien generiert.
Die Re-expression von HOXC9 führte zu einer verminderten Zellviabilität und inhibierte das Tumorwachstum in einem Xenograft-Maus-Modell nahezu vollständig. Eine signifikante Zunahme der Sub-G1 Zellfraktion und die Translokation von Phosphatidylserin
Zusammenfassung
auf die Außenseite der Zellmembran deuten auf apoptotische Vorgänge hin. In diesem Zusammenhang wurde nach Hox-C9 Induktion ein erhöhter BAX/BCL-2 Quotient, eine erhöhte Ausschüttung von Cytochrom c aus den Mitochondrien und eine Aktivierung der intrinsichen Caspase Kaskade nachgewiesen. Des Weiteren zeigte sich, dass die Expression von HOXC9 zu einer signifikanten Abnahme der Proliferation in den untersuchten Zelllinien führte, was durch einen Zellzyklusarrest in der G0/G1 Phase erklärt wurde. Soft-Agar Analysen zeigten außerdem eine Einschränkung des kontaktunabhängigen Wachstums nach Hox-C9 Induktion. In einer von drei untersuchten Zelllinien wurde nach Hox-C9 Induktion eine zunehmende morphologische Differenzierung der Neuroblastomazellen detektiert.
Zusammenfassend zeigt diese Arbeit einen starken prognostischen Einfluss von HOX Genen im Neuroblastom im Allgemeinen, und weist auf eine Bedeutung des Transkriptionsfaktors Hox-C9 bei den Prozessen der spontanen Regression des Neuroblastoms hin.
Summary
Neuroblastoma is an embryonal malignancy of the sympathetic nervous system. Spontaneous regression and differentiation of neuroblastoma is observed in a subset of patients, and has been suggested to represent delayed activation of physiologic molecular programs of fetal neuroblasts. Homeobox genes constitute an important family of transcription factors which play a fundamental role in morphogenesis and cell differentiation during embryogenesis.
In this study, I demonstrate that expression of the majority of the human HOX class I homeobox genes is significantly associated with clinical covariates in neuroblastoma using microarray expression data of 649 primary tumors. Moreover, a HOX gene expression-based classifier predicted neuroblastoma patient outcome independently from age, stage and MYCN amplification status. Among all HOX genes, HOXC9 expression was most prominently associated with favorable prognostic markers. Notably, elevated HOX9 expression was significantly associated with spontaneous regression in infant neuroblastoma.
Re-expression of HOXC9 in three neuroblastoma cell lines led to a significant reduction in cell viability, and abrogated tumor growth almost completely in neuroblastoma xenografts. Neuroblastoma growth arrest was related to induction of programmed cell death, as indicated by an increase in the sub-G1 fraction and translocation of phosphatidylserine to the outer membrane. Programmed cell death was associated with a shifted BCL-2/BAX ratio, the release of cytochrome c from the mitochondria into the cytosol, and activation of the intrinsic cascade of caspases, indicating that HOXC9 re-expression triggers the intrinsic apoptotic pathway. Furthermore, re-expression of HOXC9 resulted in a significant reduction of proliferation accompanied by cell cycle arrest in the G0/G1 phase, and decreased colony formation in soft agar. Neuronal differentiation was observed in one out of three cell lines upon HOXC9 re-expression.
Summary
Collectively, the results of my thesis demonstrate a strong prognostic impact of HOX gene expression in neuroblastoma, and point towards a critical role of Hox-C9 in neuroblastoma spontaneous regression.
1. Introduction 1.1 Neuroblastoma
Neuroblastoma, one of the most common malignant solid tumors occurring in infancy and childhood, accounts for 8% of all pediatric cancers (1-3). With a median age of 22 months at diagnosis, neuroblastoma is responsible for 15% of all childhood cancer deaths (4).
Neuroblastoma represents a neuro-ectodermal malignancy derived from fetal precursors of the sympathetic nervous system (5, 6). In the developing embryo, neuroblasts migrate along the neural crest, and populate primarily the sympathetic ganglia and adrenal medulla. The distribution pattern of these cells correlates highly with the sites of primary neuroblastomas and consequently neuroblastomas are most often located in the adrenal medulla or along the sympathetic nervous system chain ganglia. Multiple genetic abnormalities, like chromosomal gains and losses, aneuploidy, and amplification of chromosomal material, are found in neuroblastoma. Age at diagnosis, tumor stage and biological features encountered in neuroblastoma tumor cells are important prognostic factors and in use for risk estimation and treatment stratification. Neuroblastoma shows remarkable variations in clinical presentation ranging from aggressive, therapy-resistant progression to spontaneous regression, which regularly occurs in younger infants with both localized and metastasized disease.
Furthermore, neuroblastoma cells show the potential to differentiate towards a sympathetic ganglion cell phenotype (9). The arrested differentiation of neuroblasts is proposed to be an early event in the pathogenesis of neuroblastoma caused by a disruption of the normal developmental genetic program (7). It has been suggested that in spontaneously regressing neuroblastomas this disruption results in an reversible phenotype, with initial proliferation of immature neural-crest cells followed by a delayed activation of naturally occurring processes of programmed cell death and differentiation (10-12).
Introduction
1.1.1 International Neuroblastoma Staging System (INSS)
Staging of neuroblastoma is performed according to the International Neuroblastoma Staging System (INSS, Table 1) (8). The INSS is based on clinical, radiographic and surgical criteria and is now widely accepted as the standard neuroblastoma staging system.
INSS
Stage Definition
1 Localized tumor with complete gross excision, with or without microscopic residual diseases; representative ipsilateral lymph nodes negative for tumor microscopically (nodes attached to and removed with the primary tumor may be positive).
2A Localized tumor with incomplete gross excision; representative ipsilateral nonadherent lymph nodes negative for tumor microscopically.
2B Localized tumor with or without complete gross excision, with ipsilateral nonadherent lymph nodes positive for tumor. Enlarged contralateral lymph nodes must be negative microscopically.
3 Unresectable unilateral tumor infiltrating across the midline, with or without regional lymph node involvement; or localized unilateral tumor with contralateral regional lymph node involvement; or midline tumor with bilateral extension by infiltration (unresectable) or by lymph node involvement.
The midline is defined as the vertebral column. Tumors originating on one side and acrossing the midline must infiltrate to or beyond the opposite side of the vertebral column.
4 Any primary tumor with dissemination to distant lymph nodes, bone, bone marrow, liver, skin and/or other organs (except as defined as 4S).
4S Localized primary tumor (as defined for stage 1, 2A or 2B), with dissemination limited to skin, liver, and/or bone marrow (limited to infants < 1 year of age).
Marrow involvement in stage 4S should be minimal, i.e., < 10% of total nucleated cells indentified as malignant on bone marrow biopsy or on marrow aspirate. More extensive marrow involvement would be considered to be stage 4. The MIBG scan (if performed) should be negative in marrow.
Table 1: INSS (8).
The INSS distinguishes three localized stages (stage 1-3, collectively approximately 50% of cases) from an unfavorable, disseminated stage (stage 4, approximately 40% of cases). The remaining approximately 10% of patients present with a special form of disseminated disease categorized as stage 4S (“S”, special). Stage 4S diseases were first described by D’Angio et al. (9) and are clinically defined by patients younger than 12 months of age and a restrict pattern of distant metastases to skin, liver and bone marrow. A high percentage of stage 4S patients regress spontaneously or differentiate into benign ganglioneuroma (9).
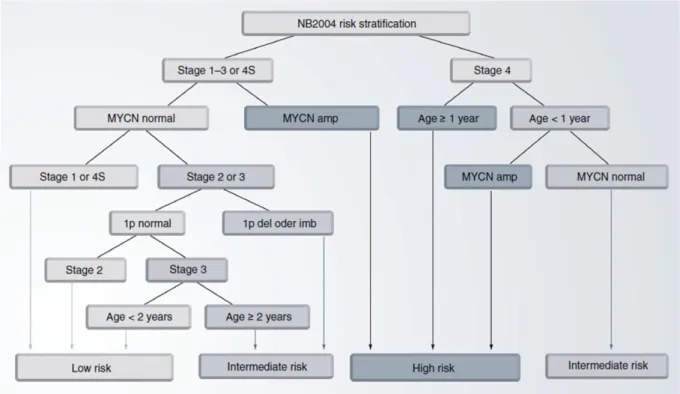
1.1.2 Neuroblastoma risk stratification
Neuroblastoma risk assessment depends on several clinical and biological features. The main goal of neuroblastoma risk stratification is to predict each patients individual risk to die from the disease at diagnosis. To choose the most appropriate form of treatment, the German Neuroblastoma Trial NB2004 categorizes patients into three risk-based groups: low-, intermediate- and high-risk. The NB2004 risk stratification criteria (Figure 1, (10)) include clinical parameters such as tumor stage defined by INSS (8) and patient age at diagnosis, since younger age at diagnosis is significantly associated with better outcome (11, 12).
Furthermore, genetic characteristics like MYCN amplification status (13) and loss of the short arm of chromosome 1 (14) are included as markers of poor outcome in the NB2004 risk stratification criteria. Further markers used in international clinical trials for neuroblastoma risk stratification (15) are histopathologic classification according to the Shimada system (16), allelic loss of chromosomal regions at 11q (14, 17) and DNA ploidy (18, 19).
Introduction
Figure 1: Risk stratification according to the German Neuroblastoma Trial, NB2004 (10).
It has been demonstrated that risk stratification according to NB2004 criteria significantly discriminates neuroblastoma patients with different event-free survival (EFS) and overall survival (OS) (Figure 2, (20)).
Figure 2: Kaplan-Meier estimates for EFS and OS for 428 neuroblastoma patients stratified according to the German neuroblastoma trial NB2004 (10). Abbreviations: LR, low-risk; IR, intermediate-risk;
HR, high-risk.
Despite such complex risk stratification systems, there are some neuroblastoma cases where the individual tumor behavior is not precisely predictable on initial presentation. It has been thus suggested to implement global genetic aberration patterns or gene-expression signatures in risk estimation systems to more accurately predict neuroblastoma patient outcome (20-26).
1.1.3 Molecular biology of neuroblastoma
Clinical heterogeneity is a hallmark of neuroblastoma which is reflected by specific patterns of genetic and transcriptomic abnormalities. The best characterized biological parameters associated with clinical phenotypes are MYCN amplification, ALK amplification and activating mutations, 1p and 11q deletion, unbalanced 17q gain and aberrant gene expression patterns.
1.1.3.1 MYCN amplification
The genetic aberration most consistently associated with advanced disease stage, rapid tumor progression and poor outcome in neuroblastoma, is genomic amplification of the proto- oncogene MYCN (27-29). Amplification of MYCN in neuroblastoma was first described by Schwab et al. in 1983 (30). MYCN is located at chromosome 2p24, and amplification occurs in about 20% of all neuroblastoma cases. MYCN amplification values range between 5- to more than 500-fold, which lead to its overexpression at mRNA and protein level (31-35).
High expression of MYCN in neuroblastoma results in activation of genes associated with aggressive tumor behavior. The exact mechanisms by which MYCN amplification contributes to aggressive tumor biology are still not clarified. The transcription factor N-myc regulates a huge amount of target genes, including transcriptional regulators (36). Many of these genes are involved in development and neuronal differentiation (36), cell proliferation (37), cell cycle (38) and apoptosis (36). However, even though MYCN amplification is strongly
Introduction
associated with high-risk neuroblastomas, more than 60% of patients with aggressive disease do not harbor this amplification.
1.1.3.2 ALK amplification and activating mutations
Anaplastic lymphoma kinase (ALK) is a transmembrane receptor tyrosine kinase preferentially expressed in the central and peripheral nervous system (39). Activating mutations in the tyrosine kinase domain of ALK encode for single base substitutions in key regions of the enzymatic domain and result in constitutive activation of the kinase and a premalignant state. These mutations appear to be responsible for most of the rare cases of hereditary neuroblastomas, and might also be relevant for a smaller fraction of sporadic neuroblastomas (6-9%). A substantial number of primary neuroblastomas (20-25%) present low-level copy number gains at the ALK locus on 2p23 (40-42). High-level genomic amplification of ALK occurs in about 1% of neuroblastoma, and is highly associated with MYCN amplification (43-46).
1.1.3.3 Chromosome 1p deletion
Chromosome 1p36 deletion is a common structural aberration occurring in about 30% of all neuroblastomas. The deletion is variable but consistently encompasses 1p36.1 to 1pter, including a 261 kb region at 1p36.3, which is highly correlated with the amplification of MYCN and advanced diseases stage (47-51). Further, 1p36 deletion is an independent predictor of neuroblastoma progression, and evidence suggests that 1p36 deletion predicts an increased risk of relapse in patients with localized tumors (47-51). Several lines of evidence have led to the hypothesis that this region harbors tumor suppressor genes involved in the development of neuroblastoma. Consequently, several candidate genes were found to be
decreased in expression levels. However, none of these have been proven to be crucial for the pathogenesis of aggressive neuroblastoma (52-55).
1.1.3.4 Chromosome 11q deletion
Allelic loss of 11q occurs in a subgroup of high-risk neuroblastomas accounting for approximately 15-22% of all patients (56-58). The majority of 11q deletions are distal losses encompassing a large portion of the long arm of chromosome 11. Aberrations at 11q are rarely seen in tumors with MYCN amplification, but they remain highly associated with other high-risk features like stage 4 disease, increased age at diagnosis and poor EFS and OS (17, 59). Consequently, the presence of 11q deletions and MYCN amplifications appear to delineate two molecularly distinct subgroups of unfavorable neuroblastoma.
1.1.3.5 Chromosome 17q gain
Unbalanced gain of a long segment at chromosome 17q is found in 54-68% of neuroblastoma patients, thus representing the most frequent structural genomic aberration in neuroblastoma (60-62). Although 17q gains are associated with poor outcome and hence with unfavorable prognostic markers such as stage 4 disease, increased age at diagnosis and other chromosomal aberrations such as MYCN amplification, 1p and 11q loss, the pertinence of 17q gain as an independent prognostic marker for neuroblastoma patient outcome has remained controversial (60, 62).
1.1.3.6 DNA index
DNA ploidy is a well established prognostic marker in several human malignancies, and an aneuploid (hyperdiploid or near-triploid) DNA content is usually an indicator for disease
Introduction
progression and poor outcome. In 1984, Look et al. (19) showed that neuroblastoma represents an exception since aneuploid neuroblastomas are correlated with favorable outcome and a better response to chemotherapy, particular in younger patients (< 12 months).
For neuroblastoma patients older than 1-2 years of age, DNA ploidy loses its prognostic significance (63).
1.1.3.7 Aberrant gene expression
In addition to genomic aberrations, alterations in gene expression have been studied extensively in neuroblastoma (10, 20, 25, 64). Of particular interest are members of the neurotrophin receptor pathways, since the neurotrophin receptors TrkA, TrkB and TrkC together with their ligands NGF, BDNF and NT3 are important regulators of survival, growth, and differentiation of neuronal cells (7). The first report showing elevated TrkA expression in favorable neuroblastomas was presented by Nakagawara and colleagues in 1993 (7). High TrkA expression is associated with favorable prognostic markers and favorable outcome, whereas decreased expression correlates strongly with poor prognosis and MYCN amplification (7, 65). Another candidate gene in neuroblastoma is caspase 8, an apoptosis- related cysteine peptidase. Loss of caspase 8 expression is estimated to occur in 25-35% of neuroblastoma patients, predominantly high-risk tumors. Absence of caspase 8 expression appears to be strongly correlated with MYCN amplification (66, 67). Caspase 8 is homozygously deleted in a small subset of neuroblastomas (67), but more importantly, it is inactivated by hypermethylation in nearly all neuroblastoma patients with MYCN amplification (67). Loss of caspase 8 expression may represent a critical event for impaired activation of the extrinsic apoptotic pathway in high-risk neuroblastoma.
1.1.4 Hereditary neuroblastoma
Familial neuroblastoma accounts for 1-2% of all neuroblastomas (68) and are associated with younger age at diagnosis and multiple sites of primary tumors. Apart from that, hereditary neuroblastoma shows the same diverse clinical behavior as sporadic neuroblastomas, ranging from aggressive progression to spontaneous regression (69). Germline mutations in two genes, PHOX2B and ALK, account for around 90% of hereditary neuroblastomas. PHOX2B belongs to the homeobox gene family and is involved in the development of the normal autonomic nervous system (70, 71). Loss of function mutations in PHOX2B have been found in a small subset of hereditary neuroblastomas and rarely in sporadic neuroblastomas (72).
ALK mutations (see also section 1.1.3.2) are known to be the most common cause of hereditary neuroblastoma so far (42).
1.1.5 Origin of neuroblastoma
The neural crest develops early in embryogenesis (73) and consists of pluripotent cells that migrate from the neural tube to the dorsal aorta. At this early stage of neural crest cell migration and differentiation, bone morphogenetic protein (BMP) signaling plays an important role for cell fate determination and specification (74). From the dorsal aorta, pluripotent cells migrate further to sites where they differentiate into several lineages, including the sympathoadrenal lineage. The oncogenic events responsible for neuroblastoma development appear to be strictly lineage-dependent, because neuroblastomas never arise from other neural precursors than sympathoadrenal lineage cells (75). The cell fate specification is then regulated by multiple transcription factors and their target genes which includes several growth factors and growth factor receptors (76, 77). Homeodomain containing genes such as ASCL1 (78, 79), PHOX2A (80, 81), PHOX2B (82) and HAND2 (83, 84) appear to be of high impotance for cell fate determination and sympathetic differentiation.
Introduction
For example, ASCL1 expression usually decreases after transient expression during the development of neural crest cells, which in turn promotes differentiation to mature sympathetic neurons (85), whereas high expression of ASCL1 is still detectable in neuroblastomas (86, 87). The transcription factors Phox2a and Phox2b are essential for the differentiation of noradrenergic neurons (88). PHOX2A and PHOX2B encode two highly related homeobox transcription factors with similar expression patterns throughout the peripheral autonomic nervous system development (89). Although rare, PHOX2B mutations were found in hereditary and sporadic neuroblastomas as indicated in section 1.1.4. PHOX2B was identified as the major disease causing gene of congenital central hypoventilation syndrome (CCHS) (70), and CCHS patients are predisposed to develop tumors of the sympathetic nervous system, such as neuroblastoma (90). PHOX2B also regulates, among other factors, the expression of HAND2 (83), another candidate tumor suppressor gene, which is de-regulated in neuroblastoma (84). Together with MYCN, these factors control neural crest cell fate and are necessary for sympathetic neuronal differentiation. As MYCN is frequently amplified in neuroblastoma, it has been suggested that its de-regulation may play a major role in the cellular transformation process and thus the initiation of neuroblastoma at this stage of cell maturation (83). Finally, the terminal differentiation of sympathetic progenitor neurons depends on TrkC and TrkA receptor stimulation by the neurotrophins NT3 and NGF.
Increased expression of TRKC and activation by NT3 induces up-regulation of TRKA.
Activation of the TrkA receptor by NGF’s then leads to the terminal differentiation of sympathetic nerve cells. Consistent with these regulatory functions, a higher expression of TRKA and TRKC was found to be strongly correlated with favorable neuroblastomas (7, 91).
Ectoderm
NC Cells
Neural Tube BMPs
Melanocytes Glial Cells
ASCL1,PHOX2A, PHOX2B, HAND2
MYCNampl.
TRKB, TRKC
TRKA GNB, GN
Sympathetic Neurons SIF Cells
Cromaffin Cells
NB
SA Cells
Ectoderm Ectoderm
NC Cells
Neural Tube BMPs
BMPs Melanocytes
Glial Cells
ASCL1,PHOX2A, PHOX2B, HAND2
MYCNampl.
TRKB, TRKC
TRKA GNB, GN
Sympathetic Neurons SIF Cells
Cromaffin Cells
NB
SA Cells
ASCL1,PHOX2A, PHOX2B, HAND2 ASCL1,PHOX2A, PHOX2B, HAND2
MYCNampl.
MYCNampl.
TRKB, TRKC TRKB, TRKC
TRKA TRKA GNB, GN GNB, GN
Sympathetic Neurons Sympathetic
Neurons SIF Cells
Cromaffin Cells SIF Cells Cromaffin Cells
NB NB NB
SA Cells SA Cells
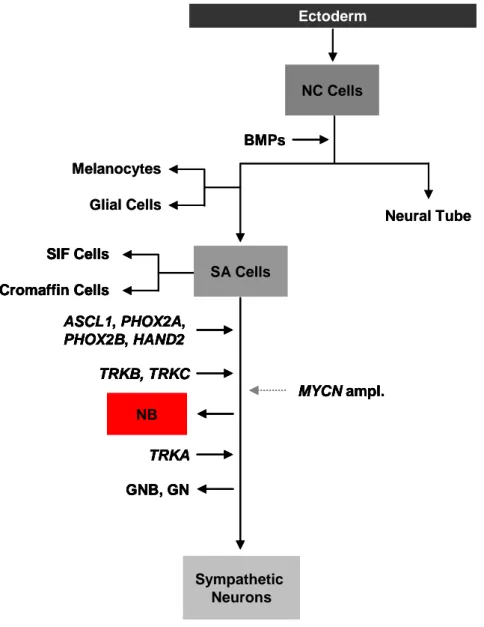
Figure 3: Regulators of the sympathetic nervous system cell lineage (Figure modified from Mohlin et al. (83)). BMP signaling initiates the migration of neural crest (NC) cells and commits precursor cells to melanocytic, glial and sympathetic neuronal lineages. The main cell types of the sympathetic nervous system (SNS) are proposed to originate from sympathoadrenal (SA) progenitor cells. Cell fate restriction is induced and controlled by a set of transcription factors (Ascl1, Phox2a Phox2b and Hand2) expressed at various stages of development. MYCN gene expression is first detectable after cell fate restriction has been induced, and it is suggested that MYCN amplified tumors arise at this developmental stage. Based on a strong correlation of high TRKA expression levels with more favorable neuroblastomas (NB), ganglioneuroblastomas (GNB) and ganglioneuromas (GN), it is supposed that high TRKA expression is sufficient to induce further differentiation even if the cells are already neoplastic.
Introduction
1.1.6 Spontaneous regression and differentiation in neuroblastoma
Spontaneous regression of neuroblastoma was first reported by Beckwith and Perrin in 1963 (92). In infants, the vast majority of neuroblastomas may disappear before becoming clinically apparent, as suggested by several mass screening studies on infants, in which a significant increase of neuroblastoma cases was detected, while a decrease in the frequency of advanced disease stages in older children was not observed (93-96). These investigations have led to the assumption that a large number of neuroblastomas detected by mass screening are favorable tumors that regress spontaneously.
In general, spontaneous regression and differentiation of neuroblastomas are observed less frequently in older patients (21, 97). It has been suggested that the physiologic genetic program of neuroblast differentiation and growth control (Figure 3) is disrupted in neuroblastoma (7), and that this developmental arrest may be reversible and activated delayed in spontaneously regressing neuroblastoms. In this context, a delayed activation of naturally occurring processes of programmed cell death and neuronal differentiation has been suspected (98-100). Consistent with its embryonic nature, many genes de-regulated in neuroblastoma are involved in developmental processes (75). Among these, several transcription factors involved in the development of autonomic neural crest derivates (Figure 3) are implicated in the pathogenesis of neuroblastoma (30, 71, 82, 83, 101), and various HOX genes have been described to be aberrantly expressed in neuroblastoma cell lines and primary tumors (Table 2, (36, 102)).
1.2 Homeobox genes
HOX genes are master regulators of embryonic development and stem cell differentiation.
They encode for highly conserved transcription factors that organize the anterior-posterior (AP) body axis during embryogenesis (103). Beside this, they act as critical regulators of growth and differentiation. They control cell identity, cellular communication, cell cycle progression, hematopoiesis, and apoptosis (104) by activating or repressing their target genes (105-109). HOX genes are separated in 2 classes; class I clustered HOX genes and class II dispersed HOX genes (110). The mammalian class I HOX gene cluster comprises 39 HOX genes, which are arranged within 4 different clusters (A – D) on 4 different chromosomes (chromosome 2, 7, 12, and 17) and organized into 13 paralogous groups.
Introduction
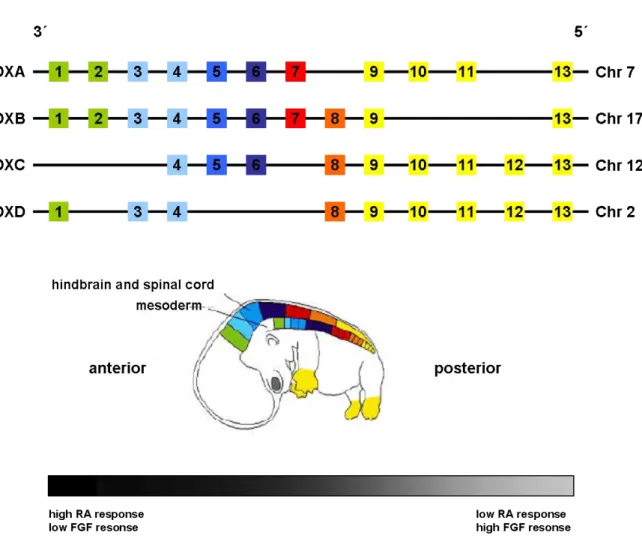
Figure 4: Homeotic gene organization and transcriptional expression (Figure modified from Nolte and Krumlauf (111)). In humans, there are 4 clusters on 4 chromosomes with 39 HOX genes in total.
Genes located closer to the 3’ end of the cluster are stronger expressed in anterior tissues whereas 5’
located genes show a stronger expression pattern in posterior tissues (spatial colinearity). HOX genes that are positioned more 5’ in the cluster (yellow) will have a dominant phenotype compared with those more 3’ (green), which is described as posterior prevalence. HOX genes are expressed temporally in an order corresponding to their positions from 3’ to 5’ within each cluster, known as temporal colinearity. Early 3’ located HOX genes display the highest level of retinoic acid (RA) responsiveness, whereas the 5’ members show stronger response to fibroblast growth factors (FGF’s).
1.2.1 HOX gene expression
HOX gene expression is well controlled during embryonic development. The position of a HOX gene from 3’ to 5’ within a HOX cluster corresponds to its expression along the AP axis of the body and to its temporally order of expression (spatial and temporal colinearity). HOX genes located at the 3’ region of each HOX cluster are activated earlier and more anteriorly
Furthermore, HOX genes which are located in the 5’ region of the HOX cluster lead to a more dominant phenotype than those located more 3’ (posterior prevalence). This precisely organized expression pattern is modulated by complex regulative mechanisms.
It has been suggested that a unidirectional chromatin opening process plays a role in the spatial and temporal expression pattern of HOX genes (114). Two classes of chromatin- modifying proteins epigenetically regulate HOX gene expression. The Polycomb group (PcG) proteins and trithorax group (TrxG) proteins form multiprotein chromatin remodeling complexes that either repress (PcG) or activate (TrxG) the transcription of HOX genes.
Furthermore, HOX gene expression is controlled by a dose dependent response to retinoic acid (RA) and fibroblast growth factors (FGF’s) (115-117). HOX genes located more 3’ in the HOX cluster show a stronger response to RA as compared to 5’ located HOX genes, which are more sensitive to FGF’s (118, 119). Although RA and FGF’s are the best described and analyzed global regulators of HOX gene expression, there are several other factors that can influence HOX gene expression such as regulative RNA’s (miRNA’s (120), lincRNA’s (121, 122) or HOTAIR’s (123)). Finally, HOX gene expression is also regulated by auto- and cross-regulative processes (124-126), in which Hox transcription factors bind to HOX responsive elements (HRE’s) together with one or more cofactors. HRE mediated HOX regulation functions in three different ways: Hox transcription factors can regulate their own expression (auto-regulation), they can activate the expression of other HOX genes within the same segment (cross-activation), or they can have antagonistic interactions in which one Hox transcription factor represses the expression of another HOX gene (cross-repression).
1.2.2 Hox cofactors
Hox cofactors are important for modifying Hox DNA binding sensitivity and specificity (127). Although Hox proteins can bind sequence-specific to a 4-base pair target site (TAAT)
Introduction
as single molecule, their affinity to this site is low in general due to the very short sequence, which allows only restricted specificity in target selection. HRE’s are essential for Hox target regulation. In addition to Hox binding sites, they also contain specific binding sites for Hox cofactors. Therefore, the transcriptional regulation by Hox and cofactor complexes is more specific and allows a precisely defined transcriptional regulation of target genes. Pbx (128- 131) and Meis (132, 133) are the two best studied cofactors of Hox proteins, both belonging to the TALE (three-amino acid-loop-extension) family of homeodomain proteins, which are known to be involved in various forms of leukemia (134). Interestingly, both MEIS and PBX have been described to be involved in the pathogenesis of neuroblastoma (135).
1.2.3 HOX genes in human diseases
De-regulated expression of HOX genes leads to various forms of human disease (114). HOX genes are involved in several disorders of limb development. Muragaki and colleagues showed that mutation of HOXD13 cause synpolydactyly in humans (136). HOXA13, another member of the class I HOX gene family, was identified to play a potential role in the pathogenesis of hand/foot/genital syndrome (137, 138). A malformation of the foot, congenital vertical talus, has been associated to a HOXD10 mutation (139), and it has been hypothesized that HOX genes may be involved in clubfoot and other limb malformations (140, 141). In the central nervous system, homozygous HOXA1 mutations disrupt human brainstem, inner ear, cardiovascular and cognitive development (142).
1.2.3.1 HOX genes in cancer
De-regulated expression of HOX genes is reported in several tumor entities (Table 2). Precise mechanisms by which HOX genes mediate tumor formation or tumor suppression are still not
effects, but the activity is dependent on the availability of their cofactors (143, 144). Aberrant expression of a single HOX gene can lead to tumor formation in one type of tissue by blocking cell differentiation or apoptosis and increasing proliferation, whereas the same HOX gene can exert tumor suppressive functions in a different tissue type. HOXB13, for example, represents a tumor suppressor gene (145) and is necessary for normal prostate development (146) while it is associated with tumorigenesis and aggressive disease course in breast cancer (147). This tissue specificity is also reflected in the broad variation of signaling pathways by which HOX genes exert their effects. In neuroblastoma, the expression of a single HOX gene (HOXC6) induces differentiation and prevents tumorigenesis (148), while in other diseases such as acute myeloid leukemia (AML), overexpression of HOXC6 promotes clonal expansion (149). An example for a fusion protein-mediated malignant transformation is given by HOXA9, which is overexpressed and fused to NUP98 and represents the gene most highly correlated with poor prognosis (150, 151) and treatment failure in AML (152).
Introduction
Tumor Entity HOX Gene Expression Effect
Esophageal squamous cell carcinoma
5’ HOX genes Increased Associated with primary tumors (153)
Lung Carcinoma
5’ HOXA and HOXD genes, A1,C5
Increased Associated with primary tumors (154)
A7, A9 Decreased
(promoter methylation)
Associated with primary tumors (155)
Neuroblastoma
D1, D8, C6 Decreased Expressed in differentiated cell lines (156) C6, C11 Decreased Expression leads to cell differentiation
(148) Ovarian
Carcinoma
B13 Increased Promotes cancer progression (157) B4 Increased Associated with primary tumors and cell
lines (158) Cervical
Carcinoma
C Cluster Increased Associated with primary tumors (159)
C10 Increased Increased invasion (160)
Prostate Carcinoma
B13 Decreased Loss of differentiation, transactivation of androgen receptors and proliferation (145, 146, 161)
C8 Increased Associated with primary tumors, loss of differentiation, androgen receptor - independent growth (162)
Breast Carcinoma
A5 Decreased
(promoter methylation)
Down-regulation of p53, decreased apoptosis (163-165)
A10 Decreased Down-regulation of p53 (166)
B7 Increased Up-regulation of FGF2, associated with bone metastases, increased invasion and vascularization, Associated with HER2 amplification (167-169)
B13 Increased Associated with tamoxifen resistance in tumors, increased migration and invasion in vitro (147, 170, 171)
Leukemia
A9, A10, C6 Increased Associated with aggressive ALL (172) A9 Increased Increased proliferation by NUP98-HOXA9
fusion, MEIS1 and FLT3 up-regulation (152, 173-175)
Astrocytoma A6, A7, A9, A13, B13, D4, D9, D10, D13
Increased Associated with primary tumors and cell lines (110)
Colorectal Cancer B13 Decreased
Associated with primary tumors and cell lines, down-regulates the β-catenin-TCF pathway Inhibition of cell proliferation (176)
Renal Carcinoma B5, B9 Decreased Associated with primary tumors (177) C11 Increased Associated with primary tumors (177) Pediatric low-grade
gliomas
D1, D12 Increased Associated with primary tumors (178) D3 Decreased Associated with primary tumors (178) Table 2: HOX genes in tumorigenesis (Table modified from Abate-Shen (104), Shah and Sukum (179)). Abbreviation: ALL, acute lymphocytic leukaemia.
1.2.3.2 HOX genes in neuroblastoma
Differentiation of neuroblastoma cell lines and primary tumors can be induced by various agents (180) including RA (181). Spontaneous differentiation in infant neuroblastoma into less aggressive ganglioneuroblastoma or benign ganglioneuroma was first described by Cushing in 1927 (182), and occurs regularly (183). In 1990, Peverali and colleagues showed that morphological maturation of neuroblastoma cell lines toward a neuronal differentiation phenotype is associated with increased HOX gene expression (184). Manohar and colleagues (102, 156) further demonstrated that HOX genes, such as HOXC6, HOXD1 and HOXD8, are expressed at a low level in neuroblastoma cell lines, which can be increased by RA treatment.
Zhang et al. (148) showed that neuroblastoma GOTO cells differentiate into schwannian cell types when exposed to 5-bromo-2’-deoxyuridine (BrdU) (148), which is accompanied with increased expression of HOXC6, HOXC11 and S100B, a schwannian cell marker gene. They further demonstrated that these HOX genes directly bind to the S100B promoter and hence lead to its up-regulation.
Genes involved in development or neural differentiation have been described to be de- regulated in MYCN amplified neuroblastomas, indicating that overexpression of MYCN is associated with altered maturation of neuroblastoma progenitor cells. As an example, Alaminos et al. showed that, among other developmental regulators, the expression of HOXC10 is decreased in MYCN amplified primary neuroblastoma tumors (36). In a recent publication, Zha and coworkers demonstrated that increased expression of HOXD8, HOXD9 and HOXD10 results in growth arrest and neuronal differentiation in SK-N-BE(2)-C neuroblastoma cells (185).
Introduction
1.2.4 HOXC9 gene expression in development and tumorigenesis
The molecular mechanisms by which HOXC9 regulates the transcription of its target genes as well as the direct targets themselves are widely unknown. A role for HOXC9 as a master regulator of motor neuron organization and development was proposed recently by Jung and colleagues who demonstrated that HOXC9 exerts its regulative function through global cross- repressive activities (186). In fetal human smooth muscle cells (SMC), HOXC9 was found to be expressed at higher levels as compared to adult SMC’s, which indicates its role in specifying the fetal SMC phenotype (187). Furtheremore, it has been hypothesized that HOXC9 is involved in the process of cell differentiation of bone marrow derived stem cells to endothelial cells (188). HOXC9 expression was detected in hind limb blood vessels of mice (189) and the axial vasculature of zebrafish (190). Moreover, strong HOXC9 expression was found in human umbilical vein endothelial cell (HUVEC) spheroids which are characterized by tight cell contacts and resting proliferation (191). Enhanced expression of HOXC9 leads to the inhibition of major angiogenic processes like tube formation, migration and proliferation in human vascular endothelial cells as demonstrated by Stoll et al. (192). They further showed that HOXC9 exerts its anti-angiogenic function by repressing the transcription of interleukin 8, and independent of the VEGF pathway.
Evidence for Hox-C9 acting as a “tumor suppressor” is given by Kikuyama and co- workers (193) who showed that the HOXC9 promoter is frequently methylated in primary breast cancers. HOXC9 promoter methylation was also observed in stage I non-small-cell lung carcinoma samples, whereas it was absent in the lung tissue of non-cancerous lesions (194).
Recently, high HOXC9 expression was found to be associated with neuroblastoma cell differentiation and decreased cell proliferation (195). In contrast to its tumor suppressive functions, HOXC9 may also stimulate tumor formation and malignancy and thus act as a potential “oncogene”. In cervical cancer, for example, HOXC9 was reported to be expressed
in tumors but not in non-neoplastic tissue (196). It has been hypothesized that the expression of HOXC9 is not implicated in the physiology of normal cervix, but it is necessary for carcinogenesis in this tumor entity. Likewise, normal brain tissues lack HOXC9 expression, while its expression is detectable in astrocytomas of different grades, and HOXC9 expression levels are strongly associated with the grade of malignancy (197). A transgenic mouse model lacking HOXC9 was established and described in 1995 by Suemori and colleagues (198). The HOXC9 knock-out mouse displayed anterior transformation of the vertebrae and malformation of the sternum and ribs (198), however, this model has not yet been used for investigating the role of HOXC9 in cancer biology.
Aim of the Study
2 Aim of the study
Neuroblastoma is an embryonal tumor derived from fetal precursors of the sympathetic nervous system, and has the highest frequency of spontaneous regression observed in human malignancies. It has been suggested that spontaneous regression may represent a delayed activation of developmental apoptotic pathways. However, the molecular mechanisms of this peculiar phenomenon have remained enigmatic. Understanding the molecular processes underlying spontaneous regression is therefore a major challenge in neuroblastoma research.
Since expression of HOX transcription factor genes is tightly regulated during embryogenesis and fundamental for a normal embryonic development, I suggested a role of these genes in neuroblastoma pathogenesis in general and in spontaneous regression in particular. Using microarray-based expression data of a large cohort (n= 649) of primary neuroblastomas, I aimed at determining the gene expression patterns of class I HOX genes and their association with clinical phenotypes. HOXC9 was found to be strongly associated with favorable prognostic markers, beneficial outcome and spontaneous regression in primary neuroblastoma. I therefore aimed to determine the functional role of Hox-C9 in neuroblastoma pathogenesis and spontaneous regression by generating and analyzing HOXC9-transgenic neuroblastoma cell lines.
3 Materials and Methods 3.1 Microarrays and data analysis
3.1.1 Neuroblastoma patient characteristics
Tumors of 649 neuroblastoma patients were analyzed. Neuroblastoma tumor stage was classified according to the International Neuroblastoma Staging System (8): stage 1, n= 153;
stage 2, n= 113; stage 3, n= 91; stage 4, n= 214; stage 4S, n= 78. Patients age at diagnosis ranged from 0 to 25.4 years (median age, 1.1 years). MYCN amplification was observed in 93 tumors, while it was absent in 550 tumors (not determined, n= 6). Loss of chromosome 1p were observed in 140 tumors, while the group of patients with normal chromosome 1p status comprised 407 (not determined, n= 102). Neuroblastoma tumors were further classified according to a prognostic gene expression-based classifier (25): favorable, n= 231;
unfavorable n= 184; unclassified, n= 234. Primary tumors were localized in the abdomen (n= 135), at the neck/chest (n= 69) or the adrenal glands (n= 276). The primary tumor localization for the remaining 169 patients was unknown. Median follow-up for patients without fatal events was 6.4 years (range, 0.2-18.1 years). The subgroup of patients showing regression of neuroblastoma consisted of 43 infants (localized, n= 14; stage 4S, n= 29), in which the tumor manifestations showed unambiguous regression without any cytotoxic treatment (199). The neuroblastoma subgroups used for methylation and array-based Comparative Genomic Hybridization (aCGH) analysis consisted of 46 and 209 tumors, respectively. Risk group assignment of corresponding patients was performed according to the International Neuroblastoma Risk Group (INRG) classification system (15) (methylation, high-risk, n= 21; intermediate- and low-risk, n= 24; unclassified, n= 1; aCGH, high-risk, n= 56; intermediate- and low-risk, n= 153).
Materials and Methods
3.1.2 Gene expression arrays
Single-color gene expression profiles from 649 neuroblastoma tumors were generated previously in the laboratory of Prof. Dr. Matthias Fischer using customized 4 x 44K 60-mer oligonucleotide microarrays produced by Agilent Technologies (Palo Alto, CA, USA). These microarrays included all probes represented by Agilent’s Whole Human Genome Oligo Microarray and all probes of the version V2.0 of the 2 x 11K customized microarray that were not present in the former probe set (25). Annotation files are available through the Gene Expression Omnibus database (Accession ID: GSE45480). Single-color gene expression profiles of neuroblastoma cell lines were generated using the same array platform. Total RNA of HOXC9 and GFP-expressing SK-N-AS and IMR-32 neuroblastoma cells were isolated at 0, 6, 12, 24, 48 and 96 h using TRIZOL reagent (Invitrogen, Karlsruhe, Germany). Integrity of the isolated RNA was assessed using the 2100 Bioanalyzer (Agilent Technologies), and only samples with an RNA integrity number (RIN) of at least 7.5 were considered for further processing. For labeling and hybridization, 1 μg of RNA was linearly amplified and labeled with Cy3 using Agilent’s one-color Quick Amp Labeling Kit (Agilent Technologies) following the instructions of the manufacturer’s protocol. Then, 1650 ng of Cy3-labeled cRNA was hybridized to the 4 x 44K arrays using Agilent’s High-RPM Gene Expression Hyb Kit (Agilent Technologies) according to the manufacturer’s protocol. Hybridization was performed for 17 h at 65 °C in a rotating hybridization oven (Robbins Scientific, CA, USA) at 10 rpm according to the company’s recommendations. After washing and scanning, resulting TIFF images were processed using Agilent’s Feature Extraction software Version 9.5.1 (Agilent Technologies). The quantile normalization method (200) was applied on gene expression raw data. All raw and normalized microarray data are available through the Gene Expression Omnibus database (Accession: GSE45480).
3.1.2.1 Analysis of gene expression data
Associations between class I HOX mRNA expression levels and neuroblastoma subgroups, prognostic markers and patient outcome were analyzed using single-color gene expression profiles from 649 neuroblastoma tumors. All HOX genes were first tested in a univariable Cox regression model based on OS and EFS. For all HOX genes with p-values ≤ 0.05 the whole cohort (n= 649) was divided into quartiles based on HOX gene expression levels. Kaplan- Meier estimates for OS (n= 649) and EFS (n= 628) were compared by log- rank test. In addition, HOXC9 was investigated separately. The entire set was divided into a training (n= 244) and validation cohort (n=405). The training cohort was divided into quartiels based on HOXC9 expression levels and these values were applied on the validation cohort as a cut- off for high, intermediate-high, intermediate-low and low HOXC9 expression. Kaplan-Meier estimates for OS (n= 405) and EFS (n= 384) were compared by log-rank test. Recurrence, progression and death from disease were considered as events. Multivariate Cox proportional hazard models based on EFS and OS were used to analyze the prognostic impact of HOXC9 expression in neuroblastoma. The factors age (> 18 months vs. < 18 months), tumor stage (stage 4 vs. stage 1-3 and 4S), MYCN amplification status (amplified vs. normal) and HOXC9 expression were fitted into a stepwise-backward selection model.
3.1.2.2 HOX gene expression-based classification
To develop a HOX gene expression-based classifier (HOX classifier), the nearest shrunken centroids method (PAM) (201) was applied on HOX gene expression data from 75 neuroblastoma patients with maximal divergent clinical outcome (patients who had died of disease despite cytotoxic treatment (n= 22) or survived event free more than 1000 days after diagnosis without cytotoxic treatment (n= 53) (25)). The classification performance in the training set was evaluated by a 10 times repeated 5-fold cross-validation. Probes that were
Materials and Methods
included in at least 65% of all cross-validation models were selected as classifier probes as recommended by Li et al. (202). Classification accuracy of the final HOX classifier was assessed in an independent validation set of 574 neuroblastoma patients using the Support Vector Machine (SVM) (203) algorithm. Multivariate Cox proportional hazard models based on EFS and OS were used to analyze the prognostic impact of this classifier. The factors age (< 18 months vs. > 18 months), tumor stage (stage 1-3 and 4S vs. stage 4), MYCN amplification status (normal vs. amplified) and HOX classifier were fitted into a stepwise- backward selection model.
3.1.2.3 Gene Ontology enrichment analyses
To determine global differences in the expression profiles of HOXC9 and GFP-induced SK-N-AS and IMR-32 cells, mean expression levels of each gene between HOXC9 induced and control cells were compared. Differentially expressed genes, either up- or down-regulated after HOXC9 re-expression, were determined by applying a fold-change cut off and unpaired, two-tailed Students t-test. Genes with a fold-change of ≥ 2 and p-values ≤ 0.05 were considered as significantly differentially regulated in these groups. Gene Ontology Tree Machine (GOTM) (204) was used to identify functional categories associated with the characteristics of the respective cell line. The p-value assigned to the overrepresentation of a specific category was calculated by a hypergeometric test, and results were corrected for multiple testing (Benjamini-Hochberg).
3.1.3 Array-based Comparative Genomic Hybridization
High-resolution oligonucleotide aCGH profiles of 209 neuroblastoma tumors were generated previously (205, 206) using 44 K, 105 K or 1 M microarrays (Agilent Technologies). Array-
algorithm (207) was applied to allow visualization of the resulting aCGH data by the Integrative Genomics Viewer (IGV) (208). Due to technical reasons, 9 out of 209 aCGH profiles could not be visualized. To evaluate whether chromosomal aberrations on chromosome 12 are associated with de-regulated HOXC9 expression, I compared the results with corresponding microarray gene expression data of the same tumors using two-tailed nonparametric tests (Kruskal-Wallis).
3.2 Statistics
Statistical analysis of associations between HOX mRNA expression levels and neuroblastoma subgroups, prognostic markers and outcome was performed using SPSS version 20.0 (IBM).
Two-tailed nonparametric tests (Mann-Whitney U, and Kruskal-Wallis test) were used where appropriate. Kaplan-Meier estimates for OS and EFS were compared by log-rank test.
Multivariate Cox proportional hazard models based on EFS and OS were used to analyze the prognostic impact of HOXC9 expression in neuroblastoma. The likelihood ratio test p for inclusion was ≤ 0.05 and for exclusion was > 0.05. Quantitative data for functional analyses were shown as means ± SD. Unpaired two-tailed Students t-tests were used where appropriate.
3.3 Cell Culture
SK-N-AS and CHP-212 cells were obtained from the American Tissue Culture Collection (ATCC, Manassas, VA, USA), IMR-32 cells were purchased from the German Collection of Microorganisms and Cell Cultures (DSMZ, Braunschweig, Germany). Neuroblastoma cell lines were authenticated at the DSMZ. Neuroblastoma cell lines were maintained in RPMI- 1640 (PAA, Coelbe, Germany) supplemented with 10% fetal calf serum (FCS, PAA).
Materials and Methods
Inducible cell lines were maintained in RPMI-1640 supplemented with 10% Tet-free FCS (PAA), 50 µg/ml G418 (PAA) and 30 µg/ml Hygromycin B (PAA). PT67 packaging cells were obtained from Clontech Laboratories (Clontech Laboratories, Inc., Heidelberg, Germany) and grown in DMEM (PAA) supplemented with 10% FCS. Cells were maintained in a humidified incubator at 37 °C with 5% CO2 and passaged at 90% confluence using Trypsin-EDTA (PAA). Doxycycline (Sigma-Aldrich, Taufkirchen, Germany) was used to induce transgene expression (2 µg/ml). Neuroblastoma cell lines were shown to be free of mycoplasma by using the Venor® GeM Mycoplasma Detection Kit (Minerva Biolabs, Berlin, Germany) according to the manufacturer’s protocol.
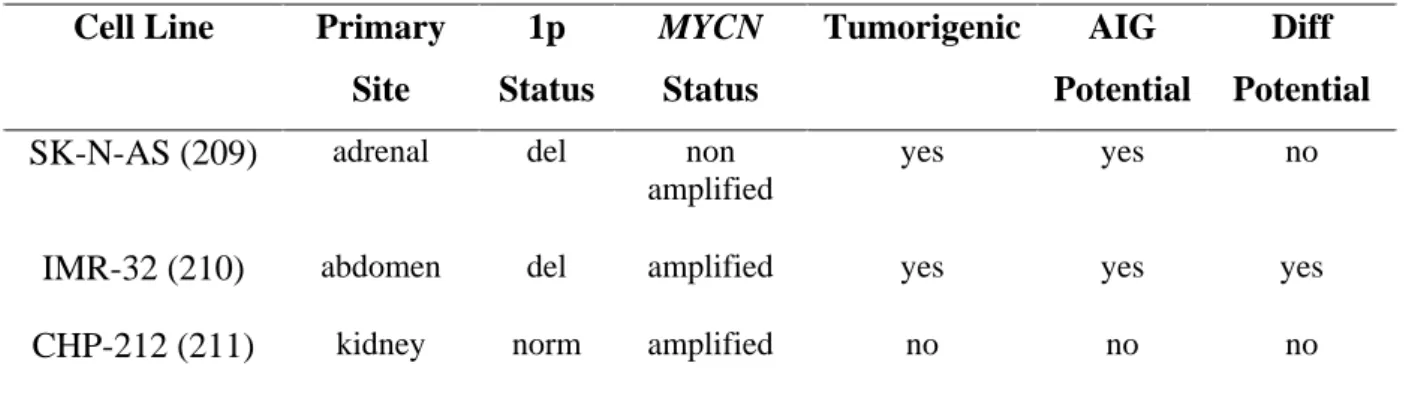
3.3.1 Neuroblastoma cell line characteristics
To mirror the broad spectrum of neuroblastoma disease, I selected a heterogeneous set of neuroblastoma cell lines for functional studies. Only cell lines which showed loss of HOXC9 expression were considered for re-expression analyses.
Cell Line Primary Site
1p Status
MYCN Status
Tumorigenic AIG Potential
Diff Potential SK-N-AS (209) adrenal del non
amplified
yes yes no
IMR-32 (210) abdomen del amplified yes yes yes
CHP-212 (211) kidney norm amplified no no no
Table 3: Neuroblastoma cell line characteristics. Abbreviations: del., deletion; norm, normal; AIG, anchorage independent growth; Diff, differentiation.