Article
mRNA-Expression of KRT5 and KRT20 Defines Distinct Prognostic Subgroups of Muscle-Invasive Urothelial Bladder Cancer Correlating with
Histological Variants
Markus Eckstein
1,*
,†, Ralph Markus Wirtz
2,3,†, Matthias Gross-Weege
4,†, Johannes Breyer
5,†, Wolfgang Otto
5,†, Robert Stoehr
1,†, Danijel Sikic
6,†, Bastian Keck
6,†, Sebastian Eidt
3,†, Maximilian Burger
5,†, Christian Bolenz
7,†, Katja Nitschke
4,†, Stefan Porubsky
8,†, Arndt Hartmann
1,†and Philipp Erben
4,†1
Institute of Pathology, University of Erlangen-Nuremberg, 91054 Erlangen, Germany;
robert.stoehr@uk-erlangen.de (R.S.); arndt.hartmann@uk-erlangen.de (A.H.)
2
STRATIFYER Molecular Pathology GmbH, 50935 Cologne, Germany; ralph.wirtz@stratifyer.de
3
Institute of Pathology at the St Elisabeth Hospital Köln-Hohenlind, 50935 Cologne, Germany;
Sebastian.eidt@stratifyer.de
4
Department of Urology, University Medical Centre Mannheim, Medical Faculty Mannheim, University of Heidelberg, 68167 Mannheim, Germany; matthias.gross-weege@umm.de (M.G.-W.);
katja.nitschke@medma.uni-heidelberg.de (K.N.); Philipp.Erben@medma.uni-heidelberg.de (P.E.)
5
Department of Urology, University of Regensburg, 93053 Regensburg, Germany;
Johannes.breyer@ukr.de (J.B.); wolfgang.otto@ukr.de (W.O.); maximilian.burger@ukr.de (M.B.)
6
Department of Urology and Pediatric Urology, University Hospital Erlangen, 91058 Erlangen, Germany;
danijel.sikic@uk-erlangen.de (D.S.); Bastian.keck@web.de (B.K.)
7
Department of Urology, University of Ulm, 89081 Ulm, Germany; Christian.Bolenz@uniklinik-ulm.de
8
Department of Pathology, University Medical Centre Mannheim, Medical Faculty Mannheim, University of Heidelberg, 68167 Mannheim, Germany; Stefan.porubsky@medma.uni-heidelberg.de
*
Correspondence: markus.eckstein@uk-erlangen.de; Tel.: +49-9131-8522525
† On behalf of the BRIDGE Consortium.
Received: 22 September 2018; Accepted: 22 October 2018; Published: 30 October 2018
Abstract: Recently, muscle-invasive bladder cancer (MIBC) has been subclassified by gene expression profiling, with a substantial impact on therapy response and patient outcome. We tested whether these complex molecular subtypes of MIBC can be determined by mRNA detection of keratin 5 (KRT5) and keratin 20 (KRT20). Reverse transcriptase quantitative polymerase chain reaction (RT-qPCR) was applied to quantify gene expression of KRT5 and KRT20 using TaqMan
®-based assays in 122 curatively treated MIBC patients (median age 68.0 years). Furthermore, in silico analysis of the MD Anderson Cancer Center (MDACC) cohort (GSE48277 + GSE47993) was performed. High expression of KRT5 and low expression of KRT20 were associated with significantly improved recurrence-free survival (RFS) and disease-specific survival disease specific survival (DSS: 5-year DSS for KRT5 high: 58%; 5-year DSS for KRT20 high: 29%). KRT5 and KRT20 were associated with rates of lymphovascular invasion and lymphonodal metastasis. The combination of KRT5 and KRT20 allowed identification of patients with a very poor prognosis (KRT20
+/KRT5
−, 5-year DSS 0%, p < 0.0001). In silico analysis of the independent MDACC cohorts revealed congruent results (5-year DSS for KRT20 low vs. high: 84% vs. 40%, p = 0.042).
High KRT20-expressing tumors as well as KRT20
+/KRT
−tumors were significantly enriched with aggressive urothelial carcinoma variants (micropapillary, plasmacytoid, nested).
Keywords: Bladder cancer; muscle-invasive bladder cancer; molecular diagnostics; molecular subtyping; KRT5; KRT20
Int. J. Mol. Sci.2018,19, 3396; doi:10.3390/ijms19113396 www.mdpi.com/journal/ijms
1. Introduction
Urothelial bladder cancer (UBC) is one of the 10 most common malignancies worldwide, with nearly 386,000 new cases and nearly 150,200 deaths per year [1]. Non-muscle-invasive bladder cancer (NMIBC) variants (70%) are not immediately life-threatening but often progress, while muscle-invasive bladder cancer (MIBC) tumors account only for nearly 30%, but are responsible for most deaths [2]. Due to the high cost of treatment modalities and the often necessary lifelong surveillance, UBC is one of the most expensive tumor entities [3].
The current standard of care in MIBC is radical cystectomy with perioperative platinum-based chemotherapy in selected cases. At present, clinical management of MIBC suffers from two major problems: First, the therapy selection is heavily influenced by a limited clinicopathological staging system, resulting in high rates of inadequate treatment [4]. Second, due to limited insight into molecular variants, it is not yet possible to identify potential (chemo)therapy responders [2,5]. Therefore, several groups have started to characterize UBC by gene expression profiling, as was previously done for breast cancer [6,7], which identified highly prognostic molecular signatures [5,8–19]. The MD Anderson Cancer Center (MDACC) subtypes resembled those identified for breast cancer and showed typical mRNA expression profiles of basal and luminal markers, with keratin 5 (KRT5) expression being highly upregulated in basal and keratin 20 (KRT20) being upregulated in luminal tumors. The third subtype (p53-like) is characterized by either a luminal or basal expression profile and an activated p53 wild-type pathway, which might be caused by prominent immune cell infiltration [14,20]. Recently, we demonstrated the high prognostic relevance of assessing KRT5 and KRT20 expression in high-risk NMIBC [21]. High KRT5 mRNA expression identified a subgroup of nonluminal NMIBC that showed superior recurrence-free survival (RFS) and progression-free survival (PFS) despite being World Health Organization (WHO) grade 3 and stage pT1. In contrast, NMIBC with high KRT20 mRNA expression was accompanied by significantly increased rates of tumor progression.
Here, we tested whether molecular subtyping by KRT20 and KRT5 mRNA expression is also applicable in MIBC. The main aim of this study was to prove the possibility and feasibility of introducing those two markers into the clinicopathological routine.
2. Material and Methods
2.1. Patient Population, Specimen Collection, and Histopathological Evaluation
Formalin-fixed paraffin-embedded (FFPE) tumor tissue samples were obtained from 169 patients with histologically confirmed MIBC (pT2-4) who were treated with radical cystectomy in conjunction with bilateral lymphadenectomy at a single center between 1999 and 2007 by 2 oncological surgeons with substantial cystectomy experience. Thirty-two patients received adjuvant platinum-containing chemotherapy (in the final study cohort, 22 patients received adjuvant platinum-containing chemotherapy). None of the patients underwent neoadjuvant radiation or chemotherapy. Hematoxylin and Eosin stained HE sections were reevaluated according to the 2017 Union internationale contre le cancer (UICC) staging manual and graded according to the common grading systems (World Health Organization1973 and 2016) by 3 experienced uropathologists (A.H., S.P., M.E.) [22]. Primary squamous cell carcinomas, pure neuroendocrine carcinomas, tumors originating from other organs (metastases or arising from neighboring organs), samples with low calmodulin 2 (CALM2) housekeeping gene expression (Ct values ≥ 28.0) and cases with missing follow-up data were excluded (n = 47).
The final cohort consisted of 122 patients. The median follow-up period was 26.5 months (range 0.7–180.8 months). Follow-up data were achieved from local tumor registries and clinical case files, and by telephone calls to last known treating private practices.
In total, 59 patients had a recurrence: 44 patients with distant metastases, 5 patients with isolated
local recurrences with delayed distant metastases, and 10 patients with co-occurrence of local and
distant recurrence. The date of recurrence was defined as first confirmation of local and/or distant
metastasis. Most recurrences were confirmed by computed tomography, but due to the retrospective
nature of this study, in several cases we did not know the modality of recurrence detection. None of the patients received local resection of local recurrences or distant metastases.
All patients gave informed consent, and the study was approved by the institutional review board under numbers 2013-517N-MA (approval date: 21.02.2013) and 2016-814R-MA (approval date:
05.04.2016). To validate RT-qPCR-data, array gene expression data (Illumina HumanHT-12 WG-DASL V4.0 R2 expression beadchip) of 44 MIBC patients from the MDACC cohort (GSE48276) were analyzed (median age 67.6, range 41–89.6 years) [14].
2.2. RNA Isolation from FFPE Tissue
RNA was extracted from FFPE tissue using 10 µ m sections, which were processed in a fully automated manner by a commercially available bead-based extraction method (XTRACT kit;
STRATIFYER Molecular Pathology GmbH, Cologne, Germany). RNA was eluted with 100 µL elution buffer and RNA eluates were analyzed. The section was taken from a paraffin block containing a tumor area of at least 5 × 5 mm with a total tumor content of at least 30% tumor cells.
2.3. mRNA Quantification by RT-qPCR
RT-qPCR was applied for relative quantification of KRT5 and KRT20 mRNA as well as CALM2 (calmodulin 2; housekeeping gene) expression by using gene-specific TaqMan
®-based assays as described previously [21,23]. CALM2 is a stably expressed gene among breast cancer tumor tissue samples and has been applied successfully to bladder cancer specimens [21,24,25]. Each patient sample or control was analyzed in triplicate. Experiments were run on a Siemens Versant (Siemens, Germany) according to the following protocol: 5 min at 50
◦C, 20 s at 95
◦C, followed by 40 cycles of 15 s at 95
◦C and 60 s at 60
◦C. Forty amplification cycles were applied and the cycle quantification threshold (Ct) values of 3 markers and 1 reference gene for each sample were estimated as the mean of the 3 measurements. Ct values were normalized by subtracting the Ct value of the housekeeping gene CALM2 from the Ct value of the target gene (∆Ct).
2.4. Statistical Analysis
All p-values were calculated 2-sided, and values of <0.05 were considered to be significant.
Survival analyses were performed by univariate Kaplan–Meier regressions and tested for significance with the log-rank. Results were considered to be significant if the test revealed significance levels <0.05.
Multivariate analyses were performed by Cox proportional hazard regression model, including all relevant clinicopathological characteristics (pT-Stage, pN-Stage, lymphovascular invasion (L), blood vessel invasion (V), age, gender, receipt of adjuvant platinum-containing chemotherapy, status of resection margins, and tumor grading (WHO 2016 and WHO 1973)). Statistical analyses of numeric continuous variables were performed by nonparametric tests (Wilcoxon rank-sum test, Kruskal–Wallis test). Contingency analysis of nominal variables was performed by Pearson’s chi-squared test.
Correlation analysis of numeric continuous variables was performed using Spearman rank correlations.
All statistical analyses were performed with GraphPad Prism 7.2 (GraphPad Software Inc., La Jolla, CA, USA) and JMP SAS 13.2 (SAS, Cary, NC, USA).
3. Results
3.1. Clinicopathological Data and Expression of KRT5 and KRT20 mRNA in MIBC
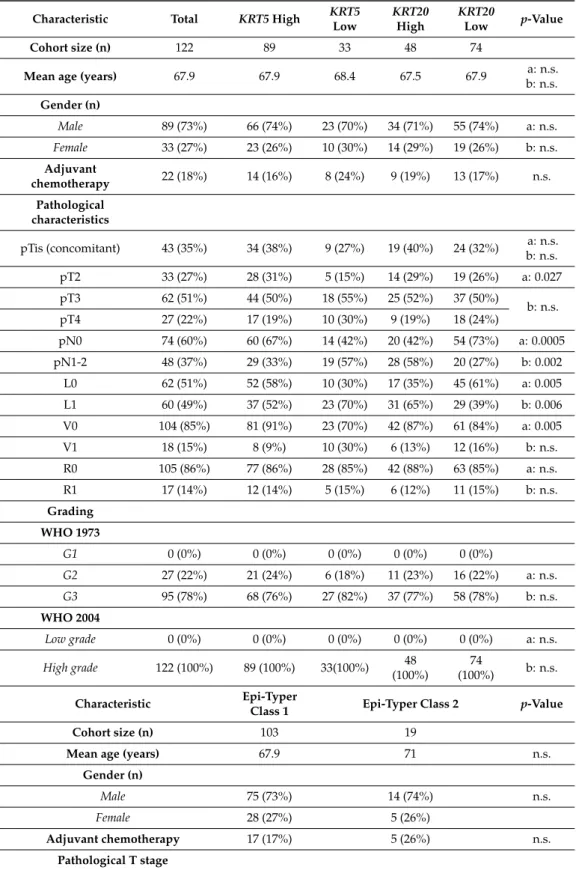
The distribution of clinicopathological data of the entire cohort and respective KRT-expression
subgroups (KRT5 high vs. low; KRT20 high vs. low; Epi-Typer Class 1, Epi-Typer Class 2) including
age, gender, pT-Stage, pN-Stage, and grading (WHO 1973, WHO 2004/2016) is depicted in Table 1.
Table 1.
Clinicopathological characteristics of the Mannheim cohort (overall and respective subgroups).
KRT, keratin; L, lymphovascular invasion; V, blood vessel invasion; R, resection margin; WHO, World Health Organization; n.s., not significant; G, Grade; T, Tumor. * p-Value a: KRT5
highvs. KRT5
low; p-value b: KRT20
highvs. KRT20
low.
Characteristic Total KRT5High KRT5
Low
KRT20 High
KRT20
Low p-Value
Cohort size (n) 122 89 33 48 74
Mean age (years) 67.9 67.9 68.4 67.5 67.9 a: n.s.
b: n.s.
Gender (n)
Male 89 (73%) 66 (74%) 23 (70%) 34 (71%) 55 (74%) a: n.s.
Female 33 (27%) 23 (26%) 10 (30%) 14 (29%) 19 (26%) b: n.s.
Adjuvant
chemotherapy 22 (18%) 14 (16%) 8 (24%) 9 (19%) 13 (17%) n.s.
Pathological characteristics
pTis (concomitant) 43 (35%) 34 (38%) 9 (27%) 19 (40%) 24 (32%) a: n.s.
b: n.s.
pT2 33 (27%) 28 (31%) 5 (15%) 14 (29%) 19 (26%) a: 0.027
pT3 62 (51%) 44 (50%) 18 (55%) 25 (52%) 37 (50%)
b: n.s.
pT4 27 (22%) 17 (19%) 10 (30%) 9 (19%) 18 (24%)
pN0 74 (60%) 60 (67%) 14 (42%) 20 (42%) 54 (73%) a: 0.0005
pN1-2 48 (37%) 29 (33%) 19 (57%) 28 (58%) 20 (27%) b: 0.002
L0 62 (51%) 52 (58%) 10 (30%) 17 (35%) 45 (61%) a: 0.005
L1 60 (49%) 37 (52%) 23 (70%) 31 (65%) 29 (39%) b: 0.006
V0 104 (85%) 81 (91%) 23 (70%) 42 (87%) 61 (84%) a: 0.005
V1 18 (15%) 8 (9%) 10 (30%) 6 (13%) 12 (16%) b: n.s.
R0 105 (86%) 77 (86%) 28 (85%) 42 (88%) 63 (85%) a: n.s.
R1 17 (14%) 12 (14%) 5 (15%) 6 (12%) 11 (15%) b: n.s.
Grading WHO 1973
G1 0 (0%) 0 (0%) 0 (0%) 0 (0%) 0 (0%)
G2 27 (22%) 21 (24%) 6 (18%) 11 (23%) 16 (22%) a: n.s.
G3 95 (78%) 68 (76%) 27 (82%) 37 (77%) 58 (78%) b: n.s.
WHO 2004
Low grade 0 (0%) 0 (0%) 0 (0%) 0 (0%) 0 (0%) a: n.s.
High grade 122 (100%) 89 (100%) 33(100%) 48 (100%)
74
(100%) b: n.s.
Characteristic Epi-Typer
Class 1 Epi-Typer Class 2 p-Value
Cohort size (n) 103 19
Mean age (years) 67.9 71 n.s.
Gender (n)
Male 75 (73%) 14 (74%) n.s.
Female 28 (27%) 5 (26%)
Adjuvant chemotherapy 17 (17%) 5 (26%) n.s.
Pathological T stage
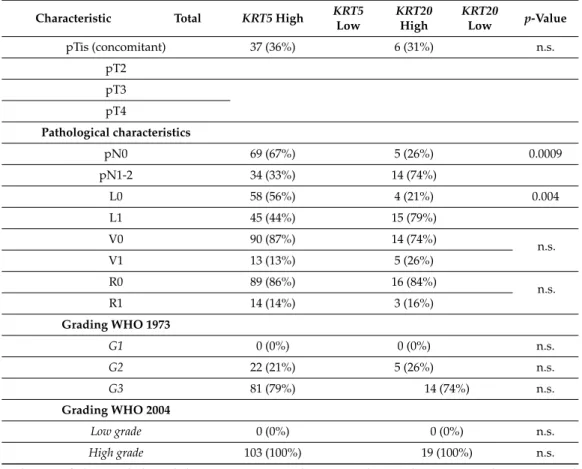
Table 1.
Cont.
Characteristic Total KRT5High KRT5
Low
KRT20 High
KRT20
Low p-Value
pTis (concomitant) 37 (36%) 6 (31%) n.s.
pT2 pT3 pT4
Pathological characteristics
pN0 69 (67%) 5 (26%) 0.0009
pN1-2 34 (33%) 14 (74%)
L0 58 (56%) 4 (21%) 0.004
L1 45 (44%) 15 (79%)
V0 90 (87%) 14 (74%)
n.s.
V1 13 (13%) 5 (26%)
R0 89 (86%) 16 (84%)
n.s.
R1 14 (14%) 3 (16%)
Grading WHO 1973
G1 0 (0%) 0 (0%) n.s.
G2 22 (21%) 5 (26%) n.s.
G3 81 (79%) 14 (74%) n.s.
Grading WHO 2004
Low grade 0 (0%) 0 (0%) n.s.
High grade 103 (100%) 19 (100%) n.s.
Distribution of clinic-pathological determinants across the entire cohort and respective subgroups. p-value a:KRT5highvs.KRT5low;p-value b:KRT20highvs.KRT20low.
Data distribution of normalized KRT5 and KRT20 expression levels had a broad dynamic range (Figure 1A). Expression of KRT5 and KRT20 correlated inversely (r = − 0.42, p < 0.0001; Figure 1A).
Consistent with previous studies, there was a significant association between high KRT5 expression and squamous and sarcomatoid differentiation (Figure 1C) [14]. Tumors with variant histology (micropapillary, nested, plasmacytoid) showed an interesting keratin expression pattern: they showed high expression of KRT20, while the expression of KRT5 was very low in these cases (Figure 1C,D).
High expression of KRT5 was associated with a lower rate of lymphovascular invasion (LVI) (p = 0.0004)
and lymphonodal metastasis (p = 0.002; Figure 1B), while high KRT20 expression correlated positively
with LVI/nodal status (Figure 1B). Furthermore, luminal bladder cancer variants (micropapillary,
plasmacytoid, nested) exhibited significantly lower levels of KRT5 and significantly higher levels of
KRT20 expression than conventional UBC or basal variants (sarcomatoid, squamous; Figure 1E).
Figure 1. (A) Data distribution of KRT5 and KRT20 mRNA levels in patients with muscle-invasive bladder cancer (MIBC) treated with radical cystectomy and correlation of KRT5 and KRT20 mRNA levels. Blue bars within the boxplot indicate median value and 25%/75% quartiles. The black line in the correlation plot indicates the strength of correlation. (B) Correlation of KRT5 mRNA expression levels with N-stage and lymphovascular invasion (L; L1 = lymphovascular invasion present; L0 = lymphovascular invasion absent; pN0 = no lymphnode metastasis present; pN+ = lymphnode metastasis present). High expression of KRT5 mRNA is associated with significantly lower rates of Figure 1.
(A) Data distribution of KRT5 and KRT20 mRNA levels in patients with muscle-invasive
bladder cancer (MIBC) treated with radical cystectomy and correlation of KRT5 and KRT20 mRNA
levels. Blue bars within the boxplot indicate median value and 25%/75% quartiles. The black
line in the correlation plot indicates the strength of correlation. (B) Correlation of KRT5 mRNA
expression levels with N-stage and lymphovascular invasion (L; L1 = lymphovascular invasion
present; L0 = lymphovascular invasion absent; pN0 = no lymphnode metastasis present; pN+ =
lymphnode metastasis present). High expression of KRT5 mRNA is associated with significantly
lower rates of LVI and nodal metastasis. (C,D) Distribution of KRT5 and KRT20 in conventional
(not otherwise specified; NOS), micropapillary (MPUC), plasmacytoid (PUC), nested (NUC),
squamous, and sarcomatoid differentiated urothelial carcinomas. (E) Distribution of KRT20 and KRT5
stratified by conventional urothelial carcinomas, luminal variants (including nested, plasmacytoid,
and micropapillary carcinomas), and basal variants (including squamous and sarcomatoid carcinomas).
3.2. KRT5 and KRT20 mRNA Expression Defines Highly Prognostic Relevant Subgroups of MIBC
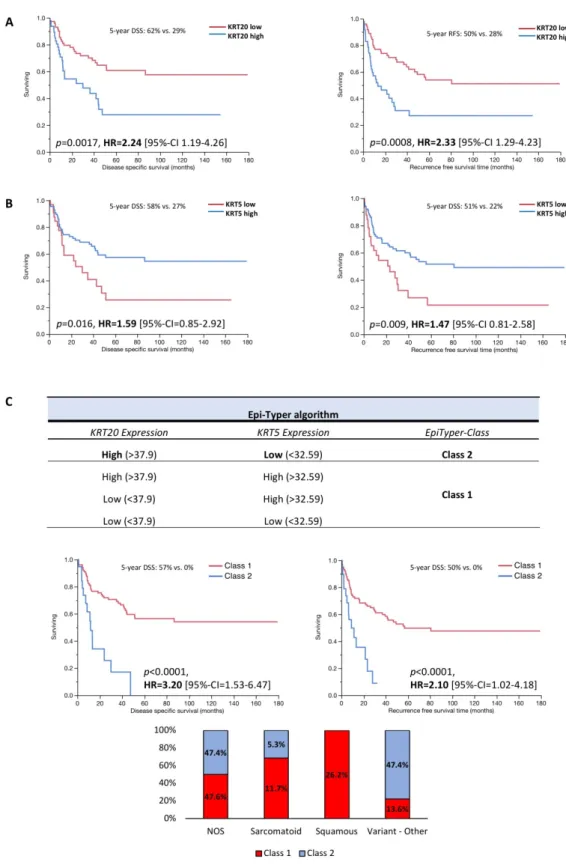
As shown in Figure 2A,B the differential expression of KRT5 and KRT20 clearly defines two distinct subgroups. High KRT20 mRNA expression was significantly associated with worse RFS (multivariate hazard ratio (HR) = 2.33) and DSS (multivariate = HR 2.24; Figure 2A, Supplementary Table S1). Low KRT5 expression level was associated with unfavorable RFS (multivariate HR = 1.47) and DSS (multivariate HR = 1.59; Figure 2B, Supplementary Table S1). Next, an algorithm (Epi-Typer) based on the above calculated cutoffs for KRT5 and KRT20 mRNA expression was used to further subclassify the tumors, as depicted in Figure 2C. KRT5 and KRT20 cutoffs were calculated by a predictive monoforest algorithm stratified by disease-specific survival status (disease-specific death vs.
no disease-specific death). There was no statistically significant difference between the KRT5
+/KRT20
−and KRT5
+/KRT20
+subtypes with regard to RFS and DSS when these two groups were summarized
to the KRT5
+/KRT20
+/
−phenotype (data not shown). The KRT20
+/KRT5
−(class 2) subgroup showed
a very poor prognosis with 5-year RFS (multivariate HR = 2.10; Figure 2C) and DSS of 0% (multivariate
HR = 3.20; Figure 2C), whereas the KRT5
+/KRT20
+/
−(class 1) subgroup showed a favorable prognosis
with 5-year RFS of 52% and 5-year DSS of 58% (Figure 2C).
Figure 2. Kaplan–Meier analysis for recurrence-free survival (RFS) and disease-specific survival (DSS) based on (A) KRT20 and (B) KRT5 mRNA expression levels. (C) Epi-Typer algorithm and Kaplan–Meier analysis in the MIBC cohort for RFS and DSS based on marker combination (Epi-Typer) of KRT5 and KRT20 mRNA expression levels (red color: tumors within Epi-Typer Class 1; blue color: tumors within Epi-Typer Class 2).
Figure 2.
Kaplan–Meier analysis for recurrence-free survival (RFS) and disease-specific survival (DSS)
based on (A) KRT20 and (B) KRT5 mRNA expression levels. (C) Epi-Typer algorithm and Kaplan–Meier
analysis in the MIBC cohort for RFS and DSS based on marker combination (Epi-Typer) of KRT5 and
KRT20 mRNA expression levels (red color: tumors within Epi-Typer Class 1; blue color: tumors within
Epi-Typer Class 2).
Int. J. Mol. Sci.2018,19, 3396 9 of 14
3.3. Multivariate Data Analysis
Multivariate Cox–proportional hazard models were calculated including fixed clinicopathological variables: pT-Stage, pN-Stage, Grading WHO 1973, Grading WHO 2016 (no impact; all included tumors were high grade), lymphovascular invasion, blood vessel invasion, age at cystectomy, gender, resection margin status, receipt of adjuvant platinum-containing chemotherapy, and presence of urothelial carcinoma in situ. Models were calculated for each respective cutoff group (KRT5 high vs. low, KRT20 high vs. low, Epi-Typer classes). Detailed multivariate analyses are depicted in Supplementary Table S1, including multivariate hazard ratios, significance levels, and 95% confidence intervals.
3.4. KRT5 and KRT20 mRNA Expression in the MDACC Cohort
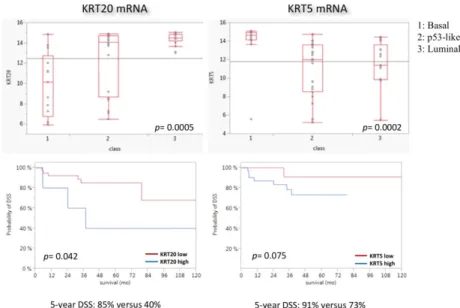
Data validation was performed using in silico MDACC data (GSE48276; GSE = gene set enrichment) [14]. The basal subtype was significantly enriched with KRT5 (p = 0.0002), whereas the luminal subtype showed significant enrichment with KRT20 (p = 0.0005) (Figure 3). High expression of KRT20 mRNA was associated with significantly worse DSS, while KRT5 mRNA expression had no prognostic impact (p = 0.042 for KRT20 and p = 0.075 for KRT5; Figure 3). In addition, the Epi-Typer algorithm added no prognostic impact to the KRT20/KRT5 cutoff (data not shown).
3.3. Multivariate Data Analysis
Multivariate Cox–proportional hazard models were calculated including fixed clinicopathological variables: pT-Stage, pN-Stage, Grading WHO 1973, Grading WHO 2016 (no impact; all included tumors were high grade), lymphovascular invasion, blood vessel invasion, age at cystectomy, gender, resection margin status, receipt of adjuvant platinum-containing chemotherapy, and presence of urothelial carcinoma in situ. Models were calculated for each respective cutoff group (KRT5 high vs. low, KRT20 high vs. low, Epi-Typer classes). Detailed multivariate analyses are depicted in Supplementary Table S1, including multivariate hazard ratios, significance levels, and 95% confidence intervals.
3.4. KRT5 and KRT20 mRNA Expression in the MDACC Cohort
Data validation was performed using in silico MDACC data (GSE48276; GSE = gene set enrichment) [14]. The basal subtype was significantly enriched with KRT5 (p = 0.0002), whereas the luminal subtype showed significant enrichment with KRT20 (p = 0.0005) (Figure 3). High expression of KRT20 mRNA was associated with significantly worse DSS, while KRT5 mRNA expression had no prognostic impact (p = 0.042 for KRT20 and p = 0.075 for KRT5; Figure 3). In addition, the Epi-Typer algorithm added no prognostic impact to the KRT20/KRT5 cutoff (data not shown).
Figure 3. Association of KRT5 and KRT20
mRNA expression levels with MDACC molecular subtypes (MDACC cohort). Class 1 = basal, Class 2 = p53-like, Class 3 = luminal. As expected, luminal tumors were enriched with KRT20 and basal tumors were enriched with KRT5. p53-like subtype shows a broad expression range of both genes. Basal tumors show a slightly higher proliferation rate.
Kaplan–Meier regression analysis is unfavorable for highly KRT20-expressing tumors.
4. Discussion
Treatment options for UBC have evolved minimally over the last decades. Recent genome-wide mRNA expression analyses have revealed molecular subtypes with huge prognostic and predictive impact. Here, we show the possibility of stratifying MIBC into relevant subgroups by using two of the most prominent markers of the genome-wide approaches, the inversely related cytokeratins KRT5 and KRT20, as surrogate markers for nonluminal and luminal differentiation. KRT5 is a marker of stem or progenitor cells and can be found in basal-like carcinoma subtypes, often with squamous/sarcomatoid histological features, whereas KRT20, a marker of superficial umbrella cells, is enriched in luminal subtypes [8,9,12–15,17,20,26–28].
Figure 3.
Association of KRT5 and KRT20 mRNA expression levels with MDACC molecular subtypes (MDACC cohort). Class 1 = basal, Class 2 = p53-like, Class 3 = luminal. As expected, luminal tumors were enriched with KRT20 and basal tumors were enriched with KRT5. p53-like subtype shows a broad expression range of both genes. Basal tumors show a slightly higher proliferation rate. Kaplan–Meier regression analysis is unfavorable for highly KRT20-expressing tumors.
4. Discussion
Treatment options for UBC have evolved minimally over the last decades. Recent genome-wide mRNA expression analyses have revealed molecular subtypes with huge prognostic and predictive impact. Here, we show the possibility of stratifying MIBC into relevant subgroups by using two of the most prominent markers of the genome-wide approaches, the inversely related cytokeratins KRT5 and KRT20, as surrogate markers for nonluminal and luminal differentiation. KRT5 is a marker of stem or progenitor cells and can be found in basal-like carcinoma subtypes, often with squamous/sarcomatoid histological features, whereas KRT20, a marker of superficial umbrella cells, is enriched in luminal subtypes [8,9,12–15,17,20,26–28].
Most interestingly, the KRT20 positive luminal subtype displayed worse RFS and DSS in MIBC,
similar to previously published results in NMIBC [17,21]. This association between improved
survival and keratin mRNA expression was also evident in the MDACC cohort (Figure 3) [14].
Furthermore, high expression of KRT5 and low expression of KRT20 were associated with a lower prevalence of lymphovascular invasion and lymphonodal metastasis, which is consistent with the favorable prognosis of KRT5-enriched MIBC in our cohort. At first glance, these results seem paradoxical, since the luminal subtype including KRT20 was previously shown to be associated with a favorable prognosis [14], but are explainable due to characteristics of our cohort: (1) the KRT20 high phenotype contains 23 cases with variant histology, of which are 13 micropapillary, 6 plasmacytoid, and 4 nested UBCs, which have been shown to be highly aggressive luminal variants with poor prognosis [29–33]; (2) many luminal tumors with and without variant histology are enriched with epithelial to mesenchymal transition (EMT) like gene expression pathways [18,29]. In a recent TCGA (=the cancer genome atlas) publication, Robertson et al. demonstrated that the luminal tumor family can be further subdivided into a luminal papillary cluster (no EMT-like pattern, favorable prognosis) and two luminal phenotypes with highly aggressive behavior (luminal, luminal infiltrated), which showed worse prognosis than basal differentiated tumors [18]. Luminal tumors with variant histology clustered into the aggressive luminal tumor families. Interestingly, Hedegaard et al. demonstrated that luminal NMIBC with poor PFS exhibited a strongly activated cancer-stem-cell-like and EMT signature and showed a huge parallel to the genomically unstable and infiltrated subtypes defined by the Lund group [13,17]. Additionally, in the past, several studies demonstrated the association between high KRT20 expression and high tumor stage and grade [34]. High KRT20 expression in lymph nodes after radical cystectomy is associated with a higher tumor stage, a higher rate of micrometastasis, and a worse outcome [35]. Moreover, high expression of KRT20 in the bone marrow prior to radical cystectomy is associated with a worse outcome [36]. However, luminal tumors with favorable prognosis and KRT20/KRT5 expression above the cutoff threshold are included in the favorable Epi-Typer class 1. This could mean that highly aggressive luminal tumors exhibit a strong KRT20 polarized luminal-only phenotype with very low KRT5 expression, while less aggressive luminal tumors show a mixed expression phenotype, reflecting differentiation that is still more closely related to the normal urothelial expression phenotype. Interestingly, we could prove that luminal variants exhibit significantly higher levels of KRT20 and significantly lower levels of KRT5 than conventional or basal variants (squamous/sarcomatoid). On the other hand, highly KRT5-expressing tumors are suggested to be of basal subtype and to respond better to neoadjuvant chemotherapy [5], which did not show worse survival than conventional luminal UBC in our cohort. However, the Epi-Typer algorithm is able to stratify class 1 basal and luminal tumors to identify patients who could benefit from neoadjuvant chemotherapy. Due to the lack of patients with neoadjuvant treatment in our cohort, the predictive potential of our RT-qPCR assay has to be investigated in an upcoming study.
As demonstrated previously in NMIBC, the assessment of cytokeratin (CK) 5 and CK20 protein
expression by immunohistochemistry correlates well with KRT5 and KRT20 mRNA expression but
lacks prognostic value [21], which is in line with previous breast cancer studies investigating MKI67
(marker of proliferation Ki-67), ER (estrogen receptor), ERBB2 (Erb-B2 Receptor Tyrosine Kinase 2), and PR
(progesterone receptor) mRNA and protein expression [37]. Therefore, RT-qPCR has been considered
as a possible alternative for immunohistochemistry, as it is objective and not affected by interobserver
variability [37–40]. Furthermore, simple gene expression assays in a ready-to-use format are quite simple to
establish and to perform on small devices (e.g., Cepheid approaches) compared to immunohistochemistry
on expansive autostainers. Tests on such platforms are very cheap and highly standardized, and need
little hands-on time. Furthermore, no big laboratory inventory is needed to perform these ready-to-use
assays, and therefore they are also suitable for small centers, private practices, or labs that do not have
the opportunity to establish the extremely expensive infrastructure for next-generation sequencing or
immunohistochemistry. On the other hand, there are several disadvantages with such tests: Due to the
increased treatment individualization, they tend to oversimplify biological backgrounds. Furthermore,
important predictive genetic alterations—e.g., microsatellite instability for response to checkpoint
inhibition [41], recombinant DNA mismatch repair deficiency status for neoadjuvant chemotherapy [42],
and others—are not assessable with such simple tests. Taken together, simple tests may play a big role in initial risk stratification to stratify which patients could benefit from further large-scale analysis after initial curative treatment.
Taken together, our data suggest that RT-qPCR-based molecular subtyping of UBC by KRT5 and KRT20 mRNA expression is a suitable method to predict RFS and DSS of MIBC patients (Epi-Typer) and could be used in small centers without access to huge immunohistochemistry facilities. Since our study is limited by its retrospective nature, small study cohort, and data from a single center, our results have to be further investigated in upcoming prospective trials with regard to specific treatment modalities.
Supplementary Materials:
Supplementary materials can be found at http://www.mdpi.com/1422-0067/19/11/
3396/s1.
Author Contributions:
Study conduction: B.K., C.B., M.B., A.H., P.E.; Study supervision: B.K., C.B., M.B., A.H., P.E.; Data acquisition—Follow-up data: M.G.W., K.N., P.E., C.B.; Pathological reevaluation: M.E., S.P., A.H.; qPCR assessments: R.M.W., R.S., D.S., S.E., K.N.; Data analysis: M.E., J.B., W.O., D.S., P.E.; Manuscript writing: M.E., P.E.; Critical revision of the manuscript: All contributing authors.
Funding:
This study was funded by the German Cancer Aid (DKG), grant number 110541.
Conflicts of Interest:
The authors declare no conflict of interest.
Abbreviations
UBC urothelial bladder cancer MIBC muscle-invasive bladder cancer
CK cytokeratin
KRT keratin
MKI67 marker of proliferation Ki67
CALM2 calmodulin 2
FFPE formalin-fixed paraffin-embedded MDACC MD Anderson Cancer Center PFS progression-free survival RFS recurrence-free survival DSS disease-specific survival
NMIBC non-muscle-invasive bladder cancer
RT-qPCR reverse-transcription quantitative polymerase chain reaction References
1. Jemal, A.; Bray, F.; Center, M.M.; Ferlay, J.; Ward, E.; Forman, D. Global cancer statistics. CA Cancer J. Clin.
2011,
61, 69–90. [CrossRef] [PubMed]
2. Shah, J.B.; McConkey, D.J.; Dinney, C.P. New strategies in muscle-invasive bladder cancer: On the road to personalized medicine. Clin. Cancer Res.
2011,17, 2608–2612. [CrossRef] [PubMed]
3. Svatek, R.S.; Hollenbeck, B.K.; Holmang, S.; Lee, R.; Kim, S.P.; Stenzl, A.; Lotan, Y. The economics of bladder cancer: Costs and considerations of caring for this disease. Eur. Urol.
2014,66, 253–262. [CrossRef] [PubMed]
4. Svatek, R.S.; Shariat, S.F.; Novara, G.; Skinner, E.C.; Fradet, Y.; Bastian, P.J.; Kamat, A.M.; Kassouf, W.;
Karakiewicz, P.I.; Fritsche, H.M.; et al. Discrepancy between clinical and pathological stage: External validation of the impact on prognosis in an international radical cystectomy cohort. BJU Int.
2011,107, 898–904. [CrossRef] [PubMed]
5. Seiler, R.; Ashab, H.A.; Erho, N.; van Rhijn, B.W.; Winters, B.; Douglas, J.; Van Kessel, K.E.; Fransen van de Putte, E.E.; Sommerlad, M.; Wang, N.Q.; et al. Impact of Molecular Subtypes in Muscle-invasive Bladder Cancer on Predicting Response and Survival after Neoadjuvant Chemotherapy. Eur. Urol.
2017,72, 544–554.
[CrossRef] [PubMed]
6. Perou, C.M.; Sorlie, T.; Eisen, M.B.; van de Rijn, M.; Jeffrey, S.S.; Rees, C.A.; Pollack, J.R.; Ross, D.T.;
Johnsen, H.; Akslen, L.A.; et al. Molecular portraits of human breast tumours. Nature
2000,406, 747–752.
[CrossRef] [PubMed]
7. Cancer Genome Atlas Network. Comprehensive molecular portraits of human breast tumours. Nature
2012,490, 61–70. [CrossRef] [PubMed]
8. Blaveri, E.; Simko, J.P.; Korkola, J.E.; Brewer, J.L.; Baehner, F.; Mehta, K.; Devries, S.; Koppie, T.; Pejavar, S.;
Carroll, P.; et al. Bladder cancer outcome and subtype classification by gene expression. Clin. Cancer Res.
2005,