• Keine Ergebnisse gefunden

Exercise 4: Fan control and temperature sensor G. Kemnitz

N/A
N/A
Protected

Academic year: 2021

Aktie "Exercise 4: Fan control and temperature sensor G. Kemnitz"

Copied!
3
0
0

Wird geladen.... (Jetzt Volltext ansehen)

Volltext

(1)

Exercise 4: Fan control and temperature sensor

G. Kemnitz , TU Clausthal, Institute of Computer Science May 23, 2012

Abstract

A fan has to be controlled by a pulse width modulated (PWM) signal. From the PWM sig- nal of a temperature sensor the temperature should be determined and displayed hexadecimal in grad Celsius at the 7-segment display.

1 Pulse width modulation

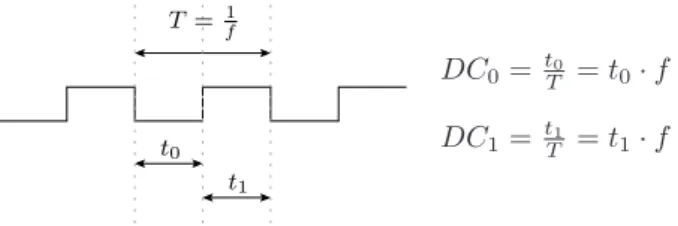
In a digital signal with constant frequency f the duty cycle is the ratio between the duration of the high value and the signal period T = 1 f (figure 1).

t

0

t

1

T =

1f

DC 0 = t T

0

= t 0 · f DC 1 = t T

1

= t 1 · f

Figure 1: Definition of the duty cycle

A clock signal usually has the duty cycle DC 1 = DC 0 = 50%. The duty cycle can vary continuously, so in PWM signals continuous values can be coded. First exercise is to design a circuit to control the speed of the fan at the corresponding expansion board on plug A1 via PWM.

With a large duty cycle DC 1 the fan should move fast and with a small duty cycle it should move slow. (figure 2). The value of the duty cycle should be adjustable via the switches sw1 to sw3 in eight steps.

DC 1 = 0, 75 DC 1 = 0, 25 movement

slow movement fast

Figure 2: PWM signal for fan control

2 Temperature sensor

On the expansion board is also a temperature sensor. It is behind the fan and o type SMT160.

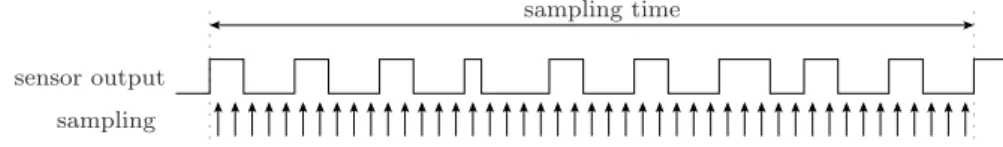
This sensor summits the temperature PWM coded. According to the data sheet the relation between temperature and pulse width is:

DC 0 = 0, 32 + 0, 0047 · T

Tel. 05323/727116

1

(2)

(T – temperature in °C). The temperature to be calculated is in dependence of the duty cycle:

T = DC 0 − 0, 32 0, 0047

To calculate the duty cycle DC 0 the PWM output signal of the temperature sensor must be sampled with a high enough frequency over a longer period of time (figure 3).

sampling time

sensor output sampling

Figure 3: Sampling of the PWM output signal of the temperature sensor

During this the number of

low values

are counted and the result divided by the number of all sampling values. In the figure 45 values are sampled and 27 times the sampling value is zero.

Inserted into the formula the duty cycle is DC 0 = n 0

N = 27 45 = 0, 6 and the temperature:

T = 0, 6 − 0, 32

0, 0047 ≈ 60°C

To calculate the temperature by hardware the division should be avoided by using a power of two for the divider. For a hardware divider costs at least a state machine, a subtracter, a block shifter etc. (see [ ? , p. 177]). The division by N = 2 k is a right shift by k bits. The division by 0,0047 can be substituted by a multiplication with the reciprocal value. The simplified formula to calculate the temperature in degree Celsius is:

T ≈ srl (213 · n 0 , k) − 68 (srl(a, b) – right shift of a by b bits).

3 Test and modification of the example design

Download the files a4 pwm.xise, a4 pwm.vhd, and a4 pwm.ucf from the web page and copy them in the working folder in your home directory. Open the project in ISE. Confirm that the add-on board with the fan and the temperature sensor is plugged to A1 of the FPGA board and ready for work:

• 12 V power supply voltage (red LED beside the power connector is on).

• Ein/Aus-switch on the expansion board

on

(ein), (red LED over the switch is on).

• Other both switches on the expansion board to position P1.1 and P1.0. respectively.

The following exercises has to be solved:

1. Translate the project, program the board and test the circuit. With switch SW1 the fan can be turned on and off. Try to control fan speed manually.

2. Change the fan control so that eight different fan speeds can be set by the switches SW1 to SW3.

2

(3)

3. Plug the logic analyzer to pin

DB0

of the expansion board plugged to A2 and display the output of the temperature sensor. The required xml file with trigger conditions etc. should be created by yourself. Estimate for the recorded signal the duty cycle DC 0 and calculate the temperature from it. Turn on the heating resistor by SW0, to increase temperature slowly. Wait until the sensor has warned-up noticeable. Record the sensor signal again with the logic analyzer an determine the temperature again.

4. Design in VHDL the functional description of a circuit,

• which samples the input with a frequency of 400 KHz and with N = 2 16 sampling points,

• counts the number of low levels,

• calculates the temperature for it and

• displays the temperature values at the 7-segment display with two hexadecimal digits.

Of the four 7-segment digits on the board the most left should be dark, the second and the third should display the two hexadecimal digits and the most right the character

h

. Note that arithmetic operations are only defined for the data types signed and unsigned from pack- age

numeric std

and for integer and natural. To add two operands of the type std logic vector, both operands first have to be converted by same named functions to

signed

or

unsigned

and the result back to

std logic vector. The addition of two bit vectors a and b as unsigned numbers has to be described by:

y <= std logic vector(unsigned(a) + unsigned(b));

4 Additional exercise

On the expansion board is also a RGB-LED. This LED can be also controlled by PWM signals to display different colors. Design a circuit, that allow to adjust color values for red, green and blue by for different duty cycles via two switches each. As the result it should be possible to select between 2 6 different colors. The pin assignment to the RGB LED can be found in the ucf-file as commends.

5 Check list for the compliance test

• Eight adjustable fan speeds.

• Two manually calculated temperature values for waveforms recorded by the logic analyzer, one without and the second with switched on heating resistor (keep waveform data and calculation way).

• Display of plausible temperature values on the 7 segment display. The values must increase if the heating resistor is switched on and decrease if the cooling fan is switched on.

References

3

Abbildung

Figure 1: Definition of the duty cycle
Figure 3: Sampling of the PWM output signal of the temperature sensor

Referenzen

ÄHNLICHE DOKUMENTE

The results indicate that a temperature variability level of 1.5 standard deviations above the historical local temperature during the first trimester of pregnancy reduces birth

The market clearing price is equal to unit wage costs if the expenditure ratio is unity and distributed profit is zero.. In this elementary case, profit per unit is zero and

measured temperatures d o not reflect true formation temperatures, temperature changes measured shortly aftci drilling completion may indicate fluid movement in the

During summer, the temperature of the water column ranges between 4 and 6 in the deep to 16 ◦ C near the surface which results in the krill being exposed to temperature differences

[r]

ABSTRACT: A balance circuit for neutralizing offsets and drift of all inputs to the summing amplifier of a DC servo in cluding: a balance amplifier for comparing the drive signal ap

Analytical results for energy barriers and switching field exist so far only in the zero-temperature limit (most prominent here is the Stoner-Wohlfarth theory [18])

Chapter 3 then discusses one of the most success- ful VGI projects, which is OSM, and provides a comprehensive introduction to this data source, including how it is being used in