C OMPLEX POPULATION DYNAMICS IN MICROBIAL SYSTEMS
Inaugural-Dissertation zur
Erlangung des Doktorgrades
der Mathematischen-Naturwissenschaftlichen Fakultät
der Universität zu Köln
vorgelegt von
Lutz Becks
aus Jülich
Köln
2006
Berichterstatter: Prof. Dr. Hartmut Arndt Prof. Dr. Eric von Elert
Tag der letzten mündlichen Prüfung: 24.Oktober 2006
“Einst vor langer Zeit waren die Spiegelwelt und Menschenwelt noch nicht getrennt. Zu jener Zeit konnte man auch durch den Spiegel hindurch kommen und gehen. Eines Nachts jedoch drangen die Spiegelwesen ohne Warnung in unsere Welt ein, und es brach Chaos aus.
Die Menschenwesen stellten schnell fest, dass die Spiegelwesen das Chaos selbst darstellten. ... Dank der magischen Fähigkeiten des Gelben Kaisers gelang es, sie durch einen mächtigen Zauber zu besiegen und in ihren Spiegel zurückzutreiben.
Eines Tages wird der Zauber aber so schwach werden, dass sich in unserem Spiegel turbulente Gestalten zu regen beginnen. ... Und plötzlich wird die lange eingekerkerte Welt des Chaos in unsere eigene Welt hinein überkochen.“
Ist es schon da?
“Once before long time the mirror world and the people world were not yet separated. To that time one could come and go by the mirror through. One night, however, the mirror natures penetrated into our world without warning, and it broke chaos off.
The people stated fast that the mirror natures represented the chaos themselves. … Owing to the magic abilities of the yellow emperor, one suc- ceeded to defeat by driving them back into the mirror by a powerful charm.
One day, however, the charm will become so weak that in our mirror tur- bulent shapes begin to move. … And the long incarcerated world of the chaos suddenly will cook over into our own world. “
Is it already there?
From “Complete works of Chuang-tzu, 1968“
D ANKSAGUNG
Mein ganz besonderer Dank gilt Prof. Hartmut Arndt für das in mich gesetzte Vertrauen bei der Überlassung des Themas, für die Möglichkeit zur Promotion und für anregende Gespräche und Diskussionen. Weiterhin danke ich Hartmut Arndt für jegliche Unterstützung bei meinem wissenschaftlichen Werdegang in Form von Anträgen, Gutachten und finanzieller Unterstützung bei Tagungen und Kongressen.
Prof. Eric von Elert danke ich herzlich für die Begutachtung der Promotion.
Ein großer Dank geht an Prof. Dr. Klaus Jürgens für die Bereitstellung der in der Arbeit verwendeten Bakterien und spezifischen Antikörper und an Frank Hilker und Horst Malchow für die Hilfe bei theoretischen Fragen.
Bei der gesamten AG Arndt, den aktuellen und vergangenen Kollegen, möchte ich mich für die Hilfe und Unterstützung bedanken. Ich danke aber auch für die eine oder andere Tasse Kaffee und Espresso und Eis verbunden mit einem netten Gespräch.
Der Graduiertenförderung der Universität zu Köln danke ich für die finanzielle Unterstützung und der Deutschen Forschungsgemeinschaft (DFG) für die Bereitstellung der im Rahmen dieser Arbeit benötigten Sachmittel.
Bei Fred Bartlett bedanke ich mich für die Korrekturen des Englisch in Kapitel II und III dieser Arbeit.
All meinen Freunden, die mich in den Jahren meines Studiums und meiner Promotion begleitet haben und sich so manches Gejammer anhören mussten.
Mein ganz besonderer Dank gilt meinen Eltern, ohne die diese Arbeit nicht zustande gekommen wäre.
C ONTENTS
Introduction 11 I. Theoretical frame work of analyses of the dynamic
behaviours in three-species food webs 19 II. Experimental demonstration of chaos in a micro-
bial food web 35 III. Short transitions in experiments with chaotic
three-species food webs 47 IV. Persistence of complex dynamics in microbial
coupled local populations 61
Abstract 73
Kurzzusammenfassung 77
I NTRODUCTION
Population dynamics is the study of how and why population numbers change with time and space. Studies of population dynamics have a long history and go back to the early decades of 1900 (Elton 1924, Volterra 1926).
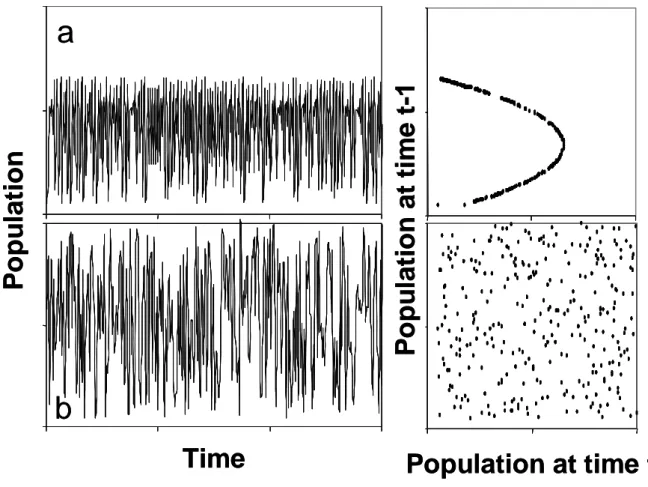
Intrinsic mechanisms - processes that pertain a focal population - and extrinsic mechanisms interact by determining population dynamics and lead to different dynamic patterns. On one hand, extrinsic processes are often stochastic and may lead to dynamics without any pattern. On the other hand, extrinsic forces may have a strong seasonal character leading to seasonal population fluctuations. Deterministic intrinsic processes can generate also different patterns of dynamic behaviours such as damped oscillations, stable limit cycles, or chaotic dynamics. Even though chaotic dynamics appear to be without any pattern like the stochastic fluctuations there is a clear distinction between the two processes. For chaotic dynamics there is dependence between the states of the system over time, while pure stochastic dynamics are lacking any dependence between states. The dependence can easily be shown by means of time delay reconstructions (Fig. 1). The chaotic systems show a clear pattern (Fig. 1a) but no pattern is detectable for the stochastic dynamics (Fig. 1b). Furthermore, chaos is characterised by a sensitivity to initial conditions, which means infinitesimal differences in the starting values of the system amplify and lead to complete different fluctuations over time.
Sensitivity to initial conditions is indicated by a positive Lyapunov exponent λ.
In contrast, differences in initial conditions are damped over time in stochastic systems. A third important attribute of chaotic patterns is that they have upper and lower boundaries (state value never over- or respectively undershoot certain values), because data (system states) stay inside an attractor. Hence, chaotic dynamics are predictable on a short time-scale.
Stochastic dynamics have no boundaries and thus lack predictability on any time scale. While the first two attributes are mainly used to distinguish chaos from stochasticity, the second and latter one may be used for applied methods (Hastings et al. 1993). However, the interactions of intrinsic and extrinsic processes make the understanding and prediction of population dynamics difficult, but fascinating.
The focus on intrinsic driven patterns and chaos was introduced to
population ecology by the works of Robert May (1974) who showed that a
simple mathematical model reveals different intrinsic driven dynamics by
changing one control parameter. He showed that the logistic growth equation exhibits complex dynamic behaviour in dependence on the growth rate r, and for high r values even chaos. Therewith chaos became a subject of ecology and an ongoing intensive and controversial debate about the occurrence and meaning of chaos in population dynamics began.
The occurrence of complex intrinsic driven dynamics and chaos was found in many deterministic mathematical models, from one-species to multi- species systems involving more and more ecological mechanisms discovered over time (e g. Gilpin 1979, Hastings & Powell 1991, Fussmann et al. 2005). These theoretical studies conveyed that chaos might be a common pattern in population dynamics for certain parameter settings. An
Time
P opu lati on at tim e t- 1
Population at time t
Po p u la ti o n
a
b
Time
P opu lati on at tim e t- 1
Population at time t
Po p u la ti o n
a
b
Fig. 1. Comparison of chaotic (a) and stochastic (b) fluctuations shown
as time series and the corresponding time delay reconstruction where
the population densities are plotted against the population density the
day before. Chaotic time series is generated by the logistic growth
equation with r = 2.9, stochastic time series are random numbers
between 0.1 and 2.
empirical support for the occurrence of chaos in population dynamics - from experiments or field data - is rare, which leads some studies to conclude that chaos does not occur or is negligible (Chattopadhyay & Sarkar 2003).
Potential reasons for the discrepancy between theoretical and empirical studies are miscellaneous. One problem is that signals of deterministic processes, thus also chaos, of empirical data are woven together with stochasticity, making field data samples insufficient for the analysis of the meaning of chaos, even combined with mathematical modelling (Ellner &
Turchin 1995). Controlled laboratory experiments with a reduced and manageable population system have been shown as a useful tool to study population dynamics regarding intrinsic mechanisms (Costantino et al. 1997, Fussmann et al. 2000). Complex dynamics, from damped oscillations, stable limit cycles to chaos, was shown for the one-species system of the flour beetle Tribolium castaneum. Damped oscillations and stable limit cycles were shown for a two-species system of an algae-rotifer system. Mathematical models pointed out that the length and the linkages in a food web are relevant for the occurrence of chaos. Long food chains with no or less linkages between the trophic levels tend to show a high potential for chaotic dynamics (in the sense of a large parameter range). More links between the trophic levels are predicted by mathematical models to reduce the potential of chaos in the food web (Fussmann & Herber 2002, Gross et al. 2005).
Chaos was only shown in a one-species system (Costantino et al. 1997) and empirical studies on chaos in multi-species systems may shed more light on the question if chaos occurs in population dynamics.
The question if chaotic dynamics are exhibited in the real world is not
restricted to population ecology. Other nonlinear biological systems are
thought to exhibit chaotic dynamics, but most of them are lacking possibilities
to study the chaotic behaviour experimentally. For instance, mathematical
models were shown to describe the behaviour of measles dynamics over the
last years. But it is impossible to test the model hypothesis that measles
dynamics are chaotic (Earn et al. 2000). Other systems like dynamics in
human brain (Tirsch et al. 2004), heart dynamics, or the interplay between
glucose and insulin in the blood (Kroll 1999) show also indications for chaotic
dynamics. But again, manipulations to study these system behaviours are
restricted.
The present study should find answers to the question of relevance of chaos in population dynamics by means of an experimental multi-species system. Experiments with complex population dynamics of a three-species system should be conducted to study the persistence and the transitional behaviour of the dynamics. The persistence of complex behaviour and especially chaotic dynamics in response to disturbance are important for the understanding of chaos in nature and for the spatial and temporal extent of chaotic dynamics. Therefore a conceptional model of a two-prey-one- predator system should be implemented into a microbial laboratory system. A clear defined species composition by the use of axenic cultures should enable the study of complex population dynamics. The possible persistence of deterministically driven population dynamics should be analysed: First, by a change in one experimental parameter and second by coupling of different populations with different intrinsic dynamics.
References:
Chattopadhyay, J. & Sarkar, R.R. Chaos to order: preliminary experiments with a population dynamics model of three trophic levels. Ecol. Model. 163, 45-50 (2003).
Costantino, R.F., Desharnais, R.A., Cushing, J.M. & Dennis, B. Chaotic dynamics in an insect population. Science 275, 389-391 (1997).
Earn, D.J.D., Rohani, P., Bolker, B.M. & Grenfell, B.T. A simple model for complex dynamical transition in epidemics. Science 287, 667-670 (2000).
Ellner, S. & Turchin, P. Chaos in a noisy world: new methods and evidence from time series analysis. Am. Nat. 145, 343-375 (1995).
Elton, C.S. Periodic fluctuations in the number of animals: Their causes and effects.
British Jour. of Exp. Biol. 11, 215-244 (1924).
Fussmann, G. F., Ellner, S. P., Shertzer, K.W. & Hairston, N.G. Jr. Crossing the Hopf bifurcation in a live predator-prey system. Science 290, 1358- 1360 (2000).
Fussmann, G. F. & Heber, G. Food web complexity and chaotic population dynamics. Ecol. Lett. 5, 394-401 (2002).
Fussmann, G.F., Ellner, S., Hairston, N.G.Jr., Jones, L.E., Shertzer, K.W. &
Yoshida, T. Ecological and evolutionary dynamics of experimental plankton communities. Advances in Ecological Research 37, 221-244 (2005).
Gilpin, M.E. Spiral chaos in a predator-prey model. Am. Nat. 113, 306-308 (1979).
Gross, T., Ebenhöh, W. & Feudel, U. Long food chains are in general chaotic.
Oikos 105, 135-144 (2005).
Hastings, A. & Powell, T. Chaos in a three-species food chain. Ecology 72, 896- 903 (1991).
Hastings, A., Hom, C.L., Ellner S., Turchin, P. & Godfray, H.C.J. Chaos in ecology:
Is Mother Nature a strange attractor? Annu. Rev. Ecol. Syst. 24, 1-33 (1993).
Kroll, M.H. Biological variation of glucose and insulin includes a deterministic chaotic component. BioSystems 50, 189-201 (1999).
May, R. M. Biological populations with nonoverlapping generations: stable points, stable cycles, and chaos. Science 186, 645-647 (1974).
Tirsch, W.S., Stude, P., Scherb, H. & Keidel, M. Temporal order of nonlinear dynamics in human brain. Brain Research Reviews 45, 79-95 (2004).
Volterra, V. Fluctuations in the abundance of a species considered mathematically.
Nature 118, 558-600 (1926).
C HAPTER I
T HEORETICAL FRAME - WORK OF ANALYSES OF THE DYNAMIC BEHAVIOURS IN THREE -
SPECIES FOOD WEBS
Since Robert May showed in the 1970´s that populations exhibit different complex dynamics for the simple discrete logistic growth equation - like stable equilibrium, stable limit cycles and chaos - different approaches have evolved to understand and analyse population dynamics. One approach following the idea of May is to find general patterns and mechanisms in mathematical population models. Furthermore, time series analyses of field data or experimental results are a tool to understand population dynamics.
Combining mathematical modelling with time series analyses of experimental data is probably most efficient. Field data have the great disadvantage that deterministic and stochastic processes interact, which makes a detection of a general mechanism in pattern formation difficult (Turchin 2003). Laboratory experiments under constant controlled conditions minimize the stochastic behaviour to a tradable degree. Due to short generation times (sometimes less than one day), microorganisms like bacteria and protozoa have a long history in experimental population studies (Gause 1934, Jessup et al. 2004, Luckinbill & Fenton 1978). One can observe many generations in a relatively short time period. Furthermore the use of microorganisms or small metazoan enables the possibility to conduct experiments under clearly defined conditions which is necessary to understand mechanisms in population dynamics (Cadotte et al. 2005). Microorganisms are mainly cultured under batch or flow through conditions. One of the main advantages of flow through conditions like in a chemostat are that the dilution rate of the system can be used as a control parameter of the system and changes in the dilution rate may lead to different dynamic behaviours (e.g. Vayenas & Pavlou 1999, Fussmann et al. 2000, Kooi & Boer 2003).
To include the most relevant mechanism for population communities,
competition and consumption (Chase et al. 2002), one of the simplest three
species systems is a two-prey-one-predator system. Coexistence for the
three species is possible if the preferred prey of the predator is assumed to
be the superior competitor. A conceptual model of a two-prey-one-predator
system is described in Fig. 1. Considering one randomly chosen starting
situation (a in Fig. 1). The preferred prey and superior competitor are highly
abundant, while the less preferred prey (and inferior competitor) and predator
are at low densities. Due to the high supply of the preferred food, the
predator population increases. But at the same time the grazing pressure on
the preferred prey and superior competitor increases and their population abundance decreases simultaneously (b in Fig.1). In this situation the grazing pressure is still high on the superior competitor and the inferior competitor can overgrow the superior competitor.
In turn, the predator abundance decreases because the preferred prey is low abundant (c in Fig. 1).
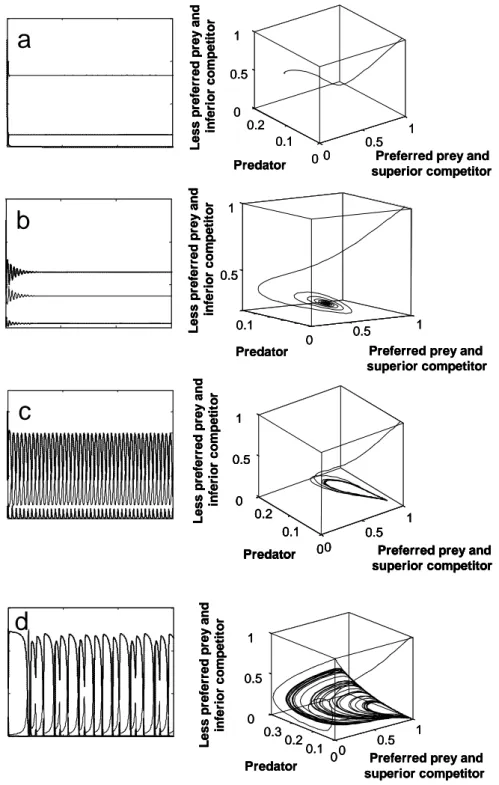
Now the grazing pressure is decreasing on the preferred prey and the superior competitor population increases, while the less preferred prey and inferior competitor populations decrease (a in Fig.1). Four different types of dynamic behaviour can be revealed by this simple three species system. Figure 2 summarizes the typical population dynamics as time series and Poincaré plots where the population abundances for each population are plotted against each other. The Poincaré plots show the typical attractors corresponding to the underlying dynamic behaviour. First, one of the species can go extinct due to high grazing activity by the predator and a low growth rate, while the two other species coexist at equilibrium (Fig. 2a). Second, all three species coexist at equilibrium due to the same rates of loss and growth (Fig. 2b). Third, if the cycle in Fig. 1 is always exactly repeated, the system shows stable limit cycles (Fig. 2c). Fourth, it is possible that the same cycle is never repeated and the system exhibit chaotic dynamics (Fig. 2d). The corresponding attractors are point attractors for coexistence at equilibrium (Fig. 2a, b left column), ring attractors for stable limit cycles (Fig. 2c left column) and strange attractors for chaos (Fig. 2d left column).
b
c a
Fig. 1: Schematic two-prey-one- predator system. Ciliate drawing represents the predator, rods the preferred prey and superior competitor, and circles the less preferred prey and inferior competitor.
b
c a
b
c a
Fig. 1: Schematic two-prey-one- predator system. Ciliate drawing represents the predator, rods the preferred prey and superior competitor, and circles the less preferred prey and inferior competitor.
The aim of this work was to find a mathematical model of a two-prey-
one-predator system under controlled chemostat conditions that can be
tested experimentally. Control parameters should be found that trigger the
system to exhibit different dynamic behaviours such as coexistence at
equilibrium of the three species, stable limit cycles and chaotic dynamics.
0.5 1 0
0.1 0.5
1
Preferred prey and superior competitor Predator
Lesspreferredpreyand inferior competitor
b a
0
0.5 1 0
0.1 0.2 0 0.5
1
Preferred prey and superior competitor Predator
Lesspreferredpreyand inferior competitor
c
Lesspreferredpreyand inferior competitor
0
0.5 1 0
0.1 0.2 0 0.5
1
Preferred prey and superior competitor Predator
d
0 0.5 1
0.1 0 0.30.2 0 0.5
1
Preferred prey and superior competitor Predator
Lesspreferredpreyand inferior competitor
0.5 1
0 0.1
0.5 1
Preferred prey and superior competitor Predator
Lesspreferredpreyand inferior competitor
0.5 1
0 0.1
0.5 1
Preferred prey and superior competitor Predator
Lesspreferredpreyand inferior competitor
b b a a
0
0.5 1 0
0.1 0.2 0 0.5
1
Preferred prey and superior competitor Predator
Lesspreferredpreyand inferior competitor
0
0.5 1 0
0.1 0.2 0 0.5
1
Preferred prey and superior competitor Predator
Lesspreferredpreyand inferior competitor
c c
Lesspreferredpreyand inferior competitor
0
0.5 1 0
0.1 0.2 0 0.5
1
Preferred prey and superior competitor Predator
Lesspreferredpreyand inferior competitor
0
0.5 1 0
0.1 0.2 0 0.5
1
Preferred prey and superior competitor Predator 0
0.5 1 0
0.1 0.2 0 0.5
1
Preferred prey and superior competitor Predator
d d
0 0.5 1
0.1 0 0.30.2 0 0.5
1
Preferred prey and superior competitor Predator
Lesspreferredpreyand inferior competitor
0 0.5 1
0.1 0 0.30.2 0 0.5
1
Preferred prey and superior competitor Predator
Lesspreferredpreyand inferior competitor
Fig. 2: Typical dynamic pattern occurring in mathematical models of a two- prey-one-predator system as time series (left columns) and Poincaré plots, where population densities are plotted against each other (right columns). (a) Extinction of one population and stable equilibria for the other two populations and a resulting point attractor in the Poincaré plot, (b) stable equilibria for all three populations and a corresponding point attractor, (c) stable limit cycles forming a characteristic ring attractor in the Poincaré plot, and (d) chaos with a corresponding strange attractor (after Takeuchi & Adachi, 1983; model parameterised with b1 = b2
= b3 =1.0, α = 1.0, β = 1.5, µ = 1.0, d = 0.5, (a) e = 3, (b) e = 5, (c) e = 6, and (d) = 9;
initial values 1.0 for the prey population and 0.01 for the predator population).
Mathematical Model
The dynamic behaviour of mathematical models of two-prey-one- predator systems has been analysed through the last decades showing that complex dynamics occur. Most models use continuous time systems to describe the population changes over time regarding changes in the parameter setting. Fujii (1977) showed that a two-prey-one-predator system reveals limit cycles for a Lotka-Volterra model with a linear type of functional response. Vance (1978) and later Gilpin (1979) discovered spiral chaos for this system. Takeuchi and Adachi (1983) analysed a Lotka-Volterra model and could show that the occurrence of chaotic dynamics depends on the greater competitive abilities of one prey population compared to the strength of the prey preference of the predator. The complex dynamics of the three populations occurs also in models of microbial two-prey-one-predator systems under chemostat conditions for different dilution rates of the chemostat system (Vayenas & Pavlou 1999, Kooi & Boer 2003, Vayenas et al. 2005). The dilution rates that reveal complex dynamics like stable limit cycles or chaos were for all models low, with D < 0.1 d
-1and intervals of 0.01 d
-1. An experimental implementation of such low dilution rates in chemostats is hardly realisable. Even though microorganisms reproduce fast the experimental conditions must be constant for at least 30 days to see the asymptotic or long-term behaviour of the populations. To find a mathematical model that shows complex dynamics for dilution rates that are realisable in experiments with microbial two-prey-one-predator systems, a model after Takeuchi & Adachi (1983) was adapted to chemostat conditions by introducing the dilution rate D. The intrinsic death rate b
3of the predator was replaced by the dilution rate D.
dx
1/dt = x
1* (b
1- x
1- α*x
2– e*z - D)
dx
2/dt = x
2*(b
2- β*x
1- x
2- µ*z - D) c dz/dt = z * (d*e*z - d*µ*z - D)
x
1and x
2denote the densities of the two prey and z the density of the predator population. b
1and b
2are the intrinsic rates of increase, α > 0 and β
> 0 are parameters, that describe the competitive effect between the two
prey species, e > 0 and µ > 0 are coefficients of decrease of the prey species
due to predation, d > 0 is the transformation rate of the predator describing the amount of energy that can be used for growth, D is the dilution rate of the chemostat system per day. The model was parameterised with b
1= b
2= 1.0 per day; α = 1.0, β = 1.5, µ = 1.0, d = 0.5, and x
1(0) = 1.0, x
2(0) = 1.0, and z (0) = 0.01 as initial values for the population. The prey preference e was used as a bifurcation parameter and varied between 0 and 8 (0 < e < 8). The dilution was varied between 0 and 1 (0 < D < 1) to analyse the dynamic behaviour of the system regarding the dependence on the dilution rate.
Model analyses were done using Matlab 7.0 Release 14 (Mathworks Inc.).
Prey preference e Dilutionrate D[d-1]
0 2 4 6 8
0 0.2 0.6 0.8 1.0
0.4
c d
e f a
b
10 Prey preference e
Dilutionrate D[d-1]
0 2 4 6 8
0 0.2 0.6 0.8 1.0
0.4
c d
e f a
b
10
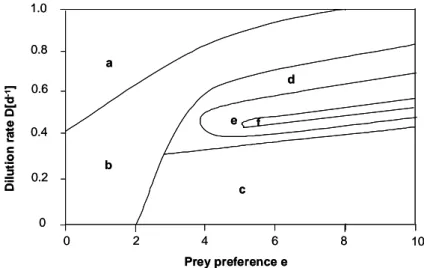
Fig. 3: Operating diagram for the mathematical two-prey-one-predator model c under chemostat conditions summarizing the dynamic behaviour of the population depending on the prey preference e and the dilution rate D. Region a: Extinction of the less preferred prey x2 and the predator z. Region b: Extinction of the less preferred prey x2. Region c: Extinction of the preferred prey b1 and the predator z. Region d: Coexistence of the two prey x1, x2, and the predator z at an equilibrium. Region e: Coexistence of the two prey x1, x2, and the predator z at stable limit cycle. Region f: Coexistence of the two prey x1, x2, and the predator z showing irregular fluctuations, probably chaos.
The introduction of the dilution rate D did not change the general dynamic
behaviour of the two-prey-one-predator model compared to the results of
Takeuchi and Adachi (1983). Fluctuating dynamics occurred for dilution rates
0.3 < D < 0.8 d
-1for e > 2 with a shift to higher dilution rates for increasing
predation rates e. Irregular dynamics - likely chaos - were found for a small
parameter set of e and D (f in Fig. 3).
Experimental system
A microbial community was chosen to analyse the dynamic behaviours in a two-prey-one-predator system predicted by model c. We used a defined community from axenic cultures to ensure a constant species composition in the experimental system. The system consisted of the bacterivorous ciliate Tetrahymena pyriformis (average length 85µm * 22µm; from CCAP 1630/1W) as the predator and the two bacteria Pedobacter spec. (Cytophaga Flexibacter group, 2 * 1 µm) and Brevundimonas spec. (α-Proteobacter, 2,5 µm * 2,5µm) isolated by K. Beck from Lake Schöhsee, Germany, and kindly provided by Klaus Jürgens, Rostock-Warnemünde) as prey organisms.
Coexistence of two competing species is possible by predator mediated coexistence (Hairston et al. 1960, HilleRisLambers & Dieckmann 2003).
Coexistence is ensured if the predator preys preferentially on one prey species and the preferred prey is the superior competitor at the same time.
Prey preference of the predator Tetrahymena was determined in grazing experiments and competition abilities were analysed in chemostat experiments without predation.
Grazing experiments
Grazing experiments were carried out in 50-ml-tissue culture flasks
(Sarstedt) to determine the grazing rates of Tetrahymena on Pedobacter and
Brevundimonas. Five times 7.5 ml of both bacterial liquid cultures (in
PPY100: 0.2 g/l proteose peptone, 0.025 g/l yeast extract) with an equal
density of about 4*10
6were added to 5 ml of a Tetrahymena culture. Since
specific antibody staining worked only until the first three minutes after
vacuole formation, grazing experiments were terminated by adding buffered
paraformaldehyde (Eisenmann et al. 1998; 4.4% paraformaldehyde, 150 µl/l
1 M NaOH, 7.6 g/l NaCl, 1.57 g/l Na
2HPO
4* 2 H
20, 0.47 g/l NaH
2PO
4) after
three minutes. The fixed samples were collected on black 0.8 µm pore-size
polycarbonate membrane filters and washed 2 times with 5 x PBS buffer
(Phosphate Buffered Saline: 40g/ml NaCl, 1 g/l KCl, 5.76 g/l Na
2HPO
4*2H
2O,
1 g/l KH
2PO
4; pH 7.3). The ingested bacteria were determined in the food
vacuoles by using immunofluorescence and DAPI (4',6-diamino-2-
phenylindole, Porter & Feig 1980) labelling. The following protocol was used:
Samples were treated with Triton X-100 (Merck Chemicals; final concentration 8%) for permeabilization of the ciliate membranes to ensure a better labelling result in the food vacuoles (Christoffersen et al. 1997). Triton X-100 was added to membrane filters and incubated for 20 minutes. The filter was washed three times for five minutes with PBS buffer. The strain specific antibodies were diluted 1:200 in 5% BSA (bovine serum albumin/ PBS (volume 3.0 ml)) and added to the samples which were incubated for five minutes. After washing three times with PBS, the filters were incubated with the second, Cy3-labelled antibodies (1:200 diluted with 5% BSA/PBS, volume 3.0 ml) and DAPI solution (final concentration 5 µg/ml) for 5 minutes and washed 3 times with PBS. Membrane filters were mounted on glass slides with an oil droplet (Zeiss 128 F) and stored at -20°C until microscopic analysis. Always care was taken to exclude bacterial contaminations.
Ingested bacteria were counted using the epifluorescence microscope (Zeiss Axioskop, filterset 14 for the detection of Cy3-labelled antibodies and filterset 01 to detect DAPI staining). Since both specific primary antibodies were detected by the same second, Cy3 labelled antibodies the staining could only be performed for one bacteria strain in one staining process. The bacteria abundance of the other bacteria was calculated from the differences between the total number of bacteria (enumerated from the unspecific DAPI staining) and the specific stained bacteria. Results from the first enumeration were verified, using a second staining process with the other specific antibodies.
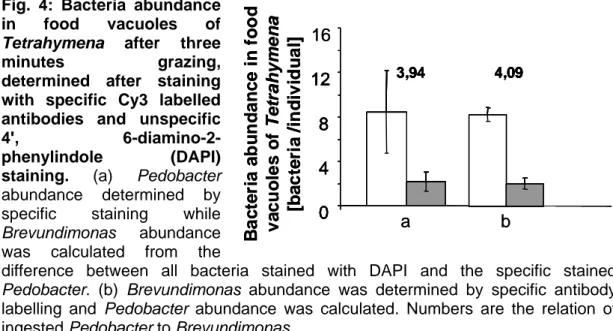
Grazing experiments revealed that both bacteria were grazed and
detectable by the use of specific antibody staining and unspecific staining
with DAPI (Figs. 4 and 5). Experiments showed that Pedobacter could be
found four times more in food vacuoles than Brevundimonas after three
minutes grazing on an equal dens mixture of bacteria (Fig. 4). Thus, we can
assume that Pedobacter is the preferred prey species of the predator
Tetrahymena by a factor of four. Both staining procedures showed the same
abundances of ingested bacteria. No differences occurred in the relation of
ingested bacteria from the two strains when either stained with specific
antibodies against Pedobacter (Fig. 4a) or against Brevundimonas (Fig 4b).
Fig. 4: Bacteria abundance in food vacuoles of Tetrahymena after three
minutes grazing, determined after staining
with specific Cy3 labelled antibodies and unspecific 4', 6-diamino-2-
phenylindole (DAPI) staining. (a) Pedobacter
abundance determined by specific staining while Brevundimonas abundance was calculated from the
difference between all bacteria stained with DAPI and the specific stained Pedobacter. (b) Brevundimonas abundance was determined by specific antibody labelling and Pedobacter abundance was calculated. Numbers are the relation of ingested Pedobacter to Brevundimonas.
Bacteri ab in foo
Fig. 5: Results from grazing experiments showing ingested bacteria in food vacuoles of Tetrahymena after staining with (a) unspecific 4', 6-diamino-2- phenylindole (DAPI) and (b) specific Cy3 labelled antibodies against Pedobacter.
Arrows indicates the food vacuoles with the bacteria.
Competition experiments
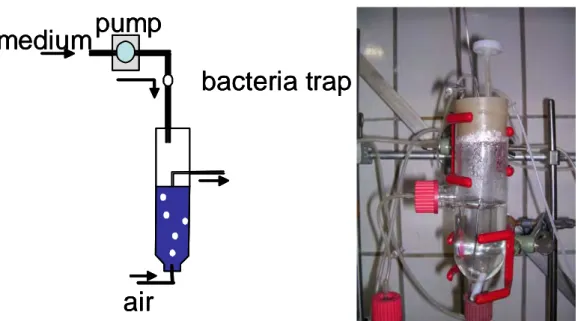
Competition experiments were run in one-stage chemostat systems (Fig. 6) at different dilution rates (D = 0.2, 0.45, 0.5, 0.75, 0.9 d
-1) with Pedobacter and Brevundimonas. Chemostat experiments were conducted under sterile and constant conditions (temperature 20 ± 1°C). Chemostats (glass vessels with a volume of 185 ml) were constantly fed with organic medium (PPY100: 0.2 g/l proteose peptone, 0.025 g/l yeast extract; pumps:
Watson Marlow 205S) and mixed by gentle aeration.
3,94 4,09
0 4 8 12 16
0 a 4 8 12
0 4 8
12 3.94 4.09
b aundanced vacuoles of Tetrahymena [bacteria /individual]
3,94 4,09
0 4 8 12 16
0 a 4 8 12
0 4 8
12 3.94 4.09
b aundanced vacuoles of Tetrahymena [bacteria /individual]
Bacteri ab in foo
a b b
a
air pump
bacteria trap medium
air pump
bacteria trap medium
air pump
bacteria trap medium
Fig. 6: Chemostat system used for competition experiments and all other chemostat experiments described in chapter II - IV. Left column show a simplified scheme of a one-stage-chemostat system. Right column shows a picture of an one-stage-chemostat reactor.
Chemostats were inoculated from overnight cultures in LB-medium (Trypton:
10 g/l, yeast extract 5 g/l, NaCl 10 g/100 ml; bacteria taken from a deep frozen stock (-80°C)) with initial densities of 1*10
5cells per ml. Triplicate samples were taken daily from the middle of the chemostats (fixation with formaldehyde, final concentration 3%) followed by staining with DAPI (4’, 6- diamino-2-phenylindole) on black 0.2 µm pore-size polycarbonate membrane filters (Porter & Feig 1980) and enumeration under an epifluorescence microscope (Zeiss Axioskop with filter set 01). At least 300 bacteria of each strain were counted per filter.
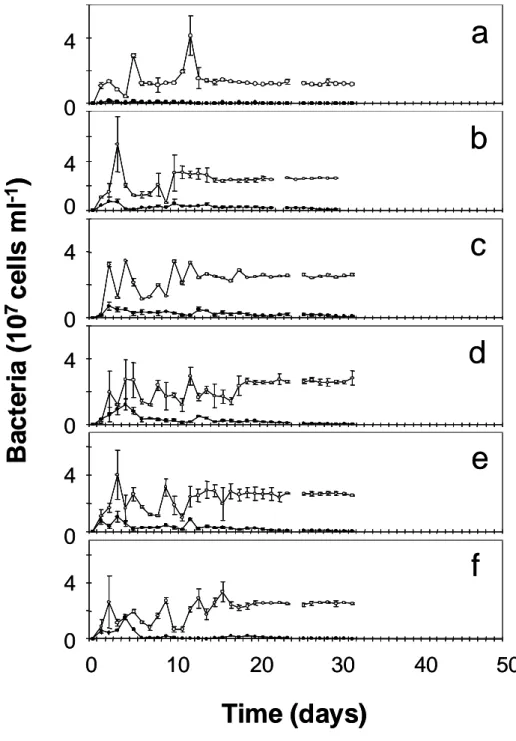
All time series recorded from the chemostat experiments revealed that
Brevundimonas was outcompeted while Pedobacter existed at stable
equilibrium (Fig. 7).
0
0 10 20 30 40
Ba c te ri a (1 0 7 ce ll s m l -1 )
Time (days)
4 0 4 0
50 4
0 4 0 4 0
4 a
b
c
d
e
f
0
0 10 20 30 40
Ba c te ri a (1 0 7 ce ll s m l -1 )
Time (days)
4 0 4 0
50 4
0 4 0 4 0
4 a
b
c
d
e
f
Fig. 7: Experimental results showing the population dynamics of the two bacteria Pedobacter (open circles) and Brevundimonas (filled circles) in chemostat systems at the different dilution rates D. (a): 0.2 d-1, (b): 0.45 d-1, (c):
0.5 d-1, (d): 0.75 d-1, (e): 0.9 d-1. Vertical bars represent standard deviation of triplicates taken separately form one chemostat. No sampling took place on day 24.
In conclusion, grazing and competition experiments revealed that the
experimental system allows the analysis of complex population dynamics as
described in the mathematical model. Grazing experiments showed that the
prey preference of Tetrahymena on Pedobacter was e = 4 when the prey
preference on Brevundimonas was set to µ = 1. The model predicted limit
cycles and coexistence at equilibrium for all three species for a dilution rate of 0.3 < D < 0.6 d
-1with e = 4 (Fig. 3). Extinction of one population was found for a dilution rate D smaller than 0.3 d
-1and for 0.6 < D < 0.8 d
-1. For a dilution rate greater than D = 0.8 d
-1extinction of the less preferred prey b
2and the predator p were recorded from the mathematical model. Dilution rates D >
0.1 d
-1and experimental intervals of 0.05 are realisable for experiments with microorganisms. The use of axenic cultures give the possibility of analyses without any dynamics from contaminations with other microorganisms, as are found in other systems used for studies of intrinsically driven population dynamics. We can assume different dynamic behaviours in the two-prey-one- predator system with Tetrahymena, Pedobacter, and Brevundimonas for dilution rate of 0.1 < D < 0.9 d
-1.
References:
Becks, L., Hilker, F.M., Malchow, H., Jürgens, K. & Arndt, H. Experimental demonstration of chaos in a microbial food web. Nature 435, 1226-1229 (2005).
Cadotte, M.W., Drake, J.A. & Fukami, T. Constructing nature: laboratory models as necessary tools for investigating complex ecological communities. Advances in Ecological Research 37, 335-353 (2005).
Chase, R.D., et al. The interactions between predation and competition: a review and synthesis. Ecol. Lett. 5, 302-315 (2002).
Christoffersen, K., Nybroe, O., Jürgens, K. & Hansen, M. Measurement of bacterivory by heterotrophic nanoflagellates using immunofluorescence labelling of ingested cells. Aquat. Microb. Ecol. 13, 127-134 (1997).
Eisenmann, H., Harms, H., Meckenstock, R., Meyer, E. I. & Zehnder, A. J. B.
Grazing of a Tetrahymena sp. on adhered bacteria in percolated columns monitored by in situ hybridization with fluorescent oligonucleotide probes.
Appl. Environ. Microbiol. 64, 1264-1269 (1998).
Fuji, K. Relationship of two-prey, one-predator species model: local and global stability. J. Theor. Biol. 69, 613-623 (1977).
Fussmann, G. F, Ellner, S. P., Shertzer, K.W. & Hairston, N.G. Jr. Crossing the Hopf bifurcation in a live predator-prey system. Science 290, 1358-1360 (2000).
Gause, G. F. Experimental analysis of Vito Volterra's mathematical theory of the struggle for existence. Science 79, 16-17 (1934).
Gilpin, M.E. Spiral chaos in a predator-prey model. Am. Nat. 113, 306-308 (1979).
Hairston, N.G., Smith, F.E., Slobodkin, L.B. Community structure, population control, and competition. Am. Nat. 94, 421-425 (1960).
HilleRisLambers, R. & Dieckmann, U. Competition and predation in simple food webs: intermediately strong trade-offs maximize coexistence. Proc. R. Soc.
Lond. B. 270, 2591-2598 (2003).
Jessup, C.M. et al. Big questions, small worlds: microbial model systems in ecology. Trends Ecol. Evol. 19, 189-197 (2004).
Kooi, B.W. & Boer, M.P. Chaotic behaviour of a predator-prey system in the chemostat. Dynamics of Continuous Discrete and Impulsive Systems Series B: Applications and Algorithms 10, 259-272 (2003).
Luckinbill, L.S.& Fenton, M.M. Regulation and environmental variability in experimental populations of protozoa. Ecology 59, 1271-1276 (1978).
May, R. M. Biological populations with nonoverlapping generations: stable points, stable cycles, and chaos. Science 186, 645-647 (1974).
Porter, K.G. & Feig, Y.S. The use of DAPI for identifying and counting aquatic microflora. Limnol. Oceangr. 25, 943-948 (1980).
Takeuchi, Y. & Adachi, N. Existence and bifurcation of stable equilibrium in two- prey, one predator communities. Bull. Math. Biol. 45, 877-900 (1983).
Turchin, P. (2003). Complex Population Dynamics: A Theoretical /Empirical Synthesis. Princton Univ. Pres, Princton.
Vance, R.R. Predation and resource partioning in one predator, two prey model communities. Am. Nat. 112, 797-813 (1978).
Vayenas, D.V. & Pavlou, S. Chaotic dynamics of a food web in a chemostat. Math.
Biosci. 162, 69-84 (1999).
Vayenas, D.V., Aggelis, G., Tsagou, V., Pavlou, S. Dynamics of a two-prey-one- predator system with predator switching regulated by a catabolic repression control-like mode. Ecol. Model. 186, 345-357 (2005).
Chapter II
Experimental demonstration of chaos
in a microbial food web
36
Experimental demonstration of chaos in a microbial food web
Lutz Becks1*, Frank M. Hilker2, Horst Malchow2, Klaus Ju¨rgens3,4& Hartmut Arndt1*
Discovering why natural population densities change over time and vary with location is a central goal of ecological and evolu- tional disciplines. The recognition that even simple ecological systems can undergo chaotic behaviour has made chaos a topic of considerable interest among theoretical ecologists1–4. However, there is still a lack of experimental evidence that chaotic behaviour occurs in the real world of coexisting populations in multi-species systems. Here we study the dynamics of a defined predator–prey system consisting of a bacterivorous ciliate and two bacterial prey species. The bacterial species preferred by the ciliate was the superior competitor. Experimental conditions were kept constant with continuous cultivation in a one-stage chemostat. We show that the dynamic behaviour of such a two-prey, one-predator system includes chaotic behaviour, as well as stable limit cycles and coexistence at equilibrium. Changes in the population dynamics were triggered by changes in the dilution rates of the chemostat. The observed dynamics were verified by estimating the corresponding Lyapunov exponents. Such a defined microbial food web offers a new possibility for the experimental study of deterministic chaos in real biological systems.
Apart from the intuitive understanding that external (extrinsic) stimuli influence the variability of abundances, mathematical models have made it apparent that the internal (intrinsic) qualities of a population give rise to population dynamics with large and (at certain parameter ranges) even chaotic fluctuations of abundances, even under wholly constant and predictable conditions5. Predator–
prey interactions have been considered as a possible driving force of population dynamics since the beginning of ecological studies6,7. In his analysis of mathematical models, May1found that even simple processes of population growth can show (for a certain range of parameters) an unpredictable behaviour driven by intrinsic mecha- nisms. May’s studies marked the beginning of an intensive debate on the question of whether or not natural systems are characterized by chaotic behaviour. In this context, the term ‘deterministic chaos’
can be defined as bounded aperiodic fluctuations with sensitive dependence on initial conditions4. Under chaotic conditions, popu- lation abundances never show a precisely repeated pattern over time;
such patterns are only observable in populations at equilibrium or at stable limit cycles. Theoreticians can clearly define parameter ranges of mathematical models that create chaotic behaviour in idealized biological systems3,8–10. However, only a very few experiments indicating that bifurcations of dynamic behaviour might occur in the real world have been conducted (for example, ciliate–bacteria interactions11, flour beetle (Tribolium castaneum) dynamics12,13 and rotifer–algae interactions14). Indications of chaotic dynamics under controlled conditions have so far been reported for one-species systems only13. A robust tool to verify observed dynamics is
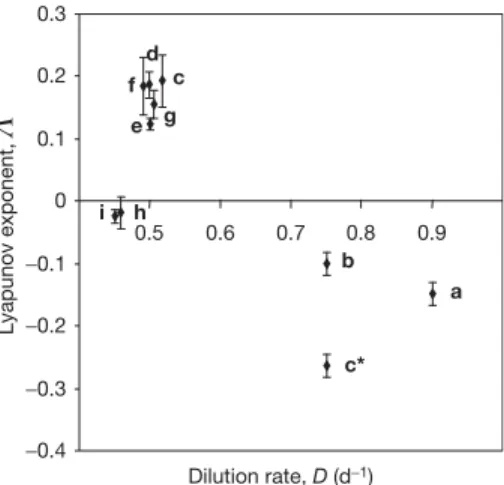
estimations of Lyapunov exponents from time series, which test for the exponential divergence of nearby trajectories. Mathematically, stable (convergent) systems show negative Lyapunov exponents, whereas chaotic (divergent) systems have at least one positive Lyapunov exponent4.
The aim of the present study was to verify the biological relevance of chaotic behaviour in a real multi-species system. The long generation durations of most organisms and the complexity of natural environments have generally made the explanation of under- lying ecological mechanisms difficult15. However, experiments using microbial populations propagated in controlled environments reduce ecosystem complexity to the point at which understanding simple processes in isolation becomes possible. The rapid reproduc- tion of bacteria and protists is one of the main advantages of working with microorganisms as model organisms7,16,17. In addition, the community structure can be exactly defined; for example, single strains of bacteria and protists can be selected. Microorganisms can also be cultured under chemostat conditions. This has the great advantage that extrinsic factors are negligible and changes in popu- lation dynamics can be attributed to intrinsic factors. In terms of predation and interspecific competition, one of the simplest systems imaginable is a three-species system with two prey organisms and one predator. Several theoretical studies have been made of such model systems8–10,18. Generally, different patterns of population dynamics are predicted by models; for example, the extinction of one or two species and the coexistence of all three species. Assuming that the two prey populations compete with each other and assuming that the better competitor is the preferred prey, three patterns may occur:
coexistence at equilibrium, coexistence at stable limit cycles, and coexistence at chaos8–10,18.
Our study was aimed at identifying these different patterns of coexistence in controlled experiments in a chemostat. We used the dilution rate as the bifurcation parameter in the experiments, because the dynamical behaviour of chemostat models can change with dilution rate9,10,14. We constructed one-stage chemostat systems consisting of axenic cultures of three species: a predator (the ciliate Tetrahymena pyriformis) and two coexisting prey bacteria, the rod- shaped Pedobacter and the coccus Brevundimonas. The effective consumption of these bacteria by the ciliate and its food preference was analysed by immunofluorescence techniques. The ciliate can establish stable populations when feeding on either bacterium, but it dies off in the highly diluted organic medium when bacteria are absent. The growth conditions for the bacteria and the mortality of the ciliate are determined by the dilution rates (controlled by peristaltic pumps). Brevundimonas was always outcompeted in chemostat experiments containing both bacterial strains without a predator. Thus,Pedobacterwas considered to have a better fitness. In
LETTERS
1Department of General Ecology and Limnology, Zoological Institute, University of Cologne, D-50923 Ko¨ln, Germany.2Department of Mathematics and Computer Science, Institute of Environmental Systems Research, University of Osnabru¨ck, D-49069 Osnabru¨ck, Germany.3Max Planck Institute for Limnology, PO Box 165, D-24302 Plo¨n, Germany.4Baltic Sea Research Institute, D-18119 Rostock-Warnemu¨nde, Germany.
*These authors contributed equally to this work.
Vol 435|30 June 2005|doi:10.1038/nature03627
contrast, our grazing experiments revealed thatPedobacter is pre- ferred as prey by the ciliate overBrevundimonasby a factor of four (see Supplementary Information). Experiments were performed with dilution rates of 0.90, 0.75, 0.50 and 0.45 d21. These dilution rates were selected on the basis of preceding model calculations.
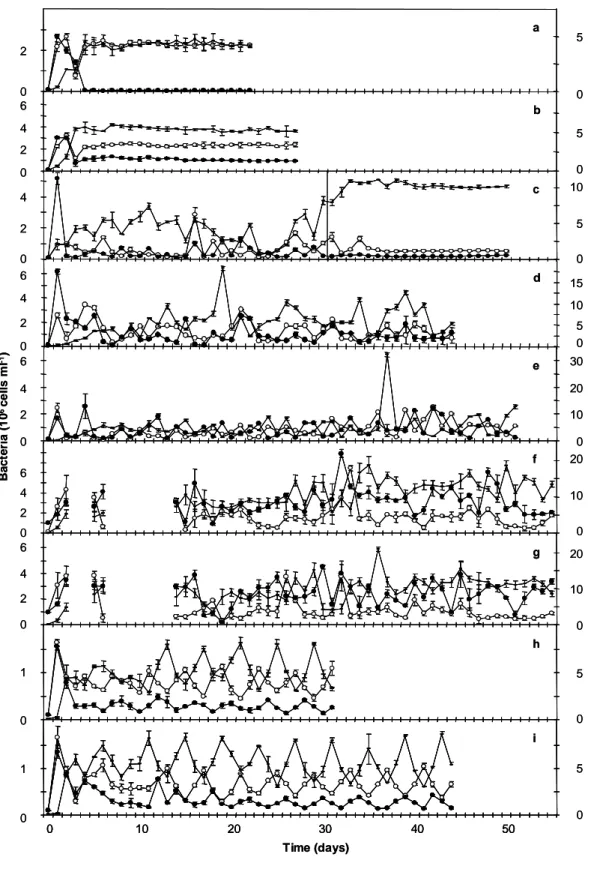
The results revealed a different dynamic behaviour of the experi- mental system, depending on the applied dilution rate (Fig. 1). At the highest dilution rate (D¼0.90 d21),Brevundimonashad died off by the sixth day; the remaining species existed in stable coexistence at equilibrium (Fig. 1a). The establishment of constant, equilibrium population densities of all species was achieved after about 5 days at D¼0.75 d21 (Fig. 1b). To check the robustness of the stable equilibrium, we repeated this experiment with a preceding 30-day period of aperiodic dynamics atD¼0.50 d21(Fig. 1c). Although similar dynamic behaviour was observed after a transition period of 5 days, the abundances reached by the three species were different from
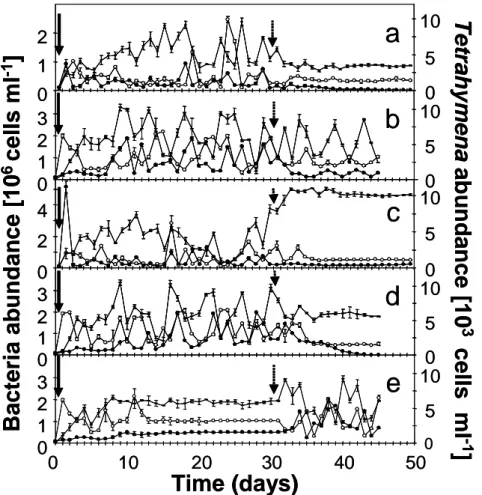
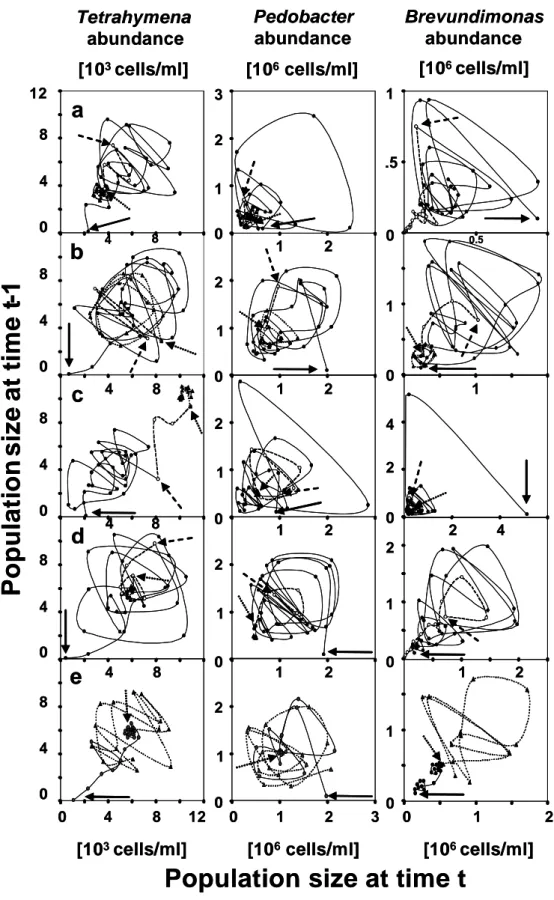
those of the previous experiment. One possible explanation for these differences in abundances of the rapidly reproducing microbes (30 days represents about 240 generations in the experiments) might be a potential evolutionary shift in population structure19. Obviously stable limit cycles were established in the two parallel chemostat systems after a period of about 8 days at a dilution rate of 0.45 d21 (Fig. 1h, i). Maxima and minima for all three species recurred during the whole observation period. Slight differences can be attributed to the sampling interval, which was kept constant at about 24 h. The cycles started with a maximum abundance of the preferred bacte- rium, followed by a peak of the less-preferred bacterium and the predator. Aperiodic oscillations were always obtained when dilution rates were set to 0.50 d21(Fig. 1d–g). All four trials showed different patterns in their dynamics. The observed aperiodic oscillations of the chemostat populations were analysed for possible chaotic behaviour by using estimates of corresponding Lyapunov exponents (Fig. 2; see Figure 1|Experimental results showing the population dynamics of
bacteria–ciliate chemostat systems. Dilution ratesDwere as follows:
a, 0.90 d21,b, 0.75 d21;c, 0.50 d21(the line indicates the change to 0.75 d21 at day 30);d–g, 0.50 d21(replicate experiments; no sampling took place on
days 3, 4 and 7–13 infandg);h,i, 0.45 d21(replicate experiments). Open circles,Pedobacter(preferred prey); filled circles,Brevundimonas(less- preferred prey); horizontal bar,Tetrahymena(predator). Vertical bars represent the s.d. of triplicate samples taken separately from one chemostat.
NATURE|Vol 435|30 June 2005 LETTERS