Revealing environmentally driven population dynamics of an Arctic diatom using a novel microsatellite PoolSeq barcoding approach
Klara K. E. Wolf ,1* Clara J. M. Hoppe ,1
Florian Leese ,2Martina Weiss ,2Björn Rost ,1,3 Stefan Neuhaus ,1Thilo Gross ,1,4,5
Nancy Kühne 1and Uwe John 1,5
1Alfred Wegener Institute, Helmholtz Centre for Polar and Marine Research, Bremerhaven, Germany.
2Faculty of Biology, Aquatic Ecosystem Research, University of Duisburg-Essen, Essen, Germany.
3University of Bremen, FB2, Bremen, Germany.
4University of Oldenburg, ICBM, Oldenburg, Germany.
5Helmholtz Institute for Functional Marine Biodiversity, Oldenburg, Germany.
Summary
Ecological stability under environmental change is determined by both interspecific and intraspecific processes. Particularly for planktonic microorgan- isms, it is challenging to follow intraspecific dynam- ics over space and time. We propose a new method, microsatellite PoolSeq barcoding (MPB), for tracing allele frequency changes in protist populations. We successfully applied this method to experimental community incubations andfield samples of the dia- tom Thalassiosira hyalina from the Arctic, a rapidly changing ecosystem. Validation of the method found compelling accuracy in comparison with established genotyping approaches within different diversity con- texts. In experimental and environmental samples, we show that MPB can detect meaningful patterns of population dynamics, resolving allelic stability and shifts within a key diatom species in response to experimental treatments as well as different bloom phases and years. Through our novel MPB approach, we produced a large dataset of populations at differ- ent time-points and locations with comparably little effort. Results like this can add insights into the roles of selection and plasticity in natural protist
populations under stable experimental but also vari- ablefield conditions. Especially for organisms where genotype sampling remains challenging, MPB holds great potential to efficiently resolve eco-evolutionary dynamics and to assess the mechanisms and limits of resilience to environmental stressors.
Introduction
Phytoplankton responses to ongoing and future environ- mental changes will significantly impact earth system pro- cesses at many levels. These primary producers are the photosynthetic base of marine food webs and responsi- ble for half of the global oxygen production (Field et al., 1998). In the Arctic, climate change is progressing at a much faster rate than the global average (Larsen et al., 2014), providing a natural laboratory to study organismal responses. Generally, phytoplankton are con- sidered relatively resistant to rapid environmental changes owing to their large census population sizes and short generation times (Lynch et al., 1991; Collins et al., 2014; Rengefors et al., 2017). However, even minor changes in competitive ability at the population level and species shifts within communities have the potential to impact higher trophic levels, biogeochemical cycling, and ecosystem functioning (Rost et al., 2008;
Hillebrand and Matthiessen, 2009; Boydet al., 2018).
Adjustments to environmental change can occur by physiological, ecological, and evolutionary mechanisms.
Organisms have the capacity to modify their phenotypes within certain intrinsic limits by a plastic response to sur- rounding conditions (West-Eberhard, 2003). The range of conditions in which an organism can dwell defines its plasticity. Furthermore, the genotypic composition of a population can be adjusted by selection forfitter individ- uals, which is referred to as strain or genotype sorting (Becks et al., 2010; Collins et al., 2014; Scheinin et al., 2015). Individuals with an adaptive advantage under changed environmental conditions can emerge by new mutations, by immigration from other locations, or are already present within the standing genetic stock of a population. Large effective population sizes host a Received 7 April, 2020; revised 1 February, 2021; accepted 2 Febru-
ary, 2021. *For correspondence. E-mail: klara.wolf@awi.de; Tel.
(+49) 471 4831-1450; Fax +49(471)4831-1149.
© 2021 The Authors.Environmental Microbiologypublished by Society for Applied Microbiology and John Wiley & Sons Ltd.
This is an open access article under the terms of the Creative Commons Attribution License, which permits use, distribution and –
greater genetic diversity and thus a larger potential to adjust more rapidly to occurring change. This is why large and highly diverse populations, as found in phyto- plankton, are considered to be particularly resistant to environmental variation and change through fast evolu- tionary adaptation by selection within a large standing stock of phenotypes (Yachi and Loreau, 1999; Bernhardt and Leslie, 2013).
The high intraspecific diversity of phytoplankton (Godhe and Rynearson, 2017) makes the dynamics and selective processes within populations also methodologi- cally difficult to resolve. Because classic sample sizes of isolated genotypes (up to a few hundred) are rarely suffi- cient to detect patterns within the usually huge genotypic diversity, few studies have found evidence for genotype sorting in marine environments (but see Scheinin et al., 2015; Ruggieroet al., 2017). A major challenge in population genetic studies is that individuals can only be distinguished via highly polymorphic loci and not via con- ventional ‘DNA barcoding’ gene markers. Furthermore, traditional approaches to resolve population composition, such as microsatellites, cannot be directly applied to diverse natural community samples. Instead, they must be performed separately for a number of tediously iso- lated strains. Researchers are therefore caught in a prac- tical tradeoff between a higher resolution per population (i.e. number of isolates) and a higher frequency of tempo- ral or spatial sampling. A recently established method is pooled sequencing (PoolSeq; Futschik and Schlötterer, 2010), which so far has only been applied to multicellular and larger eukaryotes. In this method, single nucleotide polymorphisms (SNPs) of populations are analysed using a shotgun or targeted approach by mixing strains, tissues, or DNA of conspecifics for sequencing.
Based on this technique, more targeted approaches for genotyping have also been developed (‘Genotyping-by- Sequencing’, e.g. Narumet al., 2013; Vartiaet al., 2016).
While PoolSeq allows the analysis of many individuals simultaneously and yields results at the level of nucleo- tide sequences instead of relying on length-polymor- phisms, it still requires samples that contain genotypes of only the target species (Ferretti et al. 2013), which is challenging to achieve in natural samples of planktonic protists.
Due to these methodological constraints, little is known about the complex population structures and dynamics of phytoplankton. Despite the usual absence of visible clonal dominance (but see Ruggieroet al., 2017), allele frequency data revealed that phytoplankton populations are often distinct, even in adjacent and frequently inter- mixing locations (Rynearson and Armbrust, 2004;
Medlin, 2007; Gaebler-Schwarzet al., 2015). While some studies suggest that subpopulations in the same place can coexist and replace each other throughout a season
(Rynearson et al., 2006; Saravanan and Godhe, 2010;
Erdneret al., 2011) or that population structure develops over time (Tammilehto et al., 2017), others have shown that populations can remain relatively stable across time- scales of decades or centuries (Härnströmet al., 2011).
From the available evidence, it appears increasingly likely that population structure is much more influenced by selection according to ambient conditions (i.e. local adaptation) than by genetic drift (Sjöqvist et al., 2015;
Godhe et al., 2016). This existing knowledge is mainly based on natural populations in which selection environ- ments are highly variable and sampling procedures are tedious, allowing only snapshots of their dynamic state without elucidating underlying processes.
In order tofind answers about the role of intraspecific shifts in diverse community experiments and natural envi- ronments, our study had the aim of developing and vali- dating a new ‘microsatellite PoolSeq barcoding’ (MPB) method. This method directly assesses intraspecific vari- ation at microsatellite loci for an entire phytoplankton population from bulk community samples without previ- ous strain isolation. We first compared the results of established methods based on fragment analysis with results of MPB, by applying both methods to simplified experimental populations as well as entire phytoplankton communities of the diatom Thalassiosira hyalina in manipulation experiments. In a next step, we tested MPB on a larger set of experimental and in situ samples of Arctic spring bloom phytoplankton over two consecutive years in order to assess whether the method can indeed help us to resolve intraspecific shifts infield populations at full diversity.
Materials and methods
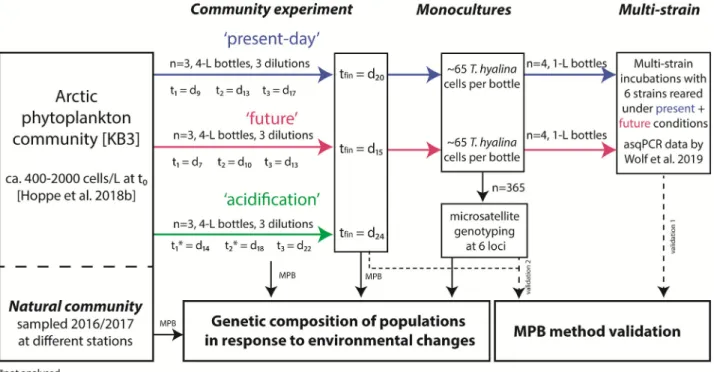
To develop the MPB method and to assess its resolution of allelic composition in comparison to conventional microsatellite analyses, four sets of samples were used (Fig. 1): (i) ‘community experiment’ samples of Arctic phytoplankton obtained by Hoppe et al. (2018b) from incubations under present day, future and acidification selection regimes (temperature and pCO2perturbations, see next paragraph for details); (ii) single-strain ‘mono- cultures’ (=single genotypes) obtained by Wolf et al. (2019) from the same experimental communities;
(iii)‘multi-strain’cultures consisting of six genotypes with a known composition, as assessed by allele-specific qPCR (Wolfet al., 2019). To test the application of MPB in further contexts at natural diversity, we analysed addi- tionally (iv)‘natural community’samples of Arctic diatom populations acquired in spring seasons 2016 and 2017 in an Arctic fjord.
© 2021 The Authors.Environmental Microbiologypublished by Society for Applied Microbiology and John Wiley & Sons Ltd.,
Community experiment samples
Details of the community incubation experiment using Arctic phytoplankton assemblages are described in the study by Hoppe et al. (2018b), where incubations are referred to as KFb_1 and KFb_2. In brief, the experiment was initiated in mid-April 2016 with a natural Arctic phyto- plankton spring community from the Kongsfjord (Svalbard, 7855’N, 1156’E) by gently pumping seawa- ter from a depth of 23–25 m into 4-L polycarbonate bot- tles. Bottles were incubated in triplicates in temperature- controlled chambers and aerated via continuous bubbling of air with the target partial pressures of CO2(pCO2) for each treatment: present-day (1.80.1C and 32412μatm pCO2), acidification (1.80.1C and 96650μatm pCO2) andfutureconditions (6.80.4C and 1078 16μatm pCO2). Cultures were exposed to continuous light at 50 2 μmol photons m−2s−1 under non-limiting nutrient concentrations. To avoid pH drift and to increase the effect of genotype sorting, three dilutions were performed at a ratio of 1:25. Depending on the growth rate of the respective community, the experiments ran for 16–22 days, equivalent to 27–31 generations according to bulk community growth rates of 1.3–1.7 divi- sions per day (k, estimated by nutrient drawdown, data not shown). Filter samples were collected during each dilution (t1–t3)and the final time-point of the community
experiment (tfin) for present day and future treatments.
For the acidification treatment, only filter samples from the last dilution (t3) and the final time-point (tfin) were analysed. All samples for MPB were mixed thoroughly and filtered (filtration volume 300–500 ml) on 10 μm PC filters (Whatman Nucleopore), which were stored at
−80C until further analysis.
Monocultures
At the final time-point of the community experiment, 55–65 single cells of the diatom T. hyalina (Grunow;
Gran, 1897) were isolated from each triplicate bottle of the present day and future treatments (yielding 365 strains in total). Cells were picked manually under a light microscope and washed three times in sterile sea- water. Single-cell isolation of each strain was repeated after 10–14 days of growth in 48-well plates at 6.8C and 50μmol photons m−2s−1in sterile nutrient-enriched sea- water. Each of the resulting strains was checked micro- scopically for contamination with other algal species before being grown as 250 ml monocultures at 3C and 5–10 μmol photons m−2 s−1. Samples were taken as described above and used for traditional microsatellite genotyping as well as for MPB validation (see valida- tion 2).
Fig. 1.Overview of the four data sets (bold and italic) generated in this study to validate the MPB method (dashed black arrows) and to assess changes in genetic composition ofT. hyalinapopulations in response to temperature and CO2treatments (solid black arrows). Samples from
‘Natural communities’and the‘Community experiment’confirmed the applicability of MPB within whole communities. Treatment conditions for the experimental incubations were:‘present-day’(blue): 2C 400μatm pCO2,‘future’(red): 7C 1000μatm pCO2,‘acidification’(green): 2C 1000μatm pCO2.
© 2021 The Authors.Environmental Microbiologypublished by Society for Applied Microbiology and John Wiley & Sons Ltd.,
Multi-strain samples
Wolfet al. (2019) performed a multi-strain experiment in 2017, based on six of the above described monocultures.
They chose three clones selected under thepresent-day and three under thefuturescenario and incubated them together under both conditions (n = 4 replicates each).
For the current study, samples were taken at two time- points (i.e. dilutions,t1 andt2) and at thefinal time-point (tfin). Strain composition was originally assessed using allele-specific qPCR by Wolf et al. (2019). These data were used for MPB validation on the same samples (see validation 1).
Natural community
Field samples of natural populations were obtained from 2016 and 2017 spring blooms in the Kongsfjord (Svalbard). These samples were collected regularly (every 2–6 days) at the mid-fjord station KB3 and occa- sionally at neighbouring stations in the fjord (KB2 and KB5, see Supporting Information S3 + S4). Sampling took place between 29 April and 16 May 2016 as well as between 18 April and 26 May, 2017. Thefiltration volume consisted of 1–2 l seawater, and samples were treated as described above.
Microsatellite genotyping of monocultures
The detailed methods are described in the Supporting information of Wolf et al. (2019). In brief, DNA was extracted using the NucleoSpin Plant II Kit (Macherey- Nagel GmbH, Duren, Germany). Six microsatellite primers (Supporting information S1) were applied to DNA samples in equimolar concentrations with fluorescent markers (FAM, HEX, and AT) as single or multiplex PCR, using the Type-it Microsatellite PCR Kit (Qiagen, Hilden, Germany) and a thermal cycler (Mastercycler Nexus Gra- dient; Eppendorf, Hamburg, Germany) under the follow- ing reaction conditions: 5 min at 94C, 30 cycles of 30 s at 94C, 90 s at 57C, and 40 s at 72C,final elongation step at 72C for 10 min. Fragment analysis was per- formed by capillary electrophoresis using the 3130xl Genetic Analyzer (Applied Biosystems, Foster City, CA, USA), and sizes were assigned relative to a GeneScan ROX standard (Thermo Fisher, Waltham, MA, USA).
Microsatellite alleles were scored using Genemapper (version 4; Applied Biosystems). From samples mea- sured repeatedly throughout all runs, an error rate in allele length assignment of 2% was calculated. Arlequin (version 3.5.2.2; Excoffier and Lischer, 2010) was used to calculate expected and observed heterozygosity (He
and Ho), to assess deviations from Hardy–Weinberg equilibrium within each experimental bottle, and to
determine population differentiation (FST) among pairs of bottles. Population structure was also tested by a Bayes- ian clustering analysis using STRUCTURE (version 2.3.4; Pritchard et al., 2000) without a population prior and STRUCTURE HARVESTER (version 0.6.94) (Earl and vonHoldt, 2012) in combination with CLUMPP (ver- sion 1.1.2) (Jakobsson and Rosenberg, 2007) to deter- mine the optimal number of clusters, following the Evanno method (Evannoet al., 2005). Linkage disequilib- rium (LD) was calculated using LIAN (Haubold and Hudson, 2000), and significance was assessed after sequential Bonferroni correction. The probability (psex) of encountering the same genotype twice in the same popu- lation (i.e. bottle) was estimated using the programme GenClone2 (Arnaud-Haond and Belkhir, 2007).
Microsatellite PoolSeq barcoding analysis
In order to provide an overview over the entire procedure, a workflow of the steps from laboratory to bioinformatic analysis is shown in Fig. 2. Two primer sets, ThKF3 and ThKF7, were selected for MPB based on their relatively high allelic richness and small fragment size in the prior fragment analysis of 365 monocultures (ThKF3:
180–270 bp, 24 alleles; ThKF7: 200–300, 14 alleles; Wolf et al. (2019)). In afirst PCR, triplicates of all MPB sam- ples (i.e. community experiment, multi-strain, and natural community samples) were run per locus using 10 ng of sample DNA (settings as described above). Triplicate PCR products were pooled and visualized on a 1.5%
agarose gel. Bands at the approximate size range of microsatellite sequences (150–300 and 150–350 bp for ThKF3 and ThKF7, respectively) were excised and puri- fied using the NucleoSpin Gel and PCR Clean-up Kit (Macherey-Nagel, Düren, Germany). In a second index PCR, dual indices and adapters were attached (Index PCR, Nextera XT Index Kit; Illumina, San Diego, CA, USA) and samples were purified using AMPure XP Beads (Beckman Coulter, Brea, CA, USA). Libraries were validated using the Agilent 2100 Bioanalyzer (Agilent Technologies, Santa Clara, CA, USA). Thefinal DNA libraries were pooled at equimolar ratios and sequenced using the MiSeq System with the v3 2×300 bp Paired-end Kit (Illumina).
Demultiplexing and FASTQ sequence generation were performed using the ‘Generate FASTQ’ workflow of MiSeq Reporter. About 11 million raw amplicons for primer set ThKF3 and about 12 million raw amplicons for primer set ThKF7 were obtained in all MPB samples.
Amplicon contingency tables were constructed for each primer set using an in-house but modified metabarcoding analysis pipeline (available upon request). Trimmomatic (version 0.38; Bolgeret al., 2014) was used to crop reads to a length of 275 bp and to truncate the pre-trimmed
© 2021 The Authors.Environmental Microbiologypublished by Society for Applied Microbiology and John Wiley & Sons Ltd.,
reads at the base position at which an averaged Q-score in a sliding-window of length 3 dropped below 8 (scanned from the 50-end to the 30-end). The paired-end reads were merged using VSEARCH (version 2.3.0; Rognes et al., 2016), allowing a maximum of five mismatched bases while requiring a minimum overlap length of 50 bp.
Sequences that could not be merged unambiguously were discarded. As most amplicons were expected to be shorter than the remaining read length, VSEARCH parameters were adjusted to allow the merging of stag- gered reads and the removal of possibly existing non- overlapping artificial amplicon segments outside the tar- get sequence. Target-flanking sequence segments with 100% forward and reverse primer matches were trun- cated from the amplicons using cutadapt (version 1.9;
Martin, 2011) and amplicons were only kept in the sequence pool if segments for both the forward and the reverse primers were found during truncation. The remaining sequences were further selected by applying a featurefilter (VSEARCH; version 2.3.0). Sequences were discarded if (i) they were longer than 320 bp or shorter than 120 bp; (ii) they carried any base ambiguity; or (iii) the expected number of miscalled bases per sequence (i.e. the sum of all base error probabilities = eemax) exceeded 0.1. Each sample was independently checked for chimeric sequences using VSEARCH (version 2.3.0) and the UCHIME (Edgar et al., 2011) algorithm in de-novo mode, and predicted chimeras (as identified within non-repetitive regions of the sequences) were removed from the samplefiles.
All sequences were pooled and amplicon contingency tables were created for both primer sets using a script adapted from https://github.com/torognes/swarm/wiki/
Working-with-several-samples (retrieved: December 2018). Alleles represented by only one amplicon (i.e. singletons) were excluded. For the primer-set ThKF3, about 6 million reads, and for the primer-set ThKF7, about 7.5 million reads passed allfiltering proce- dures. Strict quality filters and short amplicon lengths guaranteed the reliability of the sequence information.
Only one sample for the primer ThKF3 from the field bloom in 2016 (KB3_t12) did not pass the qualityfiltering (requiring >1000 sequences to remain after all sequence filtering steps) and was excluded. For the primer ThKF7, some samples did not yield sufficient PCR products and were excluded (all samples of the experimentalacidifica- tion incubation and eight field bloom samples, seven of them from 2017).
The amplicon tables for both primer sets were further processed using the R software (version 3.5.1). Sample libraries were normalized to the median of total read numbers in all samples. Allele frequencies were expressed as percentages of the total reads per sample, and different alleles with the same lengths were assigned unique names (e.g. 214.1 and 214.2). A difference in sequence but not in length is caused by single-nucleotide polymorphisms (SNPs), which can be present within the flanking as well as the repeat regions of microsatellites (Viruel et al., 2018). Alleles not containing at least two repeats of the target microsatellite sequence were dis- carded (‘sequence filter’), which resulted in only minor loss of reads (less than 1% for both loci). To exclude sequencing errors, alleles with frequencies <1% in the whole sample were set to 0 (‘allele abundance filter’).
This resulted in an average loss of 7.5% (ThKF7) to 10% (ThKF3) of all reads in samples for validation Fig. 2.Workflow of sample preparation and bioinformatic analysis for MPB.
© 2021 The Authors.Environmental Microbiologypublished by Society for Applied Microbiology and John Wiley & Sons Ltd.,
1 (multi-strain) and 18% (ThKF7) to 23% (ThKF3) of all reads in samples for validation 2 (diverse community experiment), but substantially reduced the error probabil- ity. All remaining amplicon sequences were checked for the expected microsatellite repeat structure and com- pared with those of the fragment analysis from the same experimental incubations in two validation steps.
Validation of MPB-derived allele frequencies
Within this study, MPB produced pooled allele frequency tables without knowledge about specimen number (no or only approximated cell counts for most samples exist) and identity of alleles, which is why most commonly eval- uated parameters in population genetics cannot be directly compared. However, the relative allele frequen- cies provide a straightforward measure for population dif- ferentiation. Allele frequencies obtained by the MPB method for both primers were validated using two sample types. In validation 1, the allele frequencies of multi-strain samples previously analysed by allele-specific qPCR (Wolf et al., 2019), and therefore containing a known composition of genotypes, were compared with those of the same multi-strain samples analysed by MPB. Since fragment analyses only yield information on allele length, all alleles in the MPB analysis that had the same number of base pairs (even those containing point mutations) were summed for this comparison. The allele frequencies (%) of each allele in all samples from the fragment analy- sis and the MPB analysis were compared by linear regression to obtain Pearson’sr and significance levels and by calculating the mean deviation (i.e. error) between analysis types for each allele length. For additional com- parison, principal component analyses (PCAs) of both datasets were performed and visualized in ordination plots. In validation 2, the same comparison based on allele lengths was performed for samples from the gen- otypedpresent-dayandfuturecommunity incubations. In this case, however, the allele frequencies of the fragment analysis contained only a limited subsample of genotypes from a highly diverse population, which introduces sto- chastic effects.
Data analysis of MPB datasets
Thefinal MPB results of both primer sets were evaluated using principal component analyses (PCA) in the soft- ware R for each set of population samples, using different allele versions (including point mutations) and their rela- tive frequency as variables. The results were visualized in ordination plots for the first two principal component axes. Additional PCAs were performed for the same sam- ples based on a merged dataset of alleles and their fre- quency of both loci (see Supporting Information
Fig. S5 + S6). Here, samples yielding amplicons for only one primer were omitted.
Pairwise comparison of samples was obtained by allele frequency differentiation (AFD) calculated following Berner (2019) after normalizing MPB allele frequencies to 100% for each sample. These AFD-values served as an alternative to pairwiseFSTvalues applicable for the data structure of MPB frequency tables. In parallel to FST, AFD values range from 0 to 1, with 0 describing identical samples.
Samples were clustered using Laplacian spectral clus- tering (Nadler et al. 2005), on the basis of similarities computed as the inverse of AFD values and unnormalized Laplacian matrices. Clusters were defined up to the largest normalized spectral gap, which was con- sidered valid above a value of 0.1, and is referred to in the text below. The greater the normalized spectral gap between clusters, the more clearly they are separated.
Additionally, the obtained clusters were statistically tested by permutational multivariate analysis of variance (PERMANOVA) analysis (R-package RVAideMemoire, v0.9-5) on the basis of the allele frequency tables.
Population genetic simulation of community experiment data without selection
To generate a null model of allele frequency changes over time under the community experiment settings assuming genetic drift without selection, genetic data were simulated using Nemo 2.3 (Guillaume and Rougemont, 2006). Simulation settings, including allele numbers, initial frequencies, fecundity, bottlenecks, and final sampling dates, were chosen to best match the real experimental settings (see Supporting Information S8 for details). After the simulation, allele frequencies were cal- culated for each population and a PCA similar to that described above was performed. To evaluate whether the PCA results from the experiments differ significantly from the simulated data and thus whether genetic drift could be the sole driver of differentiation, a Mann– Whitney U-test was used to compare PC1 values between treatment groups (present day, acidification, andfuture) of simulated values and experimental data.
Results and discussion Validation of the MPB method
Since the use of microsatellite markers in pooled ana- lyses of complex environmental samples is a novel approach, we tested the reliability of MPB in samples with different degrees of diversity. Thefirst validation step (validation 1) using samples from artificial populations consisting of six strains of T. hyalina (multi-strain)
© 2021 The Authors.Environmental Microbiologypublished by Society for Applied Microbiology and John Wiley & Sons Ltd.,
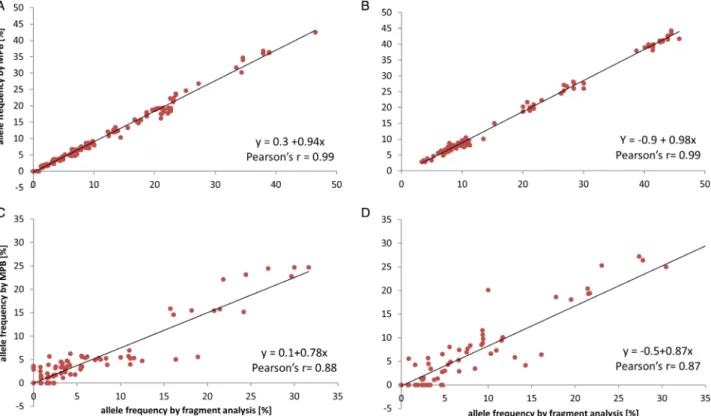
supported the reliability of the method (Fig. 3A + B, Table 1(a)): The same alleles were found and the correla- tion between allele frequencies from MPB, and allele- specific qPCR (asqPCR) was very compelling and strongly significant for both microsatellite loci in samples from the multi-strain experiment (Fig. 3A + B; Pearson’s r> 0.99;p< 0.001). This demonstrates that allele identifi- cation and quantification were highly accurate. The mean allele frequency error was 0.95 0.8% for alleles of ThKF3 and 1.30.4% for ThKF7. The error size did not depend on allele length (see Table 1(a)). Furthermore, when visualized in a PCA, the same samples of multi- strain samples measured by asqPCR and MPB were congruent with each other and with the temporal develop- ment previously observed (Fig. 4). For both methods, the final composition of populations showed significant differ- ences in line with the two treatments (PERMANOVA for both loci by MPB p = 0.001, by asqPCR p = 0.03) and the temporal population development described in the study by Wolf et al. (2019). We therefore conclude that MPB is a promising approach for the semi-quantitative and qualitative evaluation of allele frequencies in a low- diversity setup, comparable to allele-specific qPCR
(Meyeret al., 2006; Johnet al., 2015; Minteret al., 2015;
Wolfet al., 2019).
In the second validation step (validation 2), the MPB results for the community experiment were compared with allele frequencies obtained with the same two primers by classical genotyping of monocultures from single-cell isolates of the same populations (tfin; see Fig. 1). This set of samples contained a much higher inter- and intra-specific diversity, which comprises a higher number of possible error sources for the PCR and sequencing procedure. These potential errors might include masking effects by environmental DNA frag- ments, unknown primer sites in the environmental DNA, but also potential stutter effects from the PCR, depending on the microsatellite itself, as well as a size bias during sequencing (lllumina sequencing having a bias towards smaller fragments). The potential impact of stuttering was resolved during the validation 2 procedure, since genotyping results free of stuttered reads were used for validation of MPB results. In this validation step, the MPB method showed a larger deviation from, but still a high degree of concordance in allele frequencies with the genotyping results (Fig. 3C and D: Pearson’s r = 0.87;
Fig. 3.Validation of relative allele frequencies for each allele as measured by fragment analysis (x-axis) and by MPB (y-axis) using the primers ThKF3 (A and C) and ThKF7 (B and D). Pearson’s correlation coefficient (r) was used to evaluate the linear regression (black line = bestfit). Vali- dation 1 for primers ThKF3 (A) and ThKF7 (B): allele frequencies as measured by MPB and allele-specific qPCR in 18 multi-strain samples from artificial populations with limited diversity (six strains ofT. hyalina). Table 1a shows the detected error for each allele separately. Validation 2 for primers ThKF3 (C) and ThKF7 (D): allele frequencies of each allele as measured by MPB and genotyping in six community samples of phyto- plankton assemblages including naturalT. hyalinapopulations at thefinal time-point of the community experiment. Genotype analyses were based on 55–65 strains per sample. The error therefore includes inaccuracies of MPB as well as the subsampling bias of the genotyping.
© 2021 The Authors.Environmental Microbiologypublished by Society for Applied Microbiology and John Wiley & Sons Ltd.,
p < 0.001 for both primers). The mean frequency error per allele was 1.61.1% for ThKF3 and 2.31.4% for ThKF7. The intensity of stutters per allele had been quan- tified during genotyping as 5%–25% in ThKF3 and close to none in ThKF7 (Wolf et al., 2019). As this was not reflected in the mean error of the two loci, stuttered reads may not have been the main source of error. It may,
however, partly explain the regression slope below 1 in validation 2, as smaller alleles may be slightly over- represented due to the inclusion of stutter artefacts.
Overall, we consider these discrepancies in validation 2 very small, given the potential technical PCR and sequencing errors of the MPB approach (see above), as well as subsampling biases for classical genotyping (analysis of only65 isolates out of >500 000 cells per bottle). When defined by allele length, the allelic richness was generally lower in MPB results compared to the frag- ment analyses of separate genotypes (Table 1(b)). These
‘lost’ alleles were very low in frequency (<5%) and did probably not appear in the MPB results because of the statistical effects of overrepresentation in the subsampled genotypes combined with the strict abundance filters applied to MPB amplicon tables (allele frequencies below 1% were omitted). Because of their low frequencies, this discrepancy did not have a large effect on overall results as described by the low error rates.
A clear advantage of MPB over classical fragment analysis-based methods is the resolution of otherwise cryptic point mutations, i.e., alleles that are identical by size but not in base-pair sequence (Estoupet al., 2002).
Sequence variants of the same size in microsatellites and their flanking regions can have important implications for the type of mutation models used (Kosman and Jokela, 2019) and can lead to misinterpretation of tradi- tional population data based only on length evaluation, as has been shown in several publications and various organ- isms (Germain-Aubreyet al., 2016; Vartiaet al., 2016). A large number of such homoplastic alleles were also detected in our samples (e.g. several alleles of 214 bp;
see arrows in Figs. 5 and 6). It needs to be noted, how- ever, that homoplastic alleles could not be validated in the same way as length-variant alleles, since variants of the same length are not resolved in traditional fragment analy- sis. This being said, 48% (ThKF3) and 62% (ThKF7) of the allelic diversity detected by MPB consisted of such homoplastic alleles (Table 1(b)). Although stuttering may slightly inflate this percentage, such values are in line with estimates of homoplasy in other plant species analysed by established methods (Šarhanová et al., 2018; Viruel et al., 2018). This additional diversity can have consider- able implications, as illustrated, for example, in the field populations of 2017. Including homoplastic alleles, locus ThKF7 had a much larger allelic richness in 2017 than in populations of the previous year (Table 1(b)), and a much higher number of different alleles than would be estimated by analyses based on allele length only. As discussed below, this also allowed a differentiation among samples of 2017, which was not resolved with the other primer-set (ThKF3). When the datasets of both loci were combined and analysed together; however, a large fraction of the dif- ferentiation between samples from 2016 was lost (see Table 1.(a) Mean error in the relative frequency as well as mean rel-
ative abundance of each allele (defined by length) per sample at ThKF3 and ThKF7 using MPB, as estimated in validation 1 with multi-strain samples of known composition (asqPCR). (b) Allelic rich- ness of alleles for primers ThKF3 and ThKF7 for each subgroup of data as estimated by MPB analysis.
(a) Mean error (%) Mean allele abundance (%) ThKF3
205 0.29 1.05
208 2.65 12.73
211 0.54 4.02
214 1.38 30.85
217 0.12 1.70
220 1.26 9.07
223 0.89 12.79
226 1.79 17.40
229 0.32 5.42
232 0.35 0.88
235 0.91 4.07
ThKF7
233 1.89 10.37
239 1.71 42.37
245 0.91 9.37
251 1.32 24.08
257 0.9 8.11
269 1.03 5.69
(b)
# total alleles
# unique length
# homoplastic
% homoplastic ThKF3
Exp16 24 13 11 46
Exp16 fragm
24 24 - -
Bloom 16 27 14 13 48
Bloom 17 23 12 11 48
Bloom 16 + 17
26 13 13 50
Total 27 14 13 48
ThKF7
Exp16 20 11 9 45
Exp16 fragm
14 14 - -
Bloom 16 28 16 12 43
Bloom 17 42 18 24 57
Bloom 16 + 17
45 18 27 60
Total 47 18 29 62
#total alleles: total number of detected alleles; #unique alleles: num- ber of alleles of differing length; #homoplastic: the number of homo- plastic alleles (same length, different sequence), % homoplastic:
percentage of homoplastic alleles with the total number. Subgroups:
Exp16 = community incubation 2016; Exp16 fragm = alleles identi- fied by fragment analysis; Bloom = natural spring community samples.
© 2021 The Authors.Environmental Microbiologypublished by Society for Applied Microbiology and John Wiley & Sons Ltd.,
Supporting Information S6). This could be attributed to the fact that the most abundant (but largely undifferentiated) alleles of locus ThKF7 partly mask the resolution provided by ThKF3 for the samples from 2016. Thus, unlike in
traditional microsatellite genotyping, the information from several loci cannot be necessarily merged in MPB and is better evaluated separately before being discussed in concert.
Fig. 4.PCA of allele frequencies in multi-strain experiment samples in validation 1 as measured by MPB and allele-specific qPCR (asqPCA) of microsatellite loci ThKF3 (A) and ThKF7 (B). Samples of thefinal sampling time-point of all four replicate bottles (A–D) of the present-day treat- ment (‘P’) are in shown in blue tones, those of the future treatment (‘F’) in red tones. The method by which the result was obtained is marked by the suffix of each label (0 = asqPCR; 1 or 2 = MPB). For bottles A in both treatments, the time-points t1 and t2 are shown as well. The present- day replicate bottle D appears as an outlier because it was initiated with onlyfive instead of six genotypes. Final population composition was sig- nificantly different (PERMANOVA) between the two treatments when measured at both loci with asqPCR (p= 0.03) and MPB (p= 0.001).
Fig. 5.PCA of relative allele frequency data forT. hyalinaobtained from the community experiment and analysed by MPB using the primer ThKF3 (A) and ThKF7 (B). Three replicate incubations exposed to the present-day (P: 2C and 400μatm pCO2; blue) and future treatments (F:
7C and 1000μatm pCO2; red) were sampled at four time-points (t1, t2, t3 (light colour) and tfin (dark colour)). The three replicate incubations for the acidification treatment (A: 2C and 1000μatm pCO2; green) were analysed only at time-pointst3 andtfin and did not produce results with primer-set ThKF7. Black numbers identify alleles (by their lengths), which were used as variables for PCA. Only the 20 most abundant alleles are identified here. Different allele versions of the same lengths (homoplasy) have unique names (e.g. 214 and 214a). Ellipses mark sample clusters as identified by spectral clustering.
© 2021 The Authors.Environmental Microbiologypublished by Society for Applied Microbiology and John Wiley & Sons Ltd.,
The congruence of results obtained by the two methods and the accurate technical validation with multi- strain and diverse samples demonstrate that MPB is a versatile method. When compared to established popula- tion genetic methods, it cannot provide individual geno- type characteristics (especially heterozygosity) but is capable of correctly estimating allele frequencies and thus differences in populations. Next to traditional genotyping, allele frequencies assessed by MPB proba- bly deviate most because of two aspects: they contain a larger error concerning absolute allele numbers and fre- quencies due to the inclusion of stuttered reads, but they contain less error in the relative allele frequencies since subsampling bias of samples is much smaller. It is there- fore more meaningful to interpret MPB results relative to each other than in absolute terms. Since MPB is based on the entire range of genotypes present in a naturally diverse sample and takes homoplastic alleles into account, it potentially provides a higher resolution than fragment analysis of tediously isolated subsamples.
Application of MPB to diverse environmental samples We applied MPB to resolve intraspecific patterns in T. hyalinapopulations in natural, highly diverse communi- ties to an extent that would not have been feasible using traditional methodology. The pooled microsatellite
analysis by MPB allows relative intercomparisons of a high number of populations without genotyping individual isolates. By removing the bias of subsampling from large and highly diverse populations and by adding temporal resolution to the measured allele frequencies, we gained valuable information about selection in Arctic diatom populations in the laboratory and under natural field conditions.
Experimental community incubations. Investigations of single strains ofT. hyalinaisolated from community incu- bations as well as a simplified multi-strain experiment revealed large intraspecific phenotypic differences and that strong selection among diatom genotypes can take place on very short timescales (Wolf et al., 2019).
Resolving such dynamics in populations with high or nat- ural diversity, however, remains challenging. We here show that MBP is an innovative approach tofill this gap.
In our dataset of natural communities exposed to either present dayorfutureconditions (i.e. warming plus ocean acidification), both classical microsatellite genotyping of single isolates and the novel MPB approach suggested no directional changes or apparent differences between populations (Fig. 5A + B, Supporting Information S7).
MPB-based analysis of a third treatment (i.e.acidification without warming), which was not genotyped due to logis- tical and resource limitations, allowed us to reveal that a Fig. 6.PCA of relative allele frequency data forT. hyalinaobtained by MPB using the primer ThKF3 (A) and ThKF7 (B) on natural community samples from the Kongsfjord in spring 2016 (blue) and 2017 (orange). Samples for 2016 were taken at 10 m or 25 m (denoted as 0.10 and 0.25) between 29 April and 16 May 2016; samples for 2017 were all obtained at 25 m between 18 April and 26 May 2017. The sampling stations throughout the Kongsfjord are marked by colour variation [KB3 (dark blue/orange); KB2 and KB5 (light blue/orange)]. The exact date and location for eachfield sample are provided in the Supporting Information S3. Black numbers identify alleles (by their lengths), which were used as vari- ables for PCA. Only the 20 most abundant alleles are identified here. Different allele versions of the same lengths (homoplasy) have unique names (e.g. 214 and 214a). Ellipses mark sample clusters as identified by spectral clustering.
© 2021 The Authors.Environmental Microbiologypublished by Society for Applied Microbiology and John Wiley & Sons Ltd.,
directional allelic shift had taken place under those conditions.
For genotyping, a total of 365 strains were isolated from six incubation bottles of the final time-point under present and future conditions (tfin; Fig. 1; Table 2).
Among all analysed single strains using six microsatellite loci, only seven multi-locus genotypes were found twice, indicating an overall genotypic diversity of 96%, which is in line with most studies based on single cell isolation (Godhe and Rynearson, 2017). Within each bottle from the community experiment, genotypic diversity varied between 90% and 100%. Among the few identical geno- types, all but one pair originated from the same replicate bottle, potentially indicating weak selective processes.
This was supported by the low probability of encountering the same genotype twice within a bottle (psex< 0.001 in all cases, analysed via GenClone2). Still, in view of the maintained diversity, strong clonal dominance within the bottles is unlikely. FST values for pairs of populations were generally low (Table 2), and no population subdivi- sion was detected by a Bayesian clustering analysis (best cluster estimate judging from Δ(K) was K = 2, within which samples from all subpopulations/bottles were evenly distributed, see Supporting Information S7), suggesting no substantial differentiation between populations in these two treatments at the final time- point.
Absolute AFD-values based on genotyping data were generally higher (i.e. less similar) than those based on MPB data (Supporting Information Table S2). This makes sense in view of distorting effects caused by subsampling of a small number of analysed genotypes (60 per bottle) compared to several thousand genotypes potentially included in each MPB sample: If two incidents of a rare allele are found during genotyping, it will be assumed to represent 1:60 of the population (i.e. 1.6%), while two incidents out of 50.000 MPB amplicons will only amount to 1:50.000 (i.e. 0.002%) and populations will still appear more similar. This assumption was supported by a simu- lation of 60 subsamples per population based on MPB data, which then yielded similar absolute values as the genotyping (data not shown).
The MPB method was successfully applied to the same experimental communities for two loci (ThKF3 and 7). For the present day and the future treatment, both primer pairs alone as well as combined yielded a similar outcome as the genotyping, yielding no obvious pattern (Fig. 5 and Supporting Information S5). Cluster analysis (normalized spectral gaps below 0.1) and PERMANOVA analysis (ThKF3 p= 0.51, ThKF7p = 0.27) detected no differentiation or cluster formation in the allelic composi- tion of T. hyalina populations in accordance with these two treatments, neither over time nor betweenfinal time- points for the different incubations (t1-tfin; Fig. 5). In Table2.Summarystatisticsformicrosatellitegenotypingusingsixmicrosatellitemarkersforsixincubationbottlesinthecommunityincubationexperiment.Detailedmicrosatellitecharacteristics areprovidedintheSupportingInformationTableS1. Run time (days)#approx. generations# genotyped
# uniqueMLG HOHE(%diversity)FSTandLDPresent dayAPresent dayBPresent dayCFuture AFuture BFuture C PresentdayA20276464(100%)0.6420.667Presentday ANA----* PresentdayB20276563(96.9%)0.6230.669Presentday B0.00193NA---- PresentdayC20276357(90.5%)0.6330.653Presentday C−0.001880.00131NA--- FutureA15315553(96.4%)0.6450.682FutureA0.00373−0.000770.00259NA-- FutureB15315856(96.6%)0.6010.633FutureB0.002210.00192−0.000030.00578NA- FutureC15316060(100%)0.6630.681FutureC0.00677*0.002550.001890.002050.00129NA Presentday strains2027192184(95.8%)0.6320.663 Futurestrains1531173169(97.6%)0.6360.665 Total365351(96.2%)0.6340.664 Foreachbottlearegiven:runtimeoftheincubationexperiment,approximatenumberofgenerationsascalculatedfromassemblagegrowthrate,numberofgenotypedindividuals,numberofmultilocus genotypes(MLG)andgenotypicdiversityin%,observed(H0)andexpected(HE)heterozygosity.Sumoraveragevaluesaremarkedinbold.TherightpartofthetableshowspairwiseFSTvalues (lowerdiagonal)andsignificantlinkagedisequilibrium(LD;upperdiagonal)atasignificancelevel(*p<0.05).NoneofthedifferencesinheterozygositynorLDwithinbottlesweresignificant.
© 2021 The Authors.Environmental Microbiologypublished by Society for Applied Microbiology and John Wiley & Sons Ltd.,
parallel toFSTvalues, the AFD values were similarly low between all bottles (tfin) in the present day and future treatment, regardless whether calculations were based on data including (Supporting Information Table S2) or excluding homoplastic alleles (data not shown), which suggests very low differentiation between those populations.
Within a well-controlled and non-variable environment in the laboratory, selection would be expected to be direc- tional (Morrissey and Hadfield, 2012). The observed allelic stability could be indicative of two ecological scenarios:
First, the treatment conditions may not have exceeded the phenotypic plasticity of most genotypes, and the selection pressures were thus insufficient to induce population shifts. This is consistent with the high plasticity observed before inT. hyalinaand other key species of this ecosys- tem (Pancˇic et al., 2015; Hoppe et al., 2018a; Wolf et al., 2018), as well as with stable productivity and spe- cies composition in the same community incubation (Hoppeet al., 2018b). Alternatively, either the characteris- tics under selection or the microsatellite alleles may be widely and evenly distributed throughout the population, and the selected genetic variants may therefore not be associated with a single genomic background (‘soft sweep’, Weigand and Leese, 2018). In this case, intraspe- cific selection would remain undetected on the basis of a neutral marker, such as the applied microsatellites, but can nevertheless provide clues on the evolution of the investigated populations (such as frequency of recombina- tion or exchange with other populations).
Since bulkfield sampling for MPB is very simple com- pared to genotyping individual isolates, we used the opportunity to apply our barcoding approach also to a third experimental treatment. This additional dataset rev- ealed that there are limits to the described population sta- bility under certain conditions. All samples in the acidification treatment (1000μatm pCO2 and 1.8C) formed a distinct cluster separate from all other commu- nity samples in the PCA (Fig. 5A, normalized spectral gap: 0.15, PERMANOVA:p= 0.003) and total population size decreased (Supporting Information Fig. S9). Accord- ingly, AFD values between bottles of this treatment and the other two were significantly higher (Supporting Infor- mation Table S2; t test: t(11) = −9.03, p≤0.001), i.e. populations were more different. Here, the plasticity of T. hyalina populations was apparently insufficient to sustain their competitive ability. Thisfinding is in line with the frequently observed pattern that negative effects of ocean acidification manifest already at lower pCO2levels when combined with low temperatures (Settet al., 2014;
Hoppe et al., 2018a; Wolf et al., 2018). Although a decrease in population size adds stochasticity to the MPB results, it is still likely that the remaining individuals at the final time-point were a subset of genotypes with high fitness under the applied conditions. Directional
selection underlying this strain sorting is furthermore supported by the results of the genetic simulation based on metadata from the experiments assuming no selection (Supporting Information S8): In contrast to our experi- mental results, the different treatments and replicates in the simulation were randomly distributed, which makes it unlikely that the observed allelic shift was caused by coincidence or genetic drift. Thus, the application of our novel method allowed us to reveal potential climate change driven changes in the population structure of a marine diatom under some but not all experimental sce- narios, and without tedious isolation of individuals from all treatments.
Natural populations in in situ spring bloom communities.
The application of MPB infield samples could drastically increase our understanding of in situpopulation dynam- ics, which thus far remain largely under-sampled. We here show that the method can also be applied to field samples containing the full diversity of marine spring bloom protist communities. The analysis of samples col- lected throughout spring blooms in 2016 and 2017 from a Svalbard fjord resolved meaningful population differentia- tion with regard to environmental factors for a sample number almost impossible to investigate by traditional genotyping. Here, each of the two primer pairs yielded different pieces of information about the two bloom seasons.
A PCA of the results of ThKF3 revealed clear differenti- ation in allele frequency distributions between the spring blooms of 2016 and 2017, but only few allelic shifts within the peak of one bloom season (Fig. 6A). Cluster analysis grouped the majority of samples of the same year together (normalized spectral gap: 0.15), which was con- firmed by permanova analysis (p= 0.003). A few excep- tions exist in 2016, where the early as well as the latest samples deviate from the main cluster. Interestingly, the late samples lie within the 2017 cluster (t9 andt11) and were obtained during the end-phase of the diatom domi- nated bloom (mid-May), when nutrient concentrations declined (Z.T. Smoła, J.M. Wiktor, C.M. Hoppe, F. Cottier, M. Greenacre, I. Salter, et al., in preparation).
Samples of 2017 appeared very homogenous when analysed through primer ThKF3 and formed a single clus- ter. Analysis with primer ThKF7 (Fig. 6B) showed only one cluster of samples before and during the bloom peaks of both years [which occurred in early of May (t5), see C.J.M. Hoppe, K.K.E. Wolf, F. Cottier, E. Leu, and B. Rost (submitted to Global Biogeochem Cycles)].
Samples from the late bloom phase of 2017, however, when nitrate concentrations declined and conditions became less favourable for early bloom forming diatoms like T. hyalina, clearly diverged from this main cluster, spreading out into different directions in the PCA
© 2021 The Authors.Environmental Microbiologypublished by Society for Applied Microbiology and John Wiley & Sons Ltd.,
(normalized spectral gap between main cluster and out- liers: 0.32). This could be a distortion of MPB results due to much smaller T. hyalinapopulations or may suggest that the method detected non-directional genetic drift dur- ing thefinal phase of the bloom.
It is certainly possible that genetic marker resolution of both loci may have been too low to detect more subtle shifts within the peak phase of the blooms. However, population differentiation between early and late bloom phases and (especially with primer ThKF3) also between years (Fig. 6A), were clearly detectable. This dataset illustrates how the application of MPB in environmental contexts, for example, though the feasibility of high tem- poral resolution, can resolve intraspecific shifts in response to complex environments, even without previ- ous knowledge of when and where exactly they will occur.
MPB as a tool for population genetics
While MPB opens new avenues for increased sampling capacities and resolution, especially in planktonic organ- isms, it does have some limitations compared to tradi- tional methodology: In parallel to PoolSeq approaches, the analysis is based on the entire pool of present alleles of the target loci, but in contrast to PoolSeq, this pool contains not an artificial collection of individuals but an entire natural community sample. Although this removes the bias of subsampling only a small, potentially unre- presentative fraction of individuals, alleles cannot be attributed to specific genotypes. Therefore, information on haplotypes and thus some commonly used population genetic measures cannot be retrieved (e.g. estimates of genotypic diversity, linkage of loci and heterozygosity levels). Furthermore, PCR and sequencing biases are possible and some erroneous sequences may be included, depending on the susceptibility of the locus to PCR stutter at hand and the frequency distribution of alleles (stutters of low-frequency alleles will be removed by the frequencyfilter). These potential errors need to be considered and contained during analysis (see below).
Using sequencing instead of fragment analyses allows the analysis of alleles based on their genetic code instead of their length, which is increasingly recognized as being crucial for a realistic assessment of genetic diversity (e.g. Estoup et al., 2002; Germain-Aubrey et al., 2016). At the same time, the potential influence of sequencing errors needs to be considered (especially for homoplastic alleles). In this study, these were minimized by choosing relatively short target sequences and by applying strict quality control filters. These strict filters include discarding sequences with any primer mis- matches, large merging overlap, very low maximum expected error threshold (eemax), and very importantly,
removal of low frequency amplicons, which are most likely to contain errors. Microsatellite loci for MPB are best chosen to be as short as possible in order to decrease PCR bias and error probabilities during sequencing as well as allowing improved quality control during reverse complementation by a large overlap. They should also contain a high signal-to-noise ratio with small stutter susceptibility, which is more likely in longer repeat patterns (minimum 3nrepeats).
Our data illustrate that the current knowledge about populations remains a patchwork picture of the methodo- logical perspectives and even the specific loci at hand:
the results of both primer pairs (ThKF3 and ThKF7) pro- vide consistent yet distinct aspects of information about the investigated field samples. Since analysis is based on a multidimensional approach, the information of one locus can mask the other, which is why data of several loci should not necessarily be merged butfirst examined separately. The analysis and interpretation of high diver- sity datasets can thus not just follow a ready-made proto- col but needs to be adjusted and evaluated on an individual basis.
Finally, as for all methods based on neutral marker genes of non-model species, we cannot know where our target region is located in relation to genes under selec- tion or how evenly its alleles are distributed throughout the population. In many ways, these advantages and dis- advantages are similar to those discussed for well- established pool-sequencing approaches (Futschik and Schlötterer, 2010; Schlötterer et al., 2014; Vartia et al., 2016).
Conclusions
Our results show that MPB provides a simple protocol for pooled analysis of relative microsatellite allele frequen- cies at high accuracy in simplified laboratory populations as well as in experimental and environmental samples of natural diversity. The four most prominent benefits of MPB are (i) resource efficiency, (ii) easy applicability to bulkfield samples, which in turn (iii) avoids subsampling bias, and (iv) the potential to resolve homoplasy. These benefits allow for the analysis of population dynamics and selection processes within natural populations of non-model species at high temporal resolution, which, until now, represents a major challenge in ecology and evolution research (Weigand and Leese, 2018). While MPB provides limited information on absolute character- istics of single populations as a snapshot, it provides the possibility to compare many populations from different environments and follow their development even over longer periods of time at high resolution, e.g. within experimental setups, seasonal or interannual variations or expected incidents. Its advantages are therefore
© 2021 The Authors.Environmental Microbiologypublished by Society for Applied Microbiology and John Wiley & Sons Ltd.,