Functional analysis of CD74-NRG1 -
a new recurrent oncogenic gene fusion in lung adenocarcinoma
Inaugural-Dissertation zur
Erlangung des Doktorgrades
der Mathematisch-Naturwissenschaftlichen Fakultät
der Universität zu Köln vorgelegt von
Dennis Plenker
aus Bonn
Köln, 2015
Berichterstatter (Gutachter):
1. Gutachter: Prof. Dr. rer. nat. Thomas Langer 2. Gutachter: Prof. Dr. med. Jürgen Wolf
Tag der mündlichen Prüfung: 19.01.2015
The results of this dissertation are included in part in:
Fernandez-Cuesta, L., Plenker, D., Osada, H., Sun, R., Menon, R., Leenders, F., et al. (2014). CD74-NRG1 Fusions in Lung Adenocarcinoma. Cancer Discovery, 4(4), 415–422. doi:10.1158/2159-8290.CD-13-0633
Zusammenfassung
Das Lungen-Adenokarzinom ist mit einer Inzidenz von ca. 50% das häufigste Lungenkarzinom. In 25-50% der Fälle kann kein Onkogen als transfomierende Ursache in den Tumorproben detektiert werden, welche die Entstehung eines Tumors erklären kann (Cancer Genome Atlas Research Network, 2014; Pao & Hutchinson, 2012). Im letzten Jahrzehnt konnten neue Onkogene durch die Entdeckung von Fusionsgenen beschrieben werden (Rikova et al., 2007; Soda et al., 2007; Takeuchi et al., 2012). Das Ziel dieser Studie war die Identifizierung und Beschreibung neuer onkogener Fusionsgene mittels der Methode der Transkriptomsequenzierung. Die Grundlage hierfür bildeten 25 Patientenproben von Lungen- Adenokarzinomen, die negativ für EGFR und KRAS Mutationen waren, da diese bereits ca. 1/3 aller Mutationen beim Lungen-Adenokarzinom ausmachen (Pao & Hutchinson, 2012). Es zeigte sich, dass in 14/25 Tumorproben keine onkogenen Mutationen und in 10/25 Tumorproben nur bereits bekannte onkogene Veränderungen identifiziert werden konnten. Aber in einer Tumorprobe konnte eine bisher unbekannte Genfusion beschrieben werden - CD74-NRG1. Die Untersuchung einer erweiterten Onkogen- unbekannten Kohorte von 102 Lungen-Adenokarzinomen zeigte 4 weitere CD74-NRG1-positive Tumore. Alle wurden als invasiv muzinöses Adenokarzinom (Stadium I) diagnostiziert (4/15 invasiv muzinösen Adenokarzinonem innerhalb der Kohorte von Lungen-Adenokarzinomen).
CD74-NRG1 ist die erste identifizierte Genfusion, bei der ein Wachstumsfaktor mit einer potentiellen Ligandwirkung (NRG1) und einem anderen Gen (CD74) fusioniert. Alle bisherig beschriebenen onkogenen Genfusionen besitzen eine Kinase-Domäne, durch die die transformierende Wirkung ausgeübt wird. Der Mechanismus der CD74-NRG1 Genfusion liegt in der membranständigen Expression des nicht in der gesunden Lunge exprimierten Liganden NRG1 III β3, welcher natürlicherweise vor allem für die Entwicklung von Schwannzellen und Kardiomyozyten benötigt wird (Hynes &
Lane, 2005). Die exprimierte Domäne von NRG1 ist hierbei eine konservierte
EGF-like Domäne, die Interaktionen mit Proteinen der HER-Familie von Rezeptortyrosinkinasen eingehen kann. CD74-NRG1 aktiviert als Ligand den HER3 Rezeptor, welcher nach Bindung von NRG1 mit HER2 heterodimerisiert und dadurch trans-phosphoryliert wird. Dies führt in den Lungen-Adenokarzinomzelllinien H1568 und H322 sowohl zur Aktivierung des PI3-Kinase- als auch des MAP-Kinase Signalweges. Darüber hinaus kann die CD74-NRG1 Genfusion in H1568 Zellen unter anderem das kontaktunabhängige Wachstum in Soft-Agar verstärken. Die Signaltransduktion von CD74-NRG1 über HER2 könnte therapeutisch relevant sein. Die Inhibierung von HER2 mit einem selektiven Inhibitor, Afatinib, kann die HER2-abhängige Phosphorylierung von HER3 und die daraus resultierende Aktivierung des PI3-Kinase Signalweges inhibieren. In der Zukunft muss die Onkogenität der CD74-NRG1 Genfusion unter anderem noch in einem Mausmodell in vivo bestätigt werden. Durch diese Arbeit konnte mit der Beschreibung und Charakterisierung der Genfusion sowie des Designs des Mausvektors der Grundstein für weitere Analysen gelegt werden.
Darüber hinaus konnte eine gezielte potentielle Therapie für Patienten mit der CD74-NRG1 Genfusion aufgezeigt werden, welche bis jetzt unbehandelbar wären.
Table of contents
ZUSAMMENFASSUNG ... 4
TABLE OF CONTENTS ... 6
ABBREVATIONS ... 9
1 -‐ INTRODUCTION ... 11
1.1 Cancer ... 11
1.2 Lung cancer ... 11
1.2.1 Epidemiology ... 11
1.2.2 Classification ... 13
1.2.2.1 Small cell lung cancer ... 13
1.2.2.2 Non-‐small cell lung cancer ... 13
1.2.3 Cell of origin ... 15
1.2.4 Treatment ... 16
1.3 Tumor development ... 18
1.3.1 Oncogenes and tumor suppressor genes ... 19
1.3.2 Hallmarks of cancer ... 21
1.3.2.1 Resisting cell death ... 22
1.3.2.2 Sustaining proliferative signaling ... 23
1.3.2.3 Evading growth suppressors ... 24
1.3.2.4 Activating invasion and metastasis ... 24
1.3.2.5 Enabling replicative immortality ... 25
1.3.2.6 Inducing angiogenesis ... 25
1.3.3 Fusion-‐genes ... 26
1.4. Neuregulin-‐HER2:HER3 signaling pathway ... 28
2 -‐ AIM OF THIS STUDY ... 31
3 -‐ MATERIAL AND METHODS ... 33
3.1 Antibodies ... 33
3.2 Compounds ... 33
3.3 DNA and RNA handling ... 34
3.4 cDNA synthesis ... 34
3.5 Sanger sequencing ... 34
3.6 Molecular cloning ... 35
3.6.1 PCR and restriction enzyme based cloning ... 35
3.6.2 Gibson assembly ... 35
3.7 Primer ... 37
3.7.1 Cloning Primer (5’ to 3’): ... 37
3.7.2 Sequencing Primer (5’ to 3’): ... 38
3.8 Cell lines ... 40
3.9 Virus production ... 41
3.9.1 Stable transduction of cells ... 42
3.10 Preparation of cell lysates ... 42
3.11 SDS-‐polyacrylamide gel electrophoresis (PAGE) ... 43
3.12 Western Blot / Immunoblot ... 43
3.13 Co-‐Immunoprecipitation ... 44
3.14 Supernatant concentration ... 44
3.15 Soft agar assay ... 45
3.16 Proliferation assay ... 45
3.17 Viability assay ... 45
3.18 Flow cytometry ... 46
3.19 Immunofluorescence ... 46
4 -‐ RESULTS ... 47
4.1 Identification of CD74-‐NRG1 gene fusion ... 47
4.2 Characterization of CD74-‐NRG1’s general cellular properties ... 48
4.2.1 CD74 promoter leads to expression of CD74-‐NRG1 gene fusion ... 48
4.2.2 Cellular localization of the CD74-‐NRG1 gene fusion ... 49
4.2.3 CD74-‐NRG1’s function is achieved via the NRG1-‐part of the gene fusion ... 52
4.2.4 CD74-‐NRG1 interacts via its EGF domain with the HER3 receptor ... 53
4.2.5 CD74-‐NRG1 does not become shed in NIH-‐3T3 cells ... 57
4.3 Functional relevance of CD74-‐NRG1 gene fusion ... 58
4.3.1 CD74-‐NRG1 can lead to increased HER3 phosphorylation and can activate major downstream pathways ... 58
4.3.2 CD74-‐NRG1 does not transform Ba/F3 cells ... 61
4.3.3 In vitro proliferation assay reveals no increased proliferation rate of CD74-‐NRG1 transduced cell lines ... 61
4.3.4 CD74-‐NRG1 increases anchorage independent growth in H1568 cells ... 62
4.4 Translational relevance of CD74-‐NRG1 gene fusion ... 63
4.4.1 CD74-‐NRG1 fusion protein leads to a HER2 dependent HER3 trans-‐phosphorylation 63 4.4.2 Survival of H1568 and H322 cell lines harboring CD74-‐NRG1 gene fusion do not show increased viability upon EGFR and HER2 receptor inhibition. ... 64
4.4.3 CD74-‐NRG1 gene fusion does not lead to resistance in EGFR-‐dependent cell lines ... 66
4.4.4 NRG1 as a resistance mechanism in SKBR-‐3 and H3122 cell lines ... 67
4.5 Generation of an inducible CD74-‐NRG1 mouse ... 69
5 -‐ DISCUSSION ... 71
6 -‐ SUMMARY ... 77
7 -‐ REFERENCES ... 79
8 -‐ PUBLICATIONS ... 91
9 -‐ ACKNOWLEDGEMENT ... 92
10 -‐ CURRICULUM VITAE ... 93
11 -‐ EIDESSTATTLICHE ERKLÄRUNG ... 95
Abbrevations
ABL - abelson murine leukemia oncogene homolog AJCC - American Joint Committee on Cancer AKT - synonym for proteinkinase B
ALK - anaplastic lymphoma kinase AT - alveolar type
ATP - adenosine triphosphate BASC - bronchoalveolar stem cell BCR - breakpoint cluster region
BRAF - v-Raf murine sarcoma viral oncogene homolog B CCG - Cologne Center for Genomics
CD74 - cluster of differenciation 74
CDKN2A - cyclin dependent kinase (gene for p14 and p16 gene) cDNA - complementary DNA
CVD - cardiovascular diseases CK - cytokeratin
c-src - cellular sarcoma protein CRD - cysteine rich domain
CREBBP - cAMP responsive element binding protein CTG - CellTiter-Glo®
DAPI - 4’,6-diamidino-2-phenylindole
DDR2 - discoidin domain-containing receptor 2 DMSO - dimethylsulfoxide
DNA - deoxyribonucleic acid E.coli. - Escherichia Coli
ECL - enhanced chemiluminescence ECM - extracellular matrix
EDTA - ethylenediaminetetraacetic acid EGFR - epidermal growth factor receptor
EML4 - echinoderm microtubule-associated protein-like 4 ERBB - synonym for human epidermal growth factor receptor ERK - extracellular-signal-regulated kinase
e.v. - empty vector FCS - fetal calf serum
FGFR1 - fibroblast growth factor receptor 1 FISH - fluorescent in situ hybridization
FPKM - fragments per kilobase of exon per million fragments mapped GI - growth inhibition
HA - hemagglutinin
HER - human epidermal growth factor receptor HRP – horseradish peroxidase
IMA - invasive mucinous adenocarcinoma IP - immunoprecipitation
KIF5B - kinesin-1 heavy chain
KRAS - kirsten rat sarcoma viral oncogene homolog LKB1 - liver kinase B1
MAPK - mitogen-activated protein kinase MHC - major histocompatibility complex MLL - mixed lineage leukemia
NE - neuroendocrine
NFE2L2 - nuclear factor (erythroid-derived 2)-like 2 NRG - neuregulin
NSCLC - non-small cell lung cancer
NTRK1 - neurotrophic tyrosine kinase receptor p53 - protein of TP53 gene
PAGE - polyacrylamide gel electrophoresis PBS - phosphate-buffered saline
PCR - polymerase chain reaction PFA - paraformaldehyde
PFS - progression-free survival PI3K - phosphoinositide-3-kinase
PIK3CA - phosphatidylinositol-4,5-bisphosphate 3-kinase, catalytic subunit alpha
PNEC - pulmonary neuroendocrine cell PVDF - polyvinylidene fluoride
PS - penicillin/streptomycin RNA - ribonucleic acid
PTEN - phosphatase and tensin homolog SCLC - small cell lung cancer
SDS - sodium dodecyl sulfate RB1 - retinoblastoma protein
RET - rearranged during transfection RSV - rous sarcoma virus
RTK - receptor tyrosine kinase SCC - squamous cell carcinoma TE - Tris-EDTA
TKI - tyrosine kinase inhibitor TP53 - tumor protein p53 TP63 - tumor protein p63
TTF-1 - thyroid transcription factor 1
UICC - Union Internationale Contre le Cancer US - United States of America
v-src - viral sarcoma protein
VEGF - vascular endothelial growth factors
VEGFR - vascular endothelial growth factor receptor WB - western blot
The international system of units was used in this thesis.
1 - Introduction
1.1 Cancer
Cancer can be generally described as a disease caused by uncontrolled cell growth. In 2012 cancer led to around 8.2 million cases of death (IARC, 2012).
However, cardiovascular diseases (CVD) are the deadliest diseases worldwide causing 17.3 million deaths in 2008 (cancer: 7.3 million (2008)) (WHO, 2011). Even now there are more cancer-related than CVD-related deaths in 10 European countries among men. Only in Denmark this holds also true for women (Nichols, Townsend, Scarborough, & Rayner, 2014). It is predicted that the total numbers of new cancer cases will increase to 21.4 million by 2030 (WHO, 2011).
1.2 Lung cancer
1.2.1 Epidemiology
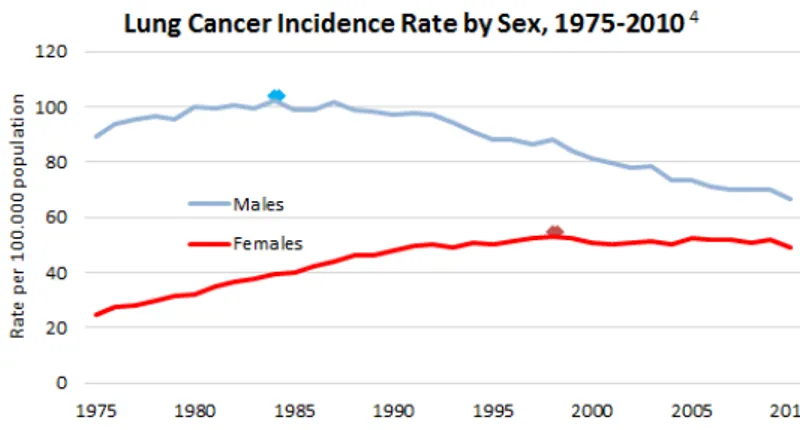
Lung cancer is the most frequent and deadliest type of cancer accounting for 1.8 million new cases (12.9% of all new cancer cases) and leading to 1.59 million deaths (19.3%) in 2012 (IARC, 2012). Lung cancer is heavily associated with tobacco exposure with about 90% of lung cancer patients being active or former smokers (Hecht, 1999; 2002). In about 10% there are other factors causing lung cancer (Thun et al., 2008). The outcome for lung cancer patients is very poor - the five-year survival rate is only about 16% for all patients. Notably, the incidence rate for lung cancer in the United States of America (US) from 1975 - 2010 of men has dropped by 24% while it doubled within the same time for women. This might be explained by an increasing amount of female smokers, changes in smoking habits and changes in social behavior (Fig. 1) (National Cancer Institute, 2014).
Figure 1: Incidence rate for lung cancer by sex from 1975-2010 in the US.
http://www.lung.org/assets/images/chart-and-graphs/LC-Incidence-by-Sex.png
In general patients do not feel any side effects of early stage lung cancers, therefore about 70% of patients are diagnosed at late stage disease (stage III or IV). Unfortunately a diagnosis at late stage goes often in line with poor survival as low as 9.5 months median survival time for stage IV patients (Clinical Lung Cancer Genome Project (CLCGP) Network Genomic Medicine (NGM), 2013). For the classification of lung cancer the Union Internationale Contre le Cancer (UICC) and the American Joint Committee on Cancer (AJCC) have published the 7th edition of the international standardized TNM staging system. The TNM staging system describes: (1) the size and growth stage of the tumor (T), (2) if the tumor already spread to the lymph nodes (N) and (3) if the tumor has already metastasized (M). These criteria are used to judge a patient’s tumor stage and are updated regularly (Fig. 2) (Detterbeck, 2009).
Figure 2: TNM staging system according to lung cancer stage (Detterbeck, 2009).
1.2.2 Classification
The classification of lung cancer is assessed according to histological stainings. It can be coarsely divided into non-small cell lung cancer (NSCLC) and small cell lung cancer (SCLC) (Petersen, 2011; Travis, Brambilla, & Riely, 2013). But due to the increasing amount of genomics data, there is a future trend to diagnose and classify lung cancers based on genomics data as every subtype has its own molecular profile. Therefore, molecular pathology can lead to a completely unbiased diagnosis and classification system in the near future and could already eliminate and further subdivide the group of large cell carcinomas (Clinical Lung Cancer Genome Project (CLCGP) Network Genomic Medicine (NGM), 2013).
1.2.2.1 Small cell lung cancer
Small cell lung cancer accounts for around 15% of all diagnosed lung cancer cases worldwide (Wahbah, Boroumand, Castro, El-Zeky, & Eltorky, 2007) and is highly associated with smoking. More than 90% of SCLC patients being or having been heavy smokers (Rosell & Wannesson, 2012; van Meerbeeck, Fennell, & De Ruysscher, 2011). SCLC patients typically respond very well to initial standard chemotherapy with platinum and etoposide but show very soon a resistance phenotype and tumor relapse. The tumor is characterized by early metastasis and patients show a very poor 2-year survival of 5% for extensive stage or ~15% for limited stage disease (Pleasance et al., 2010).
Up to now no gene could be identified as therapeutical target in SCLC. Only the tumor suppressor genes tumor protein p53 (TP53) and retinoblastoma protein (RB1) are consistently inactivated in SCLC (Peifer et al., 2012; Rudin et al., 2012).
1.2.2.2 Non-small cell lung cancer
NSCLC can be divided into three main groups: adenocarcinoma, large cell carcinoma and squamous cell carcinoma. Other NSCLC subtypes are very rare.
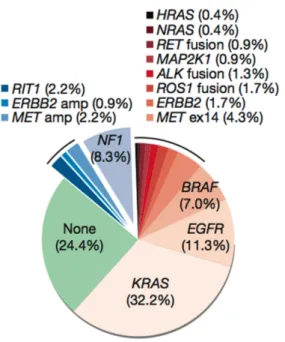
Adenocarcinoma accounts for ~50% of all lung cancer cases and is the most frequent subtype of lung cancer. It is the leading cause for cancer-related mortality with more than one million deaths worldwide. The most common mutated driver oncogenes are kirsten rat sarcoma viral oncogene homolog (KRAS) and epidermal growth factor receptor (EGFR). These genes are mutated in about 30-40% of all lung adenocarcinomas. But still in 25-50% of lung adenocarcinomas the oncogenic driver is unknown (Fig. 3) (Cancer Genome Atlas Research Network, 2014; Pao & Hutchinson, 2012). In immunohistochemistry lung adenocarcinomas are typically positive for thyroid transcription factor 1 (TTF-1) and cytokeratin 7 (CK7) (Lau, Desrochers, &
Luthringer, 2002; Su, Hsu, & Chai, 2006).
Figure 3: Distribution of oncogenic driver mutations in lung adenocarcinoma (Cancer Genome Atlas Research Network, 2014).
Squamous cell carcinoma (SCC) accounts for ~30% of NSCLC cases.
Typically SCC is positive for tumor protein p63 (TP63) and cytokeratins 5/6 in immunohistochemistry. Common mutations for SCC are TP53, discoidin domain-containing receptor 2 (DDR2), nuclear factor (erythroid-derived 2)-like 2 (NFE2L2) and fibroblast growth factor receptor 1 (FGFR1) (Clinical Lung Cancer Genome Project (CLCGP) Network Genomic Medicine (NGM), 2013;
Hammerman et al., 2011; Perez-Moreno, Brambilla, Thomas, & Soria, 2012;
Weiss et al., 2010).
Large cell carcinoma is a very heterogeneous group within lung cancer. It is poorly differentiated and accounts for about 10% of lung cancer cases. In immunohistochemistry it can only be characterized by negative TTF-1 stainings. Due to its poor differentiation and molecular similarities to other lung cancer subtypes there are thoughts that large cell carcinoma are only poorly differentiated variants of lung adenocarcinoma or squamous cell carcinoma. Therefore this subtype might be a more and more vanishing entity (Clinical Lung Cancer Genome Project (CLCGP) Network Genomic Medicine (NGM), 2013).
1.2.3 Cell of origin
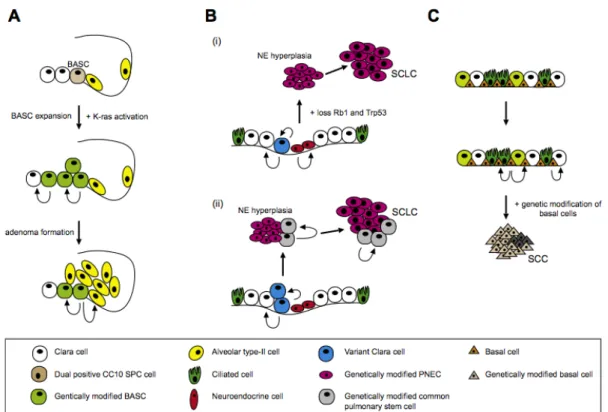
In the past a lot of research was aimed to decipher the cell of origin for every lung cancer subtype. But up to now the cellular origin of every lung cancer subtype is unknown (Fig. 4) (Sutherland et al., 2011). Recently, alveolar type (AT) 1/2 cells have been described as being capable of potentially initiating oncogenesis in mice (Desai, Brownfield, & Krasnow, 2014). From murine models it is known that the genetic alterations and the harboring cell type are very likely to be responsible for the tumor phenotype (Jackson et al., 2001;
Meuwissen et al., 2003). Even transdifferentiation of one tumor type from one subtype to another have been described while tumors acquire additional genomic alterations (Han et al., 2014; Peifer et al., 2012). Notably cell type specific expression of KRAS G12D in AT2 and clara cells leads to lung adenocarcinoma while inactivation of TP53 and RB1 in clara, neuroendocrine and AT2 cells fosters the development of SCLC in mice (Fig. 4) (Sutherland et al., 2011; 2014).
Figure 4: Putative model for the role of progenitor cells in the development of lung cancer. (A) The role of activated kras in bronchoalveolar stem cells (BASC) in NSCLS. (B) Two models for the development of neuroendocrine (NE) tumors in epithelial cells of bronchi. (i) NE tumor arise from pulmonary neuroendocrine cells (PNEC), (ii) another hypothesis would be that NE tumors arise from less- differentiated cells. (C) SCC is thought to evolve from basal cells of the trachea which harbors stem-cell-like properties (Sutherland & Berns, 2010).
1.2.4 Treatment
As distinct lung cancer types harbor distinct genomic alterations, proper molecular diagnosis for every subtype is indispensable. SCLC standard therapy consists of platinum- and etoposide-based chemotherapy and radiotherapy. Patients show a very high initial response to chemotherapy (70- 90%) but relapse within months (Metro & Cappuzzo, 2009; Simon & Turrisi, 2007). The role of surgery remains controversial but there are indications that surgery does not prolong patient’s life (Lad, 1994; Lim, Belcher, Yap, Nicholson, & Goldstraw, 2008).
Treatment guidelines for NSCLC are dependent on the tumor stage at diagnosis. In NSCLC patients that are staged up to IIIa a complete resection of the tumor is theoretically possible. Patients receive typically combined platinum-based chemotherapy and radiotherapy before and after surgery
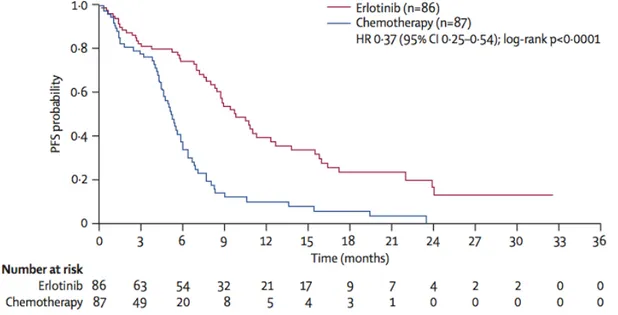
(Vansteenkiste et al., 2013). Patients that harbor a NSCLC with stage IIIb or IV cannot be cured any more. For these patients histology and especially molecular pathology for the detection of potentially druggable oncogenic driver mutations is recommended (Reck et al., 2014). Personalized medicine was first proven to lead to a better survival in the IPASS and EURTAC trial showing that patients harboring mutated EGFR do benefit from targeted therapy of EGFR-inhibition with erlotinib or gefitinib (Fig. 5) (Maemondo et al., 2010; Rosell et al., 2012).
Figure 5: Gain of progression-free survival (PFS) by targeted therapy compared to chemotherapy. Kaplan-Meier plot of PFS of EGFR-mutated NSCLC patients treated either with chemotherapy or an EGFR-inhibitor (erlotinib) (Rosell et al., 2012).
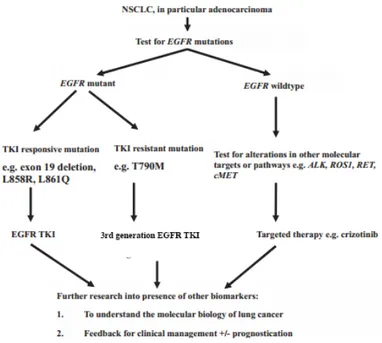
In Germany according to patient’s health conditions and cancer center, different treatment options are applied. As molecular diagnostics takes about 2-4 weeks patients are treated in the meantime with platinum-based chemotherapy. With the application of molecular diagnostics the patient could gain additional and beneficial treatment options such as EGFR tyrosine kinase inhibitors (TKI) in the case of EGFR-mutated NSCLC as these cancers are dependent on EGFR signaling (Fig. 6) (Reck et al., 2014; Rosell et al., 2012). The broader the molecular diagnostics panel, the bigger is the chance of having additional treatment options for specific driver lesions. Many clinical
trials are now conducted to analyze if targeted therapy of druggable oncogenic mutations leads to oncogenic dependency in these patients, another example beside EGFR TKIs would be crizotinib which targets anaplastic lymphoma kinase (ALK) and leads to a better PFS in these patients as well (Shaw et al., 2013).
Figure 6: Relevance of molecular pathology for treatment of NSCLC (adapted from (W. A. Cooper, Lam, O'Toole, & Minna, 2013)).
1.3 Tumor development
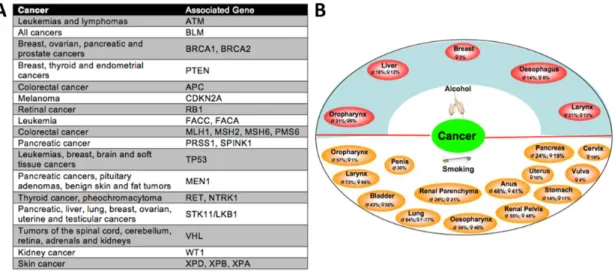
Cancer is a disease of the genome and develops in a multi-step process. It is influenced by many different factors, e.g. cells get exposed to carcinogens from the environment. Those factors can finally lead to an altered expression of one or a set of genes, alter the genomic sequence or facilitate cells of developing cancer that are already predisposed by inherited somatic mutations (Fig. 7) ((Irigaray et al., 2007) and reviewed in (Anand et al., 2008;
Arteaga et al., 2014)).
Figure 7: Genetical predisposition and enviromental factors develop to different cancer types. (A) Inherited mutations that predispose to different cancer types. (B) Association of alcohol usage and smoking linked to different types of cancer (adapted from (Anand et al., 2008; Arteaga et al., 2014)).
In many cases proto-oncogenes or tumor suppressor genes are altered by genomic aberrations or epigenetic modifications which cause or predispose to cancer development (Chin & Gray, 2008). Other possibilities include genomic rearrangements thereby creating fusion genes, alternative splicing or deletions of regulatory regions of proteins that influence tumor development as well (Cancer Genome Atlas Research Network, 2014; Ekstrand, Sugawa, James, & Collins, 1992; Soda et al., 2007).
1.3.1 Oncogenes and tumor suppressor genes
The oncogene hypothesis of cancer was first established by Hübner and Todaro in 1969 (Huebner & Todaro, 1969). Oncogenes can be defined as genes that encode for proteins that are capable to drive the activation of a potential oncogenic pathway upon deregulation. These pathways have in general important roles in signal transduction for cell growth, cell divisions and differentiation. Traditionally the first viral oncogene described was viral sarcoma protein (v-src) from rous sarcoma virus (RSV) by J. Michael Bishop’s lab (Bernstein, MacCormick, & Martin, 1976; Swanstrom, Parker, Varmus, &
Bishop, 1983). RSV could transform chicken embryos and led to transformation of mouse fibroblasts. Already in 1910 Peyton Rous could show
that a chicken tumor was transplantable from one chicken to another and that he could transmit the cancer without any cells (Rous, 1910; 1911). Only a small change in nucleotide sequences could lead to tumor formation when human wild-type c-src was turned into viral derived v-src (G. M. Cooper, 2000;
Swanstrom et al., 1983).
There are different ways that lead to deregulation of proto-oncogenes. The most common ways for deregulation are either by gain-of-function mutations or amplifications therefore leading to constitutive and increased pathway activation. Structural aberrations leading to genomic rearrangements or translocations and segmental deletions of regulatory elements are observed as well to activate oncogenes constitutively (Chin & Gray, 2008). In lung cancer the most frequently mutated oncogenes are KRAS, EGFR, PIK3CA, BRAF and ERBB2 (Clinical Lung Cancer Genome Project (CLCGP) Network Genomic Medicine (NGM), 2013) (reviewed in (W. A. Cooper et al., 2013)).
In contrast tumor-suppressors are negative regulators of cell growth and do act in a recessive fashion compared to the dominant acting oncogenes. RB1 gene was the first tumor suppressor that has been shown to be involved in cell-cycle control and progression. A biallelic loss-of-function mutation of RB1 leads to retinoblastoma which is a rapidly developing cancer of the eye in childhood. In general both allels of a tumor suppressor gene have to be inactivated to fully predispose a cell or an organism to cancer (Knudson, 1971). The recessive fashion of tumor suppressor genes and the fact that both allels have to be hit to get full predisposition to cancer is reflected in their function. Most tumor suppressor genes are involved in cell cycle control, DNA repair or DNA damage sensing, cell differentiation, migration or protein degradation. Therefore it is very hard to treat patients with aberrations in tumor suppressor genes therapeutically as their function needs to be reconstituted instead of inhibited. This can up to now only work if the gene is epigenetically silenced and reactivation is achieved e.g. via histone deacetylase or DNA methyltransferase inhibitors which lead to global re- expression of genes including tumor suppressor genes (Bolden, Peart, &
Johnstone, 2006; Cameron, Bachman, Myöhänen, Herman, & Baylin, 1999).
An inactivating mutation of TP53 in lung cancer already lowers the probability
of survival. Survival is even more decreased with additional oncogenic mutations of oncogenes and typically if already one allel is lost, the non- mutated allel is lost by loss of heterozygosity leading to the complete loss of both allels (Clinical Lung Cancer Genome Project (CLCGP) Network Genomic Medicine (NGM), 2013). Typical tumor suppressor genes showing genomic aberrations in lung cancer are TP53, PTEN, RB1, LKB1 and p16/CDKN2A and do mainly act in cell cycle control pathways (W. A. Cooper et al., 2013).
1.3.2 Hallmarks of cancer
In the famous reviews “Hallmarks of Cancer” (2000) and “Hallmarks of Cancer: the next generation” (2011) Douglas Hanahan and Robert Weinberg describe essential alterations which alter and transform healthy cells and lead to tumor development by influencing cell metabolism and cell physiology.
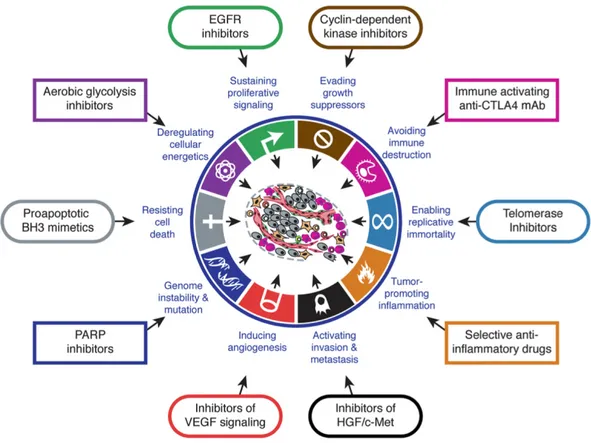
Drugs that interfere with these emerging hallmarks are used in clinical trials to treat human cancers (Fig. 8). Nevertheless the central hallmarks of cancer are:
• resisting cell death
• sustaining proliferative signaling
• evading growth suppressors
• activating invasion and metastasis
• enabling replicative immortality
• inducing angiogenesis
In the updated version from 2011 two emerging hallmarks – deregulating cellular energetics and avoiding immune destruction – and two enabling characteristics – genome instability and mutation and tumor-promoting inflammation – were added (Hanahan & Weinberg, 2011). But to understand the general biology of cancer this introduction focuses on the core hallmarks of cancer from 2000.
Figure 8: Hallmarks of cancer and examples for druggable targets.
1.3.2.1 Resisting cell death
Cell death or apoptosis is a strongly controlled mechanism of the human body that is balanced via pro- and anti-apoptotic proteins. It is an important mechanism to eliminate damaged cells, cells that are misplaced or no longer needed or for cells that are recognized as “non-self”. This can be controlled either by immune cells or compounds via activation of death receptors or via intrinsic signaling e.g. upon DNA damage (Wang et al., 2013; N. S. Wilson, Dixit, & Ashkenazi, 2009). The most important enzymes signaling towards apoptosis are the caspase enzymes (Ashkenazi, 2008). TP53 was called
“guardian of the genome” as p53 is one of the most important proteins sensing DNA damage or stress (D. P. Lane, 1992). It can sense DNA damage and accumulates upon DNA damage in the nucleus and arrests the cells in G1
phase in order to get the DNA damage repaired. If this is not possible, p53 initiates the caspase pathway by upregulating pro-apoptotic proteins which lead to apoptosis to prevent the transfer of damaged or mutated DNA to the
next generation (Ashkenazi, 2008; Kruse & Gu, 2009). In cancer cells apoptosis is actively inhibited by inactivating pro-apoptotic signaling pathways and survival is supported by the activation of anti-apoptotic pathways. In cancer TP53 is the most frequently mutated gene. In general it gets inactivated and therefore cannot trigger apoptosis any more. By this mechanism, cancer cells can evade apoptosis even under circumstances like cellular stress and accumulation of mutations (Levine & Oren, 2009).
Especially in SCLC (up to 100%) and NSCLC (more than 50%) TP53 is inactivated in many patients (Clinical Lung Cancer Genome Project (CLCGP) Network Genomic Medicine (NGM), 2013; Peifer et al., 2012).
1.3.2.2 Sustaining proliferative signaling
Sustaining proliferative signaling is one of the most fundamental mechanisms of cancer cells. Healthy cell proliferation is tightly controlled and does need different stimuli for proliferation. The most prominent pathways are the phosphoinositide-3-kinase (PI3K) and mitogen-activated protein kinase (MAPK) pathways which are essential and key pathways in many cancers.
They are generally used for driving cell growth and proliferation, survival, angiogenesis and inhibit apoptosis. Therefore constitutive activation of these pathways is important for many cancers and can mediate resistance to therapy. Key molecules of those pathways are currently used as targets in running clinical trials (Baselga, 2011; Burris, 2013; P. Liu, Cheng, Roberts, &
Zhao, 2009). The PI3K and MAPK pathways are activated by receptor tyrosine kinases (RTKs) which are anchored in the cellular membrane. Each RTK has different specificities to different ligands (growth factors). These growth factors are either produced in a para- or autocrine manner. By controlling the activated state of RTKs by a specific ligand the downstream pathway can be carefully controlled. Tumor cells can therefore overexpress the ligand, overexpress the RTK or acquire activating mutations within the RTK itself or increase the affinity of the ligand to the RTK, leading to constitutive activation of the pathway (Greulich et al., 2005; Huang, Xu, &
White, 2009; Zadeh, Bhat, & Aldape, 2013). Another way of leading to a
sustained proliferative signaling within this network is via inactivation of PTEN, a tumor suppressor gene involved in dephosphorylation and therefore inactivation of the PI3K pathway. As all of the mentioned mechanisms are used or hijacked by cancer cells, many pathways and key proteins are pharmacologically used to tackle the oncogenic signaling of the tumor.
Mutations in the PI3K and MAPK pathway are often found in lung adenocarcinomas and can be therapeutically targeted (Clinical Lung Cancer Genome Project (CLCGP) Network Genomic Medicine (NGM), 2013; Ding et al., 2008; Rosell et al., 2012).
1.3.2.3 Evading growth suppressors
The cell cycle is well controlled in normal cells to prevent the transfer of mutations to daughter cells or to prevent improper tissue formation. This is achieved via a resting (G0- or G1-phase) phase in cell cycle e.g. by the retinoblastoma protein 1 (RB1) before cells enter the S-phase. This tumor suppressor protein is important in the transmission of anti-growth signals classically by binding E2F – a strong transcriptional activator. RB1 is mutated, deleted or inactivated especially in up to 100% of SCLC but often inactivated in other cancers as well (Burkhart & Sage, 2008; Classon & Harlow, 2002;
Clinical Lung Cancer Genome Project (CLCGP) Network Genomic Medicine (NGM), 2013; Peifer et al., 2012). If RB1 is mutated and inactivated the cells cannot control their cell cycle any more and cannot arrest in G0. Only about 4% of lung adenocarcinomas are affected by inactivation of RB1. But this pathway is affected in about 15% of lung adenocarcinomas by CDKN2A mutations which acts upstream of P53 and RB1 and leads to the inactivation of a negative feedback loop for RB1 (Clinical Lung Cancer Genome Project (CLCGP) Network Genomic Medicine (NGM), 2013; Ding et al., 2008).
1.3.2.4 Activating invasion and metastasis
Tumor cells acquire invasive and metastasizing properties during their development. Normal cells depend on cell-cell interactions and cell-matrix interaction with the extracellular matrix (ECM). These interactions are mainly
provided by cadherins and intergrins that interact with the ECM and neighboring cells providing pro-survival and pro-proliferative signals. Normal cells induce apoptosis or anoikis if they loose contact with other cells or the ECM (Frisch & Francis, 1994; Lelièvre et al., 2012). Malignant cancer cells have often lost E-cadherin, one of the main proteins for cell-cell interactions, and do not depend on survival signals from neighboring cells or the ECM anymore. These tumor cells gained the ability to migrate via the blood or lymph vessel system to more distant organs and some of them are even able to establish a metastasis at a distant site (Chiang & Massagué, 2008; Klein, 2008). As 90% of all cancer patients die from metastasis it is surprising that this process is not fully understood. Therefore ongoing intensive research focuses to slow down or even prevent metastatic spread in the future (Arteaga et al., 2014).
1.3.2.5 Enabling replicative immortality
The replicative capacity of most human body cells is limited due to the length of the telomeres which protect the caps of the chromosomes. During cell division they get shortened with each division. If their length falls below a critic threshold for maintaining genomic integrity, cells can induce senescence or apoptosis. The number of cell divisions up to this state is named Hayflick limit (Hayflick, 1965; Shay & Wright, 2000). Cancer cells as well as stem cells can bypass this limit by expressing telomerase - an enzyme that can lengthen the telomeres again. Therefore these cells can divide for an unlimited time.
Telomerase inhibitors are under development in clinical trials for different types of cancer - especially as reexpression of telomerase is very common in NSCLC and SCLC and many other cancers (C.-H. Chen & Chen, 2011;
Harley, 2008; Shay & Bacchetti, 1997).
1.3.2.6 Inducing angiogenesis
After tumor establishment a tumor can grow up to 1-2mm in diameter but then stops or becomes necrotic as oxygen or nutrition supply cannot reach the tumor center any more via diffusion (N. Nishida, Yano, Nishida, Kamura, &
Kojiro, 2006). To circumvent the growth limits, tumor cells use a process called tumor-associated neovascularization. This process is induced by cytokines, angiopoietins and vascular endothelial growth factors (VEGFs) which increase permeability and induce sprouting of new blood vessels.
Secretion of VEGFs and binding to their corresponding receptor (VEGF receptors 1-4 (VEGFR)) can secure oxygen and nutrition supply of cancer cells in a multistep process (Hanahan & Folkman, 1996; Saaristo, Karpanen,
& Alitalo, 2000; Senger et al., 1983). Inducing angiogenesis is therefore important for tumors to grow and survive. This is reflected in a wide range of tumors showing elevated levels of VEGF or VEGFR (Goel & Mercurio, 2013).
Treatment efforts towards VEGF signaling inhibition decreases the amount of blood vessels but at the same time other drugs cannot reach the tumor as efficient as if the tumor was fully vascularized. In addition inhibition of VEGF or VEGF receptors can result in increased invasion and metastasis by several escape mechanisms (Ebos et al., 2009; Goel & Mercurio, 2013; Paez-Ribes et al., 2009). One possibility to escape the inhibition is for example the upregulation of placental growth factor that can activate VEGFR1, too (Fischer et al., 2007).
1.3.3 Fusion-genes
The first chromosomal translocation was discovered in 1960 by Peter Nowell and David Hungerford in a patient with chronic myeloid leukemia (Nowell &
Hungerford, 1960). The BCR-ABL gene fusion results from a chromosomal translocation of chromosome 9 and 22. This fusion protein leads to cellular transformation and can cause leukemias (Sawyers, 1993). Due to hyperactive kinase activity of the ABL nuclear kinase the cell undergoes uncontrolled cell growth. Another decade after demonstrating that BCR-ABL is tumorigenic in mice, treatment with imatinib and other tyrosine kinase inhibitors were shown to be effective in tumor treatment mediated by the inhibition of ABL kinase activity (Deininger, Buchdunger, & Druker, 2005; Druker, 2003). More than 50,000 cases of chromosomal rearrangement creating gene fusions have been found across all main tumor types up to now (Mitelman, Johansson, &
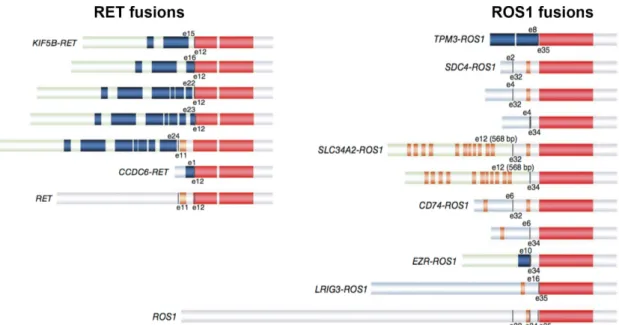
Mertens, 2007). The most interesting fusion genes are the ones generated in- frame and therefore leading to an actual fusion protein. The best characterized fusion proteins are those that hijack the promoter of the 5’ part of gene A and fuse it to the kinase part of gene B resulting in a deregulated hyperactive tyrosine kinase such as in BCR-ABL. This method destroys regulatory elements of kinases or kinases get expressed in a tissue in which they are generally not expressed or only during development. Common gene fusions found in lung cancer are EML4-ALK, KIF5B-RET and CD74-ROS1 (Fig. 9). In summary all described fusion genes lead to hyperactive kinases and to cellular transformation that can be targeted and thereby inhibited with specific molecules (Kohno et al., 2012; Rikova et al., 2007; Soda et al., 2007;
Takeuchi et al., 2012). Other chromosomal translocations lead to the loss of function of tumor suppressor genes such as CREBBP, CHEK2 or MLL either by an out-of-frame fusion or by destroying functional domains of the protein (Jin, Mertens, Kullendorff, & Panagopoulos, 2006; Pleasance et al., 2010; Xia, Anderson, Diaz, & Zeleznik-Le, 2003).
Figure 9: Different RET and ROS1 fusion genes found in NSCLC. The kinase domain (red) is conserved in every fusion protein (modified from (Takeuchi et al., 2012)).
1.4. Neuregulin-HER2:HER3 signaling pathway
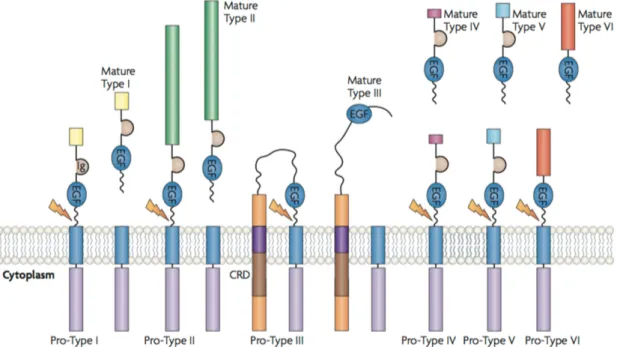
The family of neuregulins (NRGs) is a very broad family of growth factors with more than 30 isoforms. They mediate cell-cell interactions in neuronal cells, cardiocytes, breast and epithelial cells. NRGs are divided in 6 major families.
While types I, II, IV-VI are soluble ligands, NRG1 type III stays membrane- tethered (Falls, 2003; L. Mei & Xiong, 2008).
Figure 10: Different isoforms and processing of NRG1. Only NRG1 type III contains a cysteine rich domain (CRD) in its amino terminus determining the type of NRG1 and stays membrane-tethered compared to the other isoforms (L. Mei &
Xiong, 2008).
NRG1 type III is a crucial survival factor for Schwann cell precursors in embryonic nerves but is expressed in axons as well and regulates myelin sheath thickness (Falls, 2003; Jessen & Mirsky, 2005; L. Mei & Xiong, 2008;
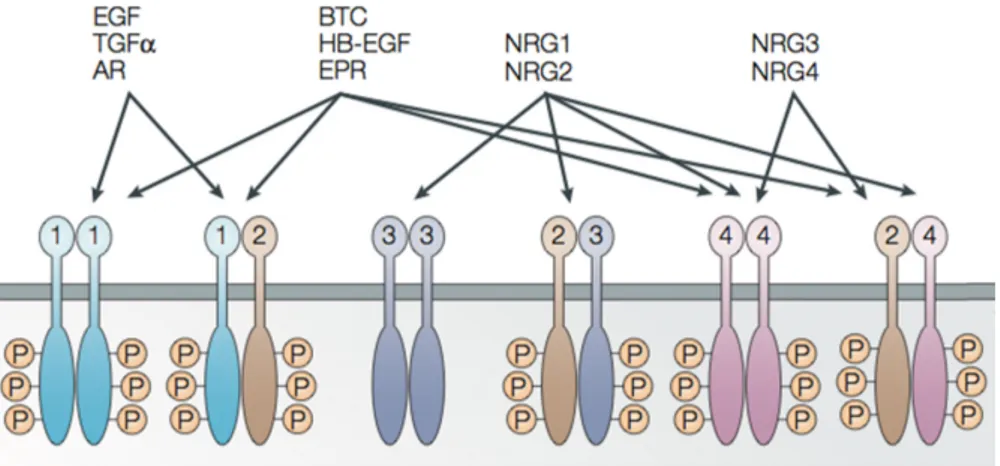
Wolpowitz et al., 2000). These functions are triggered via NRGs binding affinity to humane epidermal growth factor receptor 3 (HER) and HER4. Both are RTKs that are localized on the plasma membrane for signaling via the PI3K and MAPK pathway (Fig. 11) (Hynes & Lane, 2005; Sithanandam et al., 2003; Yarden & Sliwkowski, 2001).
Figure 11: Interaction network of HER receptors 1-4. Different HER receptors can be activated by different ligands. Binding affinity of ligands to different homo- and heterodimers influences the signaling (modified from (Hynes & Lane, 2005)).
HER3 was discovered in 1989 and is the biggest HER receptor (Kraus, Issing, Miki, Popescu, & Aaronson, 1989; Roskoski, 2014). It has the most PI3K (p85 subunit binding sites of PI3K) phospho-tyrosine binding sites but has an impaired kinase domain activity that cannot or ~1,000 times less efficient phosphorylate itself or other kinases. This is due to the nonconservatively substitution of important amino acid residues within the kinase domain in comparison to the other HER family members (Hynes & Lane, 2005;
Roskoski, 2014; Shi, Telesco, Liu, Radhakrishnan, & Lemmon, 2010). The best characterized dimerization partner of HER3 is HER2 which preferentially forms heterodimers upon NRG1 binding to HER3 and trans-phosphorylates HER3 (Baselga & Swain, 2009; Li, Mei, Liu, & Zhou, 2007; Plowman et al., 1990; Yarden & Sliwkowski, 2001). Many tumors show elevated HER3 expression levels or upregulate expression of HER3 as a resistance mechanism upon treatment. Thus they harbor alternative possibilities to trigger the PI3K and MAPK signaling pathway (Engelman et al., 2007; Sergina et al., 2007). Beside membranous localization, HER3 can relocalize to the nucleus in a cancer-specific manner. This has been discovered in NSCLC and correlated with increased vascular and lymphatic invasion and an overall poor survival (Baselga & Swain, 2009; Begnami et al., 2011; Maurer et al., 1998).
By this interaction network NRG1 can trigger HER3 receptor activation including its pro-oncogenic PI3K and MAPK signaling pathways and can even
establish a resistance mechanism when targeted therapies inhibit other pro- oncogenic pathways (T. R. Wilson et al., 2012).
2 - Aim of this study
Lung cancer is the world’s leading type of cancer conducting to death (IARC, 2012; Siegel, Ma, Zou, & Jemal, 2014). Lung adenocarcinoma accounts for about 50% of all lung cancer cases and in about 50% of all lung adenocarcinoma cases the oncogenic driver mutation is still unknown (Clinical Lung Cancer Genome Project (CLCGP) Network Genomic Medicine (NGM), 2013; Pao & Hutchinson, 2012). The most common driver mutations for lung adenocarcinoma are EGFR and KRAS mutations, which account for about 1/3 of all lung adenocarcinomas (Pao & Hutchinson, 2012). Since the identification of the EML4-ALK gene fusion in 2007, additional gene fusions have been found involving NTRK1, RET and ROS1 kinases (Davies et al., 2012; Kohno et al., 2012; Soda et al., 2007; Takeuchi et al., 2012; Vaishnavi et al., 2013). These gene fusions lead to oncogene dependency which can be therapeutically used for specific treatment and therefore help to prolong patient’s survival (Bergethon et al., 2012; Camidge, Pao, & Sequist, 2014;
Shaw et al., 2013). Therefore there were two objectives for this study after the discovery of the gene fusion in the index patient sample:
1. Functional characterization of CD74-NRG1 gene fusion.
As CD74-NRG1 gene fusion is a completely unknown gene fusion there was first the need to investigate basic properties of the gene fusion such as localization, interactions partners and functional relevant domains. The next step was to investigate biochemical effect in cells harboring the CD74-NRG1 gene fusion as well as showing a functional change within these cells such as pathway activation or beneficial growth properties such as colony formation capabilities.
2. Therapeutical relevance of CD74-NRG1 gene fusion
Due to the initial study design, the finding of a novel oncogenic driver mutation might harbor therapeutic potential. Therefore on the basis of the functional characterization results, CD74-NRG1 transduced cells were screened with different inhibitors. They were as well analyzed for inhibition of direct and indirect interaction partners and effects on downstream pathways. Thus,
potential treatment strategies were determined as well as possible resistance mechanisms due to CD74-NRG1 itself. The final results should help to translate the findings into clinical studies and to help targeting CD74-NRG1- positive tumors in the future.
3 - Material and Methods
3.1 Antibodies
protein company order no. dilution
β-actin-HRP Santa Cruz sc-47778 1:5000
AKT Cell signaling #9272 1:1000
p-AKT Cell signaling #9271 1:1000
CD74 Abcam ab22604 1:1000 (WB)
1:80 (IP)
CD74-PE Biolegend #357603 1:100
ERK1/2 Cell signaling #9102 1:1000
p-ERK1/2 Cell signaling #9106 1:2000
HA-tag Abcam ab130275
1:1000 (WB) 1:100 (flow cytom.)
HER2 Cell signaling #2242 1:1000
p-HER2 Cell signaling #2243 1:1000
HER3 Cell signaling #4754 1:1000
HER3 XP Cell signaling #12708 1:1000 (WB) 1:50 (IP)
p-HER3 Cell signaling #4791 1:1000
MEK1/2 Cell signaling #9122 1:1000
p-MEK1/2 Cell signaling #9121 1:1000
NRG1 β1 AF-396-NA 1:200 (WB)
1:20 (flow cytom.)
S6 Cell signaling #9202 1:1000
p-S6 Cell signaling #9205 1:1000
gt-anti-rb-HRP Millipore #12-348 1:3000 gt-anti-ms-HRP Millipore #12-349 1:3000 dk-anti-gt-HRP Millipore AP-180P 1:3000 gt-anti-rb-488 Life Technologies A-11008 1:800 dk-anti-gt-488 Life Technologies A-11055 1:800 gt-anti-ms-488 Life Technologies A-10680 1:800 Table 1: List of antibodies including application-specific concentrations.
3.2 Compounds
Compounds were either purchased at Selleck chemicals, Sigma-Aldrich or were a kind gift of Daniel Rauh, PhD and the Lead Discovery Center.
3.3 DNA and RNA handling
General DNA and RNA handling procedures were done according to standard manufacturer’s instructions. Extraction of plasmid DNA of bacterial transformation was done with Machery Nagel NucleoSpin mini-kit (mini), Machery Nagel NucleBond Xtra Midi EF kit (midi) or Machery Nagel NucleoSpin Gel and PCR clean-up kit. For elution of DNA TE-buffer (5mM Tris/HCl, pH 8.5) was used in an assay dependent volume. RNA extraction was performed with RNeasy mini kit (Qiagen).
3.4 cDNA synthesis
After RNA isolation 1µl of RNA was used for first-strand cDNA synthesis with the SuperScript III reverse transcriptase kit (LifeTechnologies). All reactions were mixed on ice.
1µl oligo(dT)18 (100µM) (Thermo Fisher Scientific) 1µl RNA template
1µl dNTP mix (10mM) (Thermo Fisher Scientific) up to 13µl H2O
The mix was heated in a thermocycler to 65°C for 5 minutes and cooled down on ice for 1 minute to let the oligo(dT) primers anneal to the poly-A overhangs of 3’ mRNA. Following the standard procedures of the protocol the mix was placed again in a thermocycler for 50 minutes at 50°C following inactivation for 15 minutes at 70°C. Subsequently 1µl RNase H (Thermo Fisher Scientific) was added to the reaction for 20 minutes at 37°C to remove RNA that might interfere in downstream applications by the formation of RNA:DNA hybrids.
Inactivation was taken out for 10 minutes at 65°C.
3.5 Sanger sequencing
All Sanger sequencing reactions were performed at the Cologne Center for Genomics (CCG) by dideoxy-sequencing with BigDye Terminator v3.1 (Applied Biosystems). For Sanger sequencing of specific regions from mRNA a mRNA-specific pre-amplification step with Maxima Hot Start Taq DNA
polymerase or Pfu DNA polymerase (Thermo Fisher Scientific) needed to be performed following general sequencing procedures.
3.6 Molecular cloning
3.6.1 PCR and restriction enzyme based cloning
Molecular cloning is being used in molecular biology to amplify DNA. It can be used for many purposes e.g. investigation of protein functions, gene-/protein editing, for therapeutics (recombinant Insulin, (Crea, Kraszewski, Hirose, &
Itakura, 1978)) and many more. For conventional cloning restriction enzymes that can cut sequence-specific DNA motifs are used because only sequence compatible ends can ligate and assemble in a ligation reaction. All restriction enzymes were purchased from Fermentas or New England Biolabs.
Transformation of Escherichia Coli (E.coli.) bacteria (DH5α, XL-Gold or NEB 5-alpha) were performed via standard protocols by heat shock. The CD74- ROS and SLC-ROS (long) genes were subcloned from the pcDNA3.1(+) vector to the standard retroviral pBabe-puro backbone via EcoRI and XhoI digest.
FIG-ROS (kind gift of Kwock-Kin Wong, MD, PhD), HER2, HER3 and CD74- NRG1 (cDNA) were PCR amplified with adapter primers containing restriction sites using proofreading PCR polymerases (Pfu-Ultra, Agilent; Q5 or Phusion, New England Biolabs) and cloned into pBabe-puro, pBabe-hygro and/or pBabe-neo retroviral vector. The truncated version of CD74-NRG1 lacking the EGF-like domain of NRG1 was PCR amplified with primers containing suitable restriction sites and an additional stop codon.
Hemagglutinin tag (HA) was added to full-length CD74-NRG1 using gene- specific primers with a HA tag containing overhang.
3.6.2 Gibson assembly
Gibson assembly is a technique developed by Daniel Gibson at the J. Craig Venter Institute in 2009. The assembly is completely independent of restriction enzymes and is based on an isothermal reaction with three different
enzymes (5’ T5 exonuclease, Q5 DNA polymerase, Taq DNA ligase) in one reaction (Fig. 12).
Figure 12: Mechanism of isothermal Gibson-Assembly reaction. Schematic cartoon of the three steps co-occurring in the isothermal Gibson assembly reaction (Gibson et al., 2009).
As the reaction takes place at 50°C, which is a trade-off of the optimal working temperatures of the three enzymes, the most critical step is that the melting temperature of the complementary overhangs created by the 5’ T5 exonuclease (first step) do match an annealing temperature of at least 50°C.
The second and third step cannot be divided into independent steps. When the overlapping single-stranded DNA overhangs anneal to each other the DNA polymerase fills up the gaps between the chew backs and the DNA ligase seals the nicks in between (Fig. 12). Gibson assembly is therefore the method of choice being independent of any restriction enzyme and joining several DNA parts in one reaction to a completely new vector and/or gene fusion. The mCherry fluorescent protein and CD74-NRG1/CD74-NRG1_del have been joined via Gibson assembly to the pBabe-mCherry-CD74- NRG1(_del) vector and used for immunofluorescent studies. The same approach has been used for generating the inducible mouse-targeting vector SERCA-Frt-STOP-FRT_LoxP-CD74-NRG1_LoxP (SERCA vector was a kind gift of Thomas Wunderlich, PhD (Belgardt et al., 2008)).
3.7 Primer
3.7.1 Cloning Primer (5’ to 3’):
Name length sequence
FIG-
ROS1F_BamHI 23 GCATGGATCCATGTCGGCGGGCG FIG-
ROS1R_SalI
35 GCATGTCGACTTAATCAGACCCATCTCCATATCC A
CD74-
NRG1F_BamHI
24 ctatGGATCCATGCACAGGAGGAG CD74-
NRG1R_SalI
28 gatcGTCGACTTATACAGCAATAGGGTC NRG1_truncate
d+SalI_R
37 GCATGTCGACCTAGAAAGTTTTCTCCTTCTCCGC ACA
CD74- NRG1+HA- TAG_SalI
73 GATCGTCGACCTACTAGGAGGCGTAGTCAGGCA CGTCGTATGGGTAGGCCATTTCAGGCAGAGACA GAAAGGG
ErbB3_F_SalI 27 GCATGTCGACATGAGGGCGAACGACGC ErbB3_R_SalI 31 GCATGTCGACCGTTCTCTGGGCATTAGCCTT HER3-pB-Eco-
Sal_F
41 AGTGTGGTGGTACGTAGGAATTCATGAGGGCGA ACGACGCT
EGFP_R+pB_S al
43 CACACATTCCACAGGGTCGACTAGCTACTAGCT AGTCGAGATC
HER3-EGFP_R 27 CTCACCATCGTTCTCTGGGCATTAGCC HER3-EGFP_F 26 AGAGAACGATGGTGAGCAAGGGCGAG pB-Eco-
Sal_mCherry
41 AGTGTGGTGGTACGTAGGAATTCATGGTGAGCA AGGGCGAG
mCherry-CD74- NRG1_R
28 CTGTGCATCTTGTACAGCTCGTCCATGC CD74-NRG1
(mCherry)_F
27 CTGTACAAGATGCACAGGAGGAGAAGC pB-Eco-
Sal_mCherry- CD74-NRG1_R
42 CACACATTCCACAGGGTCGACTATTCAGGCAGA GACAGAAAG
pB-Eco- Sal_mCherry- CD74-
NRG1_DEL_R
42 CACACATTCCACAGGGTCGACTAGAAAGTTTTCT CCTTCTCC
CAG_NEW_SE RCA_F
67 AAACTCTTCGCGGTCTTTCCAGTGGTTAATTAAA GTTATAATCGCTGAGGTAATATTTAAAATCATT CAG_Reverse_
new
45 CCACGAAGGAGTGAGGGCTGGATATGGAAAGAC CGCGAAGAGTTT
KANA_Stop_ne w_Kill_PacI_F
78 TATCCAGCCCTCACTCCTTCGTGGGAAGTTCCTA TTCTCTAGAAAGTATAGGAACTTCGGATCCGAAC AAACGACCCA
KANA-
NEW_25nt_add ed_R
93 GGTCGACCACTGTGCTGGCGAATTCGGCGCGC CGAAGTTCCTATACTTTCTAGAGAATAGGAACTT CAAGCTTACTTACCATGTCAGATCCAG
CD74-
NRG1_25nt_ad ded_LoxP
97 GGCGCGCCGAATTCGCCAGCACAGTGGTCGAC CATAACTTCGTATAGCATACATTATACGAAGTTAT CGCCGCCACCATGCACAGGAGGAGAAGCAG CD74-
NRG1_NEW_S ERCA_R
95 CGGCCGCTCTAGAACTAGTGGATCCCCCGGGAT AACTTCGTATAATGTATGCTATACGAAGTTATTTT ATTCTATTCAGGCAGAGACAGAAAGGG
3.7.2 Sequencing Primer (5’ to 3’):
Name length sequence
pBabe_F 20 CTTTATCCAGCCCTCAC
pBabe_R 20 CAAATCAACCACAAGCTGGA
Fig-ROS_1_R 20 CTCGCCCCATATACTTCAGC Fig-ROS_2_F 20 CAAATCAACCACAAGCTGGA Fig-ROS_2_R 20 ATCCACTTCAGGAGCCACAT Fig-ROS_3_F 20 TGACTTGAAACGACCAATGC Fig-ROS_3_R 20 CATCAGATGTGCCTCCTTCA Fig-ROS_4_F 19 CCAAGGAAGGGGTGACAGT Fig-ROS_4_R 20 GCTGGATAAGGCTGATGACC Fig-ROS_5_F 22 TGGTTGACCTTGTAGACCTGTG Fig-ROS_5_R 20 GGCATAGTTCAGGCCTTCAG Fig-ROS_6_F 24 CAGGACCAACTTCAGTTATTCAGA Fig-ROS_6_R 20 CTTGCCAGAAGGGCAGTAAG CD74-ROS_1F 20 CCCCTTGAACCTCCTCTTTC CD74-ROS_1R 19 ATCCGCATCTTGCTCACAG CD74-ROS_2F 19 AAGCCTGTGAGCAAGATGC CD74-ROS_2R 20 CAGCTCTTTGTCCTCGTTGA CD74-ROS_3F 20 GCGGCTGAAGAATCAGAAGT CD74-ROS_3R 20 CACAGGTCCACCAGATCCAC CD74-ROS_4F 20 TGTATCTGGAACGCATGCAC CD74-ROS_4R 20 CGAAGCTCTCATTGATCACG CD74-ROS_5F 20 GGCGTGATCAATGAGAGCTT CD74-ROS_5R 20 ACTTTCCACACCTGGTTGCT SLC-ROS_1F 20 CCAGTGTGGTGGTACGTAGG SLC-ROS_1R 20 TCTGGTTCTGCAGGTTGTTG SLC-ROS_2F 20 GCTGCCGGATCACCTACTAC SLC-ROS_2R 20 CCTTCTTCAGGGTTTTCACG SLC-ROS_3F 18 ACCGCCGTGGATATTCTG SLC-ROS_3R 20 GATCTCCCAGATCAGGATGC SLC-ROS_4F 20 CTGATGGACGGCATCTTCAC SLC-ROS_4R 19 GGGCCCTCAGACTTTTCCT SLC-ROS_5F 20 GCCCTGATGGAAACAAAGAA SLC-ROS_5R 20 CCACACCTGGTTGCTGACTA
CD74-NRG1_seq1_F 25 GCAGAATGCCACCAAGTATGGCAAC CD74-NRG1_seq1_R 25 GTTGCCATACTTGGTGGCATTCTGC
CD74-NRG1_seq2_F 24 CATCATGTGTGTGGTGGCCTACTG CD74-NRG1_seq3_F 24 GAAATGTCTCCACCCGTGTCCAGC
ErbB3_1R 20 ACAGCTTCTGCCATTGTCCT
ErbB3_2F 20 CCCTCAGGACACAGACTGCT
ErbB3_2R 20 TGTTGCTCGAGTCCACAGTC
ErbB3_3F 20 CCACATGCACAACTTCAGTG
ErbB3_4F 20 CGGGCTCTGATACTTGTGCT
ErbB3_5F 20 TCCCTGAGGGTGAATCAATC
ErbB3_6F 20 TGGTGTGACAGTTTGGGAGT
ErbB3_7F 20 GGAGTCTTGCCAGGAGTCTG
ErbB3_3R 20 TCGACAGGACAAGCACTGAC
ErbB3_4R 20 CGTTCCAAGTATCGCCTCAT
ErbB3_5R 20 AAATCTGCCACCTGAACCTG
ErbB3_6R 20 GTTGTCCTCCTCTGCTTCCA
ErbB3_7R 20 CCCAGGACAGAACTGAGACC
ErbB3_5'UTR_F 19 ATTTGCAACCTCCGCTGCC ErbB3_3'UTR_R 20 GGAAAAGGGGCTGGGACCTG ErbB2_5'UTR_F 19 AATGGCCAGGACAAACGCA ErbB2_3'UTR_R 20 AGCCATCTGGGAACTCAAGC
ErbB2_1R 19 GCGTCAGGCTCTGACAATC
ErbB2_2F 20 CCCAGCTCTTTGAGGACAAC
ErbB2_2R 19 GTCCCCATCAAAGCTCTCC
ErbB2_3F 20 GCCCTGGTCACCTACAACAC
ErbB2_3R 20 TGCCTGGCATTCACATACTC
ErbB2_4F 19 CTACTCGCTGACCCTGCAA
ErbB2_4R 20 AAGCACCTTCACCTTCCTCA
ErbB2_5F 20 CGGTGTGAAACCTGACCTCT
ErbB2_5R 19 ATCCACTTGATGGGCACCT
ErbB2_6F 20 AAGCATACGTGATGGCTGGT
ErbB2_6R 20 GCCACTCCTGGTAGATGAGC
ErbB2_7F 19 CCCCATCTGCACCATTGAT
ErbB2_7R 20 GGGTCCTGGTCCCAGTAATA
ErbB2_8F 20 TTTGATGGTGACCTGGGAAT
EGFR _1116_R 20 TGATGGAGGTGCAGTTTTTG EGFR _120_R 20 TGCCTTGGCAAACTTTCTTT EGFR _1266_F 20 GACCTCCATGCCTTTGAGAA EGFR _1609_R 20 CTGACATTCCGGCAAGAGAC EGFR _1760_F 20 CCAGTGTGCCCACTACATTG EGFR _2135_R 20 CCTCAAGAGAGCTTGGTTGG EGFR _2265_F 20 GAAGCAACATCTCCGAAAGC EGFR _2635_R 22 TGCATGGTATTCTTTCTCTTCC EGFR _2755_F 20 CCAAGCCATATGACGGAATC EGFR _3133_R 20 AGAGAGCTCAGGAGGGGAGT EGFR _3277_F 20 TCCTCCCAGTGCCTGAATAC EGFR _3608_R 20 TTCTGCATTTTCAGCTGTGG EGFR _608_R 20 ATTGGGACAGCTTGGATCAC
EGFR _752_F 19 GAGAGCGACTGCCTGGTCT EGFR_267_F 20 CAGGAGGTGGCTGGTTATGT
EGFR_81_F 18 GAGTCGGGCTCTGGAGGA
KRAS-cDNA-A-F 19 GGAGAGAGGCCTGCTGAAA KRAS-cDNA-A-R 21 TGGCAAATACACAAAGAAAGC KRAS-cDNA-B-F 20 TACAGTGCAATGAGGGACCA KRAS-cDNA-B-R 23 TGCTGATGTTTCAATAAAAGGAA KRAS-cDNA-C-F 23 GGAAATAAATGTGATTTGCCTTC KRAS-cDNA-C-R 22 CTAACAGTCTGCATGGAGCAGG SERCA-Stop_1F 20 CCTCGCTAGCATCTGTAGGG SERCA-Stop_1R 20 GCGTTGGCTACCCGTGATAT SERCA-Stop_2F 20 CATGGGTCACGACGAGATCC SERCA-Stop_2R 20 GCCCTGAATGAACTGCAGGA SERCA-Stop_3F 20 GTGCCCAGTCATAGCCGAAT SERCA-Stop_3R 20 GCCATATTTGGTGTCCCCGA SERCA-Stop_4F 20 GAAACCACCGTTGCCGTAAC SERCA-Stop_4R 24 GCCTCATCATCACTAGATGGCATT SERCA-Stop_5F 21 AGCAGTGGTGGAATGCCTTTA SERCA-
Stop_5R(IRES)
19 GGCGGAATTGGGGTACCCT SERCA-Stop_6F 20 CTCCCCCTGAACCTGAAACA
Table 2: List of primer sequences used for the conducted experiments.
3.8 Cell lines
Ba/F3 cells were a kind gift from Nikolas von Bubnoff. NIH-3T3 cells were purchased from the Deutsche Sammlung von Mikroorganismen und Zellkulturen (DSMZ). HEK293T, H322, H1395, H1563, H1568, HCC827, PC9 and SKBR-3 have been purchased from the American Type Culture Collection (ATCC). H3122 cells were a kind gift from Christine Lovly, MD, PhD.
NIH-3T3 cells were cultured in DMEM (Gibco) supplemented with 10% fetal calf serum (FCS) (Gibco) and 1% penicillin/streptomycin (PS) (Gibco) (≙
50units/ml penicillin; ≙ 50µg/ml streptomycin). Ba/F3 cells, HEK293T, H322, H1395, H1563, H1568, HCC827, PC9 and SKBR3 cells were cultured in RPMI (Gibco) supplemented with 10% FCS and 1% PS. All cells were grown in a humidified incubator at 37°C and 5% CO2. For passaging adherent cells were split at 80 – 90% confluence. Cells were washed with Phosphate Buffered Saline (PBS) (Gibco) and incubated in 0.25% Trypsin/EDTA (Gibco).