MBT and SRF
Refuse Derived Fuel –
A European Market Heading for Overcapacity
Mike Brown
1. Summary of current infrastructure ...365
2. Modelling future residual waste arisings ...367
3. Forecasting the UK’s future capacity requirements ...370
4. References ...373 During the last five years, the residual waste market has been transformed from one whose geography was largely defined by a country’s borders to one that has become truly European in nature. Increasing, and now significant, tonnages of refuse derived fuel (RDF) and solid recovered fuel (SRF) are moving across national boundaries. In the UK, for example, the export of RDF and SRF has grown from 250,000 tonnes per annum (tpa) in 2011 to 3.4 million tpa in 2015.
The rise of the export trade has tended to break the link between the waste each country produces and the amount of waste treatment infrastructure it can support. Some countries already have more treatment capacity than waste; and some of these are still building new facilities that will need to be fuelled by imports. Within this changing and complex environment, how much scope is there for further development of residual waste treatment facilities such as energy from waste (EfW) incinerators and mechanical and biological treatment plants in the UK and Northern Europe?
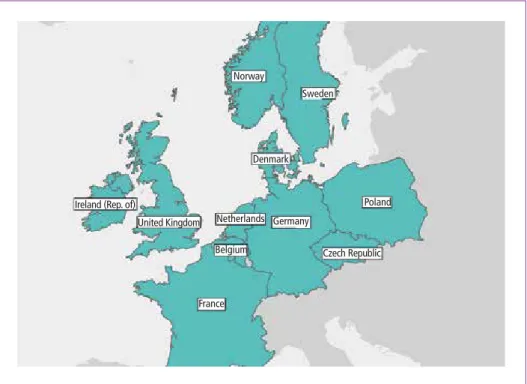
At Eunomia Research & Consulting Ltd., we have been keen observers of the emer- ging trends. Twice a year for the last five years, we have published a Residual Waste Infrastructure Review, looking at the current and future balance between the amount of residual waste being generated and the treatment capacity available to divert it from landfill. But where we have previously focused only on the UK, in the latest issue of the report – published in May 2016 – we decided that the changing shape of the market meant it was now necessary to consider the balance of supply and demand across much of Northern Europe, including:
• Ireland,
• The Netherlands,
• Germany,
• France,
• Belgium,
• Denmark,
• Sweden,
MBT and SRF
• Norway,
• Poland,
• Czech Republic and
• United Kingdom
All of these EU Member States are actively involved in trading RDF or SRF with others within the group and therefore form a natural cluster of countries in Northern Europe (the Northern Cluster).
Norway
Sweden
Denmark
Poland
Czech Republic Germany
Netherlands
France Belgium United Kingdom Ireland (Rep. of)
Figure 1: The Northern Cluster
The principal drivers of change in the residual waste market in these countries have been EU targets – the landfill diversion targets set by the Landfill Directive, and the targets for recycling – or preparation for reuse – of municipal solid waste (MSW) set by the Waste Framework Directive. Some Member States have advanced faster than others; for example, Belgium has achieved 55 percent recycling, while France is cur- rently languishing at 21 percent.
Beyond 2020, all Member States are beginning to consider how they will meet the targets held within the European Commission’s (the Commission) Circular Economy Package. [1] The recent legislative proposal includes a target for 65 percent recyc- ling – or preparation for reuse – by 2030, albeit one from which a number of Mem- ber States (not those in the Northern Cluster) would have a derogation until 2035.
Only one calculation method that can be used to assess compliance, compared with
MBT and SRF
the four available for the 50 percent target, and as a result the 2030 target will be con- siderably more demanding for some states to meet.
Looking across the Northern Cluster, is it foreseeable that at some point we will have sufficient treatment capacity to manage all the residual waste that is likely to arise?
Recent experience has proven that residual waste can travel cost-effectively, whilst evidence recently published by the RDF Industry Group demonstrates that carbon dioxide (CO2) emissions from transport are relatively insignificant when compared with those from wider waste processing activities.[2] It therefore makes sense to consider capacity and waste across the cluster as a whole.
Of course, where low-cost landfill continues to be available in Member States, this is likely to constrain the amount of waste that it is cost-effective to export. However, for either commercial or regulatory reasons, the supply of such landfill is likely to decline.
As this happens, it will become increasingly attractive to use existing dedicated EfW infrastructure in neighbouring countries, alongside other plant suitable for processing RDF or SRF, including industrial multi-fuel CHP facilities and cement kilns.
The analysis below presents an estimate of the current and future residual waste treat- ment capacity gap for the Northern Cluster. This relates to the tonnage of residual waste which is potentially available to operators or developers of new treatment facilities relative to the capacity potentially available in future.
The data presented throughout this article draws upon information held within Eunomia’s internal database, which is updated on an ongoing basis using a combina- tion of publicly available information and that provided to us by national governments and industry. It holds information on every residual treatment facility across Europe, including data on capacity and electrical output. Consistent international figures on residual waste arisings can be challenging to produce due to differences in reporting conventions and definitions – e.g. of MSW and C&I waste. Efforts to address these challenges mean that some data may vary from its presentation elsewhere.
1. Summary of current infrastructure
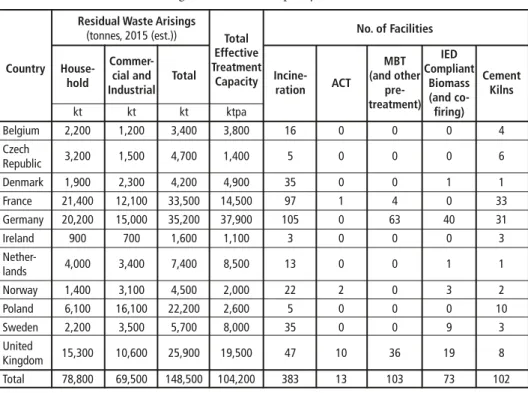
As detailed in Table 1, and shown in Figure 2, the key data for the Northern Cluster can be summarised as follows:
• Currently, the 11 countries of the Northern Cluster have a combined 104.2 million tpa of effective residual waste treatment capacity, either operating, under construction, or which is committed, i.e. has reached financial close;
• This capacity is made up of:
* 383 dedicated EfW incineration facilities;
* 13 Advanced Conversion Technology (ACT) facilities;
* 103 pre-treatment facilities – using either mechanical-biological treatment (MBT) or autoclave technologies;
MBT and SRF
* 73 Industrial Emissions Directive (IED) compliant biomass facilities, including facilities already co-firing residual waste and
* 102 cement kilns capable of processing solid recovered fuels (SRF).
• This includes considerable amounts of new capacity that is being developed.
Examples include Viridor’s 300 ktpa energy from waste (EfW) incineration plant in Oxwellmains, Scotland, Covanta’s 600 ktpa EfW incineration plant in Poolbeg, Dublin, and an additional 192 ktpa line at the Delfzijl facility in Holland.
• It excludes any non-committed treatment capacity – i.e. that which has not reached financial close or remains at the planning stage; – in practice, it is likely that some additional treatment capacity will be developed, beyond the currently committed level.
Table 1: Residual waste arisings and treatment capacity in Northern Cluster countries Residual Waste Arisings No. of Facilities (tonnes, 2015 (est.)) Total
Effective IED
Country House- Commer- Treatment MBT Compliant hold cial and
Total Capacity Incine- ACT (and other Biomass Cement
Industrial ration pre- (and co- Kilns
kt kt kt ktpa treatment)
firing) Belgium 2,200 1,200 3,400 3,800 16 0 0 0 4 Czech
Republic 3,200 1,500 4,700 1,400 5 0 0 0 6 Denmark 1,900 2,300 4,200 4,900 35 0 0 1 1 France 21,400 12,100 33,500 14,500 97 1 4 0 33 Germany 20,200 15,000 35,200 37,900 105 0 63 40 31 Ireland 900 700 1,600 1,100 3 0 0 0 3 Nether-
lands 4,000 3,400 7,400 8,500 13 0 0 1 1 Norway 1,400 3,100 4,500 2,000 22 2 0 3 2 Poland 6,100 16,100 22,200 2,600 5 0 0 0 10 Sweden 2,200 3,500 5,700 8,000 35 0 0 9 3 United
Kingdom 15,300 10,600 25,900 19,500 47 10 36 19 8 Total 78,800 69,500 148,500 104,200 383 13 103 73 102
Increasing tonnages of RDF and SRF are moving across Member State boundaries. In this context, whilst RDF from the Czech Republic is unlikely to be transported to Ireland, for example, it can readily (depending upon the gate fee) be sent for processing to an EFW plant in Germany. This would reduce the supply of German treatment capacity available for RDF from the Netherlands; and the most economical option might then be for this Dutch waste to be treated using surplus capacity in Sweden.
MBT and SRF
The Northern Cluster has been modelled as a closed system, excluding exports and imports of RDF to and from countries outside of this system. This approach will have resulted in a small over- or under-estimate of the capacity gap, but not one that affects the overall findings of the analysis. Eunomia plans to broaden the number of countries within the analysis in future issues of the report.
2. Modelling future residual waste arisings
To forecast waste arisings, both waste growth rates and recycling rates must be consi- dered. For the former, the rates presented in Table 2 have been applied across all the selected countries. The assumption is perhaps unlikely to be accurate for any individual country, but in aggregate represents a reasonable estimate for the Northern Cluster as a whole, based on the following rationale:
Household waste The countries with significant net outward migration are likely to see a fall in household waste arisings, and vice-versa – those with net inward migration are likely to see ari- sings grow. Based on the profile of the countries included in the Northern Cluster, this approach results in an overall increase in population and thus arisings;
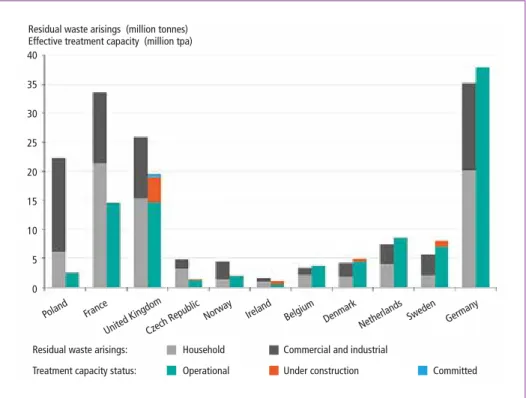
Figure 2: Residual waste arisings and effective treatment capacity in Northern Cluster countries
40 35 30 25 20 15 10 5 0
Residual waste arisings (million tonnes) Effective treatment capacity (million tpa)
Poland France United Kingdo
m Czech Republic
Norway Ireland
Belgium DenmarkNetherlands Sweden German y
Residual waste arisings: Household Commercial and industrial
Treatment capacity status: Operational Under construction Committed
MBT and SRF
Commercial waste
As per the above rationale and outcome with regard to household waste;
Industrial waste
As industrial activity is declining in some, yet increasing in other, Northern Cluster countries – compared with the baseline year, – it seems most sensible to assume that overall arisings remain flat.
In terms of recycling rate targets for household waste arisings, we have assumed that all countries meet the aforementioned 2020 (50 percent) and 2030 (65 percent) targets within the Waste Framework Directive and Circular Economy Package respectively.1
1 In achieving the 65 percent recycling rate target in the Circular Economy Package, Member States may be able include outputs from residual waste treatment process (e.g. captured metals from incinerator bottom ash)
Annual Waste Recycling Rates Achieved Waste Type Growth Rates 2020 2030
% % % Household 0.5 50 65 Commercial 0.5 65 75 Industrial 0.0 70 80
Table 2:
Waste growth and recycling rate assumptions
Modelling future residual waste treatment capacity
The estimate of treatment capacity looks only at facilities that are currently operational, under construction, or have reached financial close. This could be regarded as an under- estimate: there are likely to be both a significant number of facilities in earlier stages of development, as well as a range of new facilities which have not yet been announced.
We have assumed that no facilities will close over the time period to 2035, unless this has already been confirmed publicly by the operator. Our model therefore assumes that over time, all other facilities are either retrofitted or replaced with facilities of the same scale; a trend which we have observed for EfW facilities in recent years across Europe. In reality, however, the replacement facilities are generally of a larger capacity and therefore, this assumption could also be seen as an under-estimate of the levels of future capacity.
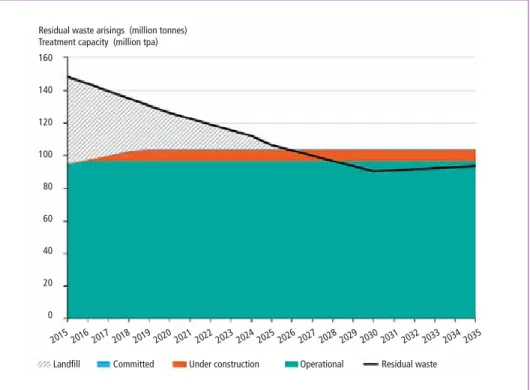
Putting together the above two main model inputs, future residual waste arisings and residual waste treatment capacity, determines the capacity gap for the Northern Clus- ter: how much residual waste is potentially available to operators or developers of new treatment facilities.
As shown in Figure 3, the results of the analysis suggest that, based on the above assump- tions the capacity gap will fall from the current level of 53 million tonnes to a situation of potential overcapacity from 2026 onwards.
The level of excess supply of treatment capacity then rises to 13.6 million tpa by 2030, there- after decreasing to 10.6 million tpa by 2035 as waste arisings grow while recycling levels off at 65 percent. If additional capacity, beyond that which is currently committed, is deve- loped, we may arrive at overcapacity earlier, and the level of excess supply may be greater.
MBT and SRF
Residual waste arisings (million tonnes) Treatment capacity (million tpa) 160
140 120 100 80 60 40 20 0
Landfill Committed Under construction Operational Residual waste 2015 2016 2017 2018 2019 2020 2021 2022 2023 2024 2025 2026 2027 2028 2029 2030 2031 2032 2033 2034 2035
Figure 3: Potential future residual waste capacity gap in Northern Cluster countries (2015 to 2035)
Figure 4: Residual waste arisings and treatment capacity in Northern Cluster countries (2015 to 2030)
Residual waste arisings (million tonnes) Effective treatment capacity (million tpa)
More waste than capacity More capacity than waste
40 35 30 25 20 15 10 5 0
Poland France
Czech Republi c
Norway Ireland Belgium Denmar k
Netherlands United Kingdom
Sweden Germany Residual waste arising: Household (2030) Commercial Modelled reduction
and industrial (2030) between 2015 and 2030
Treatment capacity status: Operational Under construction Committed
MBT and SRF
At the time of writing, some countries, such as Germany, Sweden, Denmark and the Netherlands, already have excess treatment capacity, as presented in Figure 4. Assuming that they do not close down plant, any further increase in their recycling rates – in res- ponse to current or future targets – will result in the further need to import RDF and SRF from abroad.
Some new and existing facilities will be confident of out-competing other plant in respect of gate fees. Even if the problem of excess capacity is recognised, developers of such plant may not be discouraged as they will expect to be able to source sufficient waste to meet their operating requirements. The emergence of greater price competition, however, will be a challenge for others, especially those operating at relatively high marginal cost.
This could result in some plant being forced to close prior to the end of their design-life.
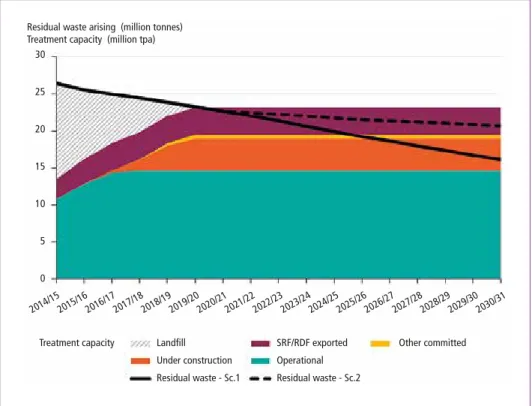
3. Forecasting the UK’s future capacity requirements
The UK’s position makes for an interesting example of how the combination of declining waste arisings, rapid expansion in the waste treatment sector and increases in export lead to a risk of excess capacity, which Eunomia has been warning of for several years.
As shown in Figure 5, the latest modelling indicates that, whether the UK reaches EU recycling targets or falls somewhat short of them, the capacity gap in the country is likely to decrease quickly and transition into overcapacity.
Residual waste arising (million tonnes) Treatment capacity (million tpa)
30
25
20
15
10
5
0
Treatment capacity Landfill SRF/RDF exported Other committed Under construction Operational
Residual waste - Sc.1 Residual waste - Sc.2
2014/152015/162016/172017/182018/192019/202020/212021/222022/232023/242024/252025/262026/272027/282028/292029/302030/31
Figure 5: Potential future residual waste capacity gap in the United Kingdom
MBT and SRF
The speed with which this change occurs depends on the amount of waste that the country produces. This in turn depends on our recycling rate. Figure 5 shows two scenarios. In both it is assumed that the UK meets the 2020 municipal waste recycling target of 50 percent – although slow progress in England in recent years means that this is by no means certain. After that, the scenarios diverge.
• In the first, EU targets are met, and high recycling is achieved in C&I waste ma- nagement.
• In the second scenario, progress is made, but ultimately the UK falls short of EU targets for municipal waste recycling, while C&I recycling rates stagnate post-2020.
The modelled recycling rates are detailed in Table 3.
2 Effective treatment capacity means capacity which has had the effect of pre-treatment facilities removed to avoid double-counting of available capacity
Scenario 1 Scenario 2 2020 2030 2020 2030
% % % % Household 50 65 50 60 Commercial 65 75 65 65 Industrial 70 80 70 70
Note: These recycling rates are those modelled for England and Northern Ireland only. Slightly higher household recycling rates are modelled for Scotland and Wales in line with national targets
Table 3:
Recycling assumptions for the two scenarios
Set against the assumptions on residual waste arisings, the treatment capacity consi- dered in the analysis is limited to plant that is operational, under construction, or has already reached financial close. At present, 4.9 million tpa of effective treatment capacity is under construction or committed.2 All other planned plant is excluded, although in practice a number of facilities are close to reaching this development stage and could ultimately be built.
In addition, it is conservatively assumed that RDF exports to other European countries will rise to 3.7 million tpa in 2016/17, while flat-lining thereafter. The UK is already a significant user of the international residual waste market. In 2015, the UK exported c.3.4 million tonnes for treatment in other European countries, up from c.2.6 million tonnes the previous year. Initial data published by the UK Environment Agency for the first three months of 2016 suggests a further increase is likely; indeed, the prospect of significant additional spare capacity across the Northern Cluster through the 2020s suggests that there may be scope for UK exports to grow still further.
The results for Scenario 1 suggest that the capacity gap between residual waste arisings and available treatment capacity will decrease from the current (based on 2014/15 arisings data) level of 12.9 million tonnes, and that the supply of capacity will exceed the available quantity of residual waste in the UK in 2020/21 – or in 2025/26 if the
MBT and SRF
export of RDF is excluded from the analysis.3 The level of excess supply of treatment rises to 7.1 million tonnes in 2030/31 – or 3.4 million tonnes if the export of RDF is excluded from the analysis.
Under Scenario 2, the results suggest that an excess of treatment again occurs in 2020/21 but thereafter rises less quickly, reaching 2.5 million tpa in 2030/31. If RDF exports are ignored, however, excess supply of residual waste treatment may not occur before 2030.
In making these predictions, it is important to recognise that not all infrastructure developments run smoothly. Growing doubts over the development of Air Products’
Tees Valley gasification facilities culminated in April of this year with the company announcing that the project was to be abandoned due to technical difficulties. Having previously applied a reduced probability weighting to the plant, Eunomia has now removed this plant’s capacity from the analysis completely.
Air Products’ travails have raised more questions about the feasibility of ACT tech- nologies as a treatment for residual waste. Eight ACT facilities either currently being built around the UK, or scheduled to begin construction soon, and several more are trying to reach financial close; there is continued interest in how they may fare. While the specific technologies being deployed at these facilities differs from that employed by Air Products, ACTs using residual waste as a feedstock appear not yet to have been fully proven.
And last, but certainly not least, the recent Brexit referendum decision in the UK injects a degree of uncertainty into future recycling projections. The vote occurred after the preparation of this analysis, and as yet it is too early to say with confidence whether the UK’s future relationship with the EU will be one that requires compliance with current and future directives on waste. However, it is probable that any agreement that gives the UK access to the single market would entail accepting laws of this kind.
Any implications for the export of RDF from the UK will also emerge gradually, but provided that the economic case for exports continues there is little reason to think there will be any insuperable legal impediment.
As Europe advances towards a more circular economy, it becomes ever more impor- tant to understand the implications this has for each country’s need for residual waste treatment. The investment required to develop each new plant is considerable, and the lifespan of a facility is typically 25 years or more. The choices that are made today will be with us far into the future, and could impede – or be overtaken by – developments that can already be foreseen. If we are to use our limited resources wisely we must en- sure that our infrastructure is tailored to meet the needs we are likely to have a decade or more from now, not just those that now face us.
3 Essentially, the residual waste treatment market has become a European one, so it seems unlikely that excluding RDF exports would be a sensible assumption. The most likely scenario for the repatriation of currently exported waste is one where UK prices for residual waste treatment fall, which might be expected to occur once UK treatment capacity exceeds the supply of residual waste, net of exports.
MBT and SRF
4. References
[1] European Commission: Proposal for a Directive of the European Parliament and of the Council Amending Directive 2008/98/EC on Waste, 2015/0275
[2] RDF Working Group: RDF Export: Analysis of the Legal, Economic and Environmental Rationa- les. August 2015, http://www.eunomia.co.uk/reports-tools/rdf-export-industry-group-report/
Inserat
Recycling
Magazin
Bibliografische Information der Deutschen Nationalbibliothek Die Deutsche Nationalbibliothek verzeichnet diese Publikation in der Deutschen Nationalbibliografie; detaillierte bibliografische Daten sind im Internet über http://dnb.dnb.de abrufbar
Thomé-Kozmiensky, K. J.; Thiel, S. (Eds.): Waste Management, Volume 6 – Waste-to-Energy –
ISBN 978-3-944310-29-9 TK Verlag Karl Thomé-Kozmiensky
Copyright: Professor Dr.-Ing. habil. Dr. h. c. Karl J. Thomé-Kozmiensky All rights reserved
Publisher: TK Verlag Karl Thomé-Kozmiensky • Neuruppin 2016
Editorial office: Professor Dr.-Ing. habil. Dr. h. c. Karl J. Thomé-Kozmiensky,
Dr.-Ing. Stephanie Thiel, M. Sc. Elisabeth Thomé-Kozmiensky, Janin Burbott-Seidel und Claudia Naumann-Deppe
Layout: Sandra Peters, Anne Kuhlo, Janin Burbott-Seidel, Claudia Naumann-Deppe, Ginette Teske, Gabi Spiegel und Cordula Müller
Printing: Universal Medien GmbH, Munich
This work is protected by copyright. The rights founded by this, particularly those of translation, reprinting, lecturing, extraction of illustrations and tables, broadcasting, micro- filming or reproduction by other means and storing in a retrieval system, remain reserved, even for exploitation only of excerpts. Reproduction of this work or of part of this work, also in individual cases, is only permissible within the limits of the legal provisions of the copyright law of the Federal Republic of Germany from 9 September 1965 in the currently valid revision. There is a fundamental duty to pay for this. Infringements are subject to the penal provisions of the copyright law.
The repeating of commonly used names, trade names, goods descriptions etc. in this work does not permit, even without specific mention, the assumption that such names are to be considered free under the terms of the law concerning goods descriptions and trade mark protection and can thus be used by anyone.
Should reference be made in this work, directly or indirectly, to laws, regulations or guide- lines, e.g. DIN, VDI, VDE, VGB, or these are quoted from, then the publisher cannot ac- cept any guarantee for correctness, completeness or currency. It is recommended to refer to the complete regulations or guidelines in their currently valid versions if required for ones own work.