MBT and SRF
Overview of Best Available Techniques for Mechanical Biological Treatment
of Residual Municipal Solid Waste
Ling He, Wolfgang Butz and Ketel Ketelsen 1. Current status of mechanical biological treatment
of residual municipal solid waste in Germany ...398
1.1. Legal requirements ...398
1.2. Development and current status of mechanical biological treatment plants in Germany ...400
1.2.1. Number and treatment capacities of MBT plants ...400
1.2.2. Material flow and energy consumption ...402
1.2.3. Emissions to air ...403
2. Best Available Techniques Reference Document for Waste Treatment and its conclusions for mechanical biological treatment of waste ...403
2.1. Review of the Best Available Techniques Reference Document for waste treatment ...404
2.2. Conclusions on Best Available Techniques for mechanical biological treatment of waste ...406
2.2.1. BAT conclusions for emissions to water ...407
2.2.2. BAT conclusions for emissions to air ...410
3. Further development of MBT in Germany ...411
4. Sources ...411
Driven by the EU Landfill Directive (Council Directive 1999/31/EC of 26 April 1999 on the landfill of waste), mechanical biological treatment (MBT) technology was developed in the 1990s as a pre-treatment step of waste before landfill. The main goals of this technology are the reduction of organic matter content in the waste and subsequently the reduction of waste volume sent to landfill. Since the landfill ban of untreated municipal solid wastes in 2005 in Germany, residual municipal solid wastes are treated either via MBT or through incineration. MBT technology has undergone since then constant development and becomes an established technology not only for the pre-treatment of waste, but also for the recycling of valuable materials such as metals and for the production of refuse derived fuel (RDF).
MBT and SRF
Best available techniques (BAT) for MBT in Europe were first documented in the Refer- ence Document of Best Available Techniques (BREF) for Waste Treatments Industries in 2006. Under the Directive 2010/75/EU of the European Parliament and the Council on industrial emissions (IED), this BREF was reviewed and updated between 2013 and 2018 by a European technical working group (TWG).
This paper gives an insight into the current status of MBT treatment of residual mu- nicipal solid waste in Germany and the major BAT conclusions relevant to the MBT technology. At the end, an ongoing study on the further development of MBT in Germany is briefly described.
1. Current status of mechanical biological treatment of residual municipal solid waste in Germany
The mechanical biological treatment (MBT) process combines mechanical sorting/
separation technologies and biological treatment processes, such as composting and anaerobic digestion. The exact process combination varies case by case and is deter- mined by a number of factors, for instance, the characteristics of input materials and the requirements on the final output materials/products. In general, MBT plants can be categorized into three different groups:
• MBT with composting (MBT C),
• MBT with anaerobic digestion (MBT AD), and
• mechanical biological stabilization with biological drying (MBS).
In addition, mechanical processes without biological steps, i.e. mechanical physical stabilization with thermal drying (MPS), are considered as MBT in a broad sense in Germany. It is, however, noteworthy that MPS plants are subject to legal requirements different from those of the three aforementioned groups.
1.1. Legal requirements
Quality standards and environmental regulations for the installation, the configuration and the operation of MBT plants (excluding MPS) were established in the Ordinance on Facilities for the Biological Treatment of Waste (30. BImSchV) in 2001. Accordingly, in areas with high emissions, such as areas of waste delivery, mechanical and biological treatment steps, contaminated waste air or gas shall be collected and purified before it is emitted into the air through a chimney. The combination of acid scrubber and thermal afterburning via regenerative thermal oxidizer (RTO) has proven to be state- of-the-art waste gas purification system for MBT. Additionally, biofilter can be used for the treatment of waste air with low pollutant concentrations.
Emission limit values for different air pollution parameters are specified in the 30. BImSchV and listed in the following Table 1.
MBT and SRF
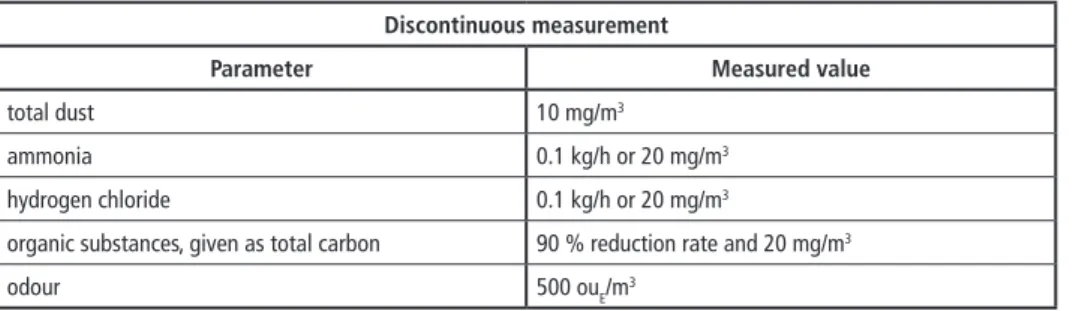
MPS plants are regulated by the German Technical Instructions on Air Quality Con- trol (TA Luft). Requirements on construction and operation of MPS plants are similar to those defined in the 30. BImSchV. Emission limit values for different air pollution parameters are listed in the following Table 2.
To reduce emissions to water, the waste delivery and storage areas as well as the me- chanical and biological treatment facilities shall be covered, enclosed or encapsulated such that rainfall shall not come into contact with waste or the treatment facilities.
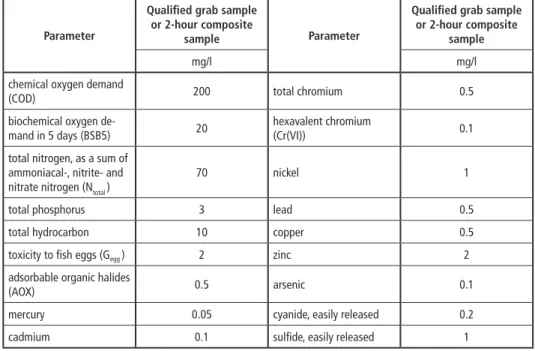
Process water originated from the biological treatment and the waste air/gas purifica- tion facilities shall be reused within the process to a large extent. Requirements on the wastewater before discharge are set out in the Annex 23 to the German Waste Water Ordinance (AbwV). Emissions limit values of water pollution parameters for direct discharge from MBT plants (excluding MPS) into water bodies are listed in the follow- ing Table 3. For indirect discharge, i.e. discharge to the sewer, only the emission limit values of AOX, heavy metals, easily released cyanide and sulphide shall be complied.
Table 2: Emission limit values of air pollution parameters for MPS plants
Discontinuous measurement
Parameter Measured value
total dust 10 mg/m3
ammonia 0.1 kg/h or 20 mg/m3
hydrogen chloride 0.1 kg/h or 20 mg/m3
organic substances, given as total carbon 90 % reduction rate and 20 mg/m3
odour 500 ouE/m3
Table 1: Emission limit values of air pollution parameters for MBT plants (excluding MPS) Continuous measurement
Parameter Daily Average Half-hourly Average Monthly Average (emission load per tonne
of treated waste)
mg/m3 g/t
total dust 10 30 –
organic substances, given as total
carbon 20 40 55
nitrous oxide – – 100
Discontinuous measurement
Parameter Measured value Average over the sampling period
odour 500 ouE/m3 –
dioxins and furans, given as cumulative value according to appendix to the 17. BImSchV [4]
– 0.1 ng/m3
MBT and SRF
MBT plants (excluding MPS) produce, inter alia, a stabilized output for disposal to landfill. The requirements on the output materials are specified in the Landfill Ordinance (DepV). Accordingly, the total carbon content of the stabilized output materials shall not exceed 18 %.
Table 3: Emission limit values of water pollution parameters for direct discharge from MBT plants (excluding MPS)
Parameter
Qualified grab sample or 2-hour composite
sample Parameter
Qualified grab sample or 2-hour composite
sample
mg/l mg/l
chemical oxygen demand
(COD) 200 total chromium 0.5
biochemical oxygen de-
mand in 5 days (BSB5) 20 hexavalent chromium
(Cr(VI)) 0.1
total nitrogen, as a sum of ammoniacal-, nitrite- and nitrate nitrogen (Ntotal )
70 nickel 1
total phosphorus 3 lead 0.5
total hydrocarbon 10 copper 0.5
toxicity to fish eggs (Gegg ) 2 zinc 2
adsorbable organic halides
(AOX) 0.5 arsenic 0.1
mercury 0.05 cyanide, easily released 0.2
cadmium 0.1 sulfide, easily released 1
1.2. Development and current status
of mechanical biological treatment plants in Germany
1.2.1. Number and treatment capacities of MBT plants
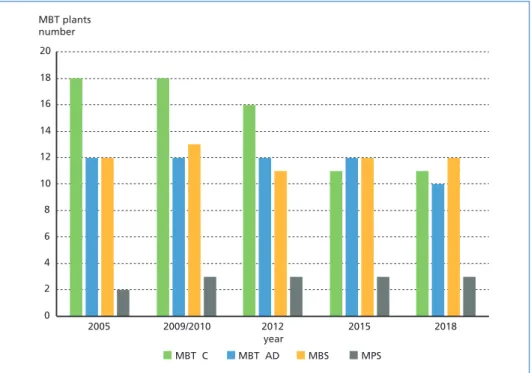
MBT plants in Germany undergo constant adjustment, which is mainly driven by market needs. There were 44 MBT plants with a total yearly treatment capacity of around 5.2 million tons in 2005. From 2005 to 2018, some of the MBT plants have been taken out of service or converted to solely mechanical treatment (MT) or biological treatment (BT) plants. Only organic waste are treated in the BT plants. In 2018, the total number of MBT plants has been reduced to 36, among which 11 MBT C, 10 MBT AD, 12 MBS and 3 MPS. Nevertheless, the total yearly treatment capacity adds up to around 4.8 million tons.
Figure 1 and 2 show the historical development of the number and the treatment capacities of MBT plants, respectively.
MBT and SRF Figure 1: Number of MBT plants in Germany
Figure 2: Treatment capacities of MBT plants in Germany
0 2 4 6 8 10 12 14 16 18 20
2005 2009/2010 2012 2015 2018
MBT plants number
year
MBT C MBT AD MBS MPS
0 0.5 1.0 1.5 2.0 2.5
2005 2009/2010 2012 2015 2018
Treatment capacities of MBT plants million tons/a
year
MBT C MBT AD MBS MPS
MBT and SRF
1.2.2. Material flow and energy consumption
The first MBT plants were developed with the aim of pretreating residual MSW before landfill. Over the years, MBT plants have become more resource efficient and contribute to the national recycling targets by sorting out recyclable materials such as metals, glass, plastics and paper from incoming waste. Additionally, biogas and RDF produced by MBT plants are used to substitute fossil fuels for the generation of electricity and heat.
An ongoing study [3] shows that, in 2015, MBT plants in Germany treated around 3.8 million tons of waste, from which
• 106,000 tons of ferrous and non-ferrous metals were recycled,
• approximately 50 million Nm3 biogas were generated, of which about 84.2 % was used for cogeneration and 9.2 % for energy supply to RTO, and
• around 2.1 million tons RDF were produced for waste-to-energy plants, cement plants, coal power plants and others.
In the same year, roughly 660,000 tons of treated waste were sent to landfill, marking a reduction of 35 % when compared to 2010.
The varied process combination of MBT plants leads to different consumption of elec- tricity and gas (natural gas, landfill gas or biogas). For instance, the average specific con- sumption of electricity in 2015 was estimated to be 63.9 kWh per ton of waste (kWh/t) for MPS plants, while 45.8 kWh/t for MBT C plants. And it is worth mentioning that the electricity consumption between facilities within one MBT group (MBT C, MBT AD, MBS or MPS) differs remarkably from each other. As an example, the electricity consumption of different MBS plants ranges from 20 kWh/t to 110 kWh/t. Some MBT plants have put continuous effort into the optimization of energy management sys- tems, operation modes and energy efficiency of equipment, through which significant reduction on the electricity consumption has been achieved.
Gas (natural gas, landfill gas or biogas) is required for energy supply to the drying of waste, RTO and anaerobic digestion. Among the four MBT groups (MBT C, MBT AD, MBS and MPS), MPS plants have the highest demand on gas. The average specific gas consumption in 2015 was 137 kWh/t for MPS plants, 34.6 kWh/t for MBT C plants, 26.0 kWh/t for MBT AD plants, and 25 kWh/t for MBS plants. Nonetheless, gas con- sumption in MPS plants decreases continuous in the last five years, mainly due to the reduced drying of waste. Regarding gas consumption of RTO, three configurations of the waste air/gas purification system have to be differentiated:
• only RTO (mainly applied in MBT AD plants),
• RTO and biofilter (mainly applied in MBT C plants), and
• RTO and bag filter (mainly applied in MBS and MPS plants).
The gas consumption of RTO depends on the amount of waste gas and its pollutant load. When only RTO is used for the waste air/gas purification, the specific gas con- sumption of RTO (about 49 to 56 kWh/t) is subsequently the highest among the three
MBT and SRF
aforementioned configurations. When the waste air/gas stream with lower pollutant load is diverted to a biofilter or a bag filter and RTO is only used to treat waste air/
gas stream with high pollutant load, the specific gas consumption can be significantly reduced. This is mainly due to the lower amount of waste gas sent to RTO and the higher heating value of the heavily polluted waste gas.
1.2.3. Emissions to air Emissions limit values of air pollution parameters given in Section 1.1. can be complied with proper waste air/gas purification systems. Concentrations of total dust, dioxins and total carbon are reported to be well below the limit values. For MBT C and MBT AD plants, the removal of ammonia using acid washers before RTO results in a yearly average load of N2O emission at 20 g per ton of waste. Purified gas existing RTO might have a higher odour concentration. It is currently under investigation if this is correlated to the NOx concentration in the waste gas.
2. Best Available Techniques Reference Document for Waste Treatment and its conclusions for mechanical biological treatment of waste
The Council Directive 96/61/EC of September 24, 1996 concerning integrated pol- lution prevention and control (the IPPC Directive) applied an integrated approach to the regulation of large industrial installations, which took into account the whole environmental performance including emissions to air, water and land. Accordingly, regulators must set permit conditions so as to achieve a high level of protection of the environment as a whole. The permit conditions including emission limit values must be based on Best Available Techniques (BAT). Under this directive, 33 Reference Docu- ments on Best Available Techniques (BREF) were drawn up as a result of information exchange between EU Member States and industries concerned under the direction of the European IPPC Bureau (EIPPCB) in Seville. The BREF for the Waste Treatments Industries was completed in 2006.
The IPPC Directive was codified in 2008 (Directive 2008/1/EC of the European Parlia- ment and of the Council of January 15, 2008 concerning integrated pollution prevention and control) and subsequently was repealed with effect from January 7, 2014 by Directive 2010/75/EU on industrial emissions (IED), which is a new directive recasting seven past directives, including the IPPC Directive. According to the IED, the aforemen- tioned information exchange shall take place between Member States, the industries concerned, non-governmental organizations promoting environmental protection and the Commission. A significant change compared to BREFs under the IPPC Directive is that the BREF documents under IED contain a chapter named BAT Conclusions, which lays down the conclusions on best available techniques, their description, infor- mation to assess their applicability, the emission levels associated with the best available techniques, associated monitoring, associated consumption levels and, where appropri- ate, relevant site remediation measures [2]. BAT conclusions will be published in the Official Journal of the European Union and thus become legally binding for industrial
MBT and SRF
installations listed in Annex I of the IED. Within four years after publication, competent authorities in the EU Member States shall ensure that a) all the permit conditions for the installation concerned are reconsidered and, if necessary, updated to ensure com- pliance with the corresponding BAT Conclusions, and b) the installation concerned complies with those permit conditions [2].
2.1. Review of the Best Available Techniques Reference Document for waste treatment
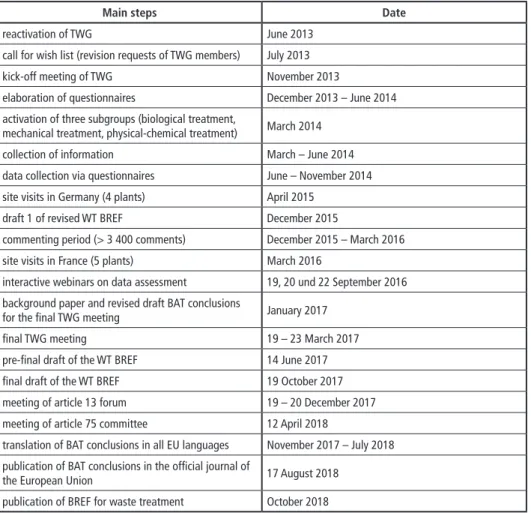
The review of BREF for the Waste Treatments Industries, renamed as BREF for Waste Treatment, started officially in June 2013 with the re-activation of the technical working group (TWG). The major steps of this review process are listed in the Table 4. It can be seen that, until the publication of the BAT Conclusions for Waste Treatment in the Official Journal of the European Union on August 10, 2018, this process lasted more than five years.
Table 4: Review process of the BREF for waste treatment
Main steps Date
reactivation of TWG June 2013
call for wish list (revision requests of TWG members) July 2013
kick-off meeting of TWG November 2013
elaboration of questionnaires December 2013 – June 2014 activation of three subgroups (biological treatment,
mechanical treatment, physical-chemical treatment) March 2014
collection of information March – June 2014
data collection via questionnaires June – November 2014 site visits in Germany (4 plants) April 2015
draft 1 of revised WT BREF December 2015
commenting period (> 3 400 comments) December 2015 – March 2016
site visits in France (5 plants) March 2016
interactive webinars on data assessment 19, 20 und 22 September 2016 background paper and revised draft BAT conclusions
for the final TWG meeting January 2017
final TWG meeting 19 – 23 March 2017
pre-final draft of the WT BREF 14 June 2017
final draft of the WT BREF 19 October 2017
meeting of article 13 forum 19 – 20 December 2017
meeting of article 75 committee 12 April 2018
translation of BAT conclusions in all EU languages November 2017 – July 2018 publication of BAT conclusions in the official journal of
the European Union 17 August 2018
publication of BREF for waste treatment October 2018
MBT and SRF
BAT reference documents and their BAT Conclusions are drawn up on the basis of the collected information including, among others, environmental performance and operational data. The main types of data required are outlined in the BREF guidance [1] and listed in the following:
• consumption (general information on consumption, consumption of raw and aux- iliary materials/feedstocks, water use and energy use),
• emissions to water,
• air emissions,
• residues/waste,
• other information (e.g. the year the installation was built and commissioned, the main operating conditions of the process or the different types of products manu- factured)
• reference information that must accompany emission data (general information such as emission source; monitoring; averages, ranges and distributions of emission values), and
• specific issues under the remit of each TWG.
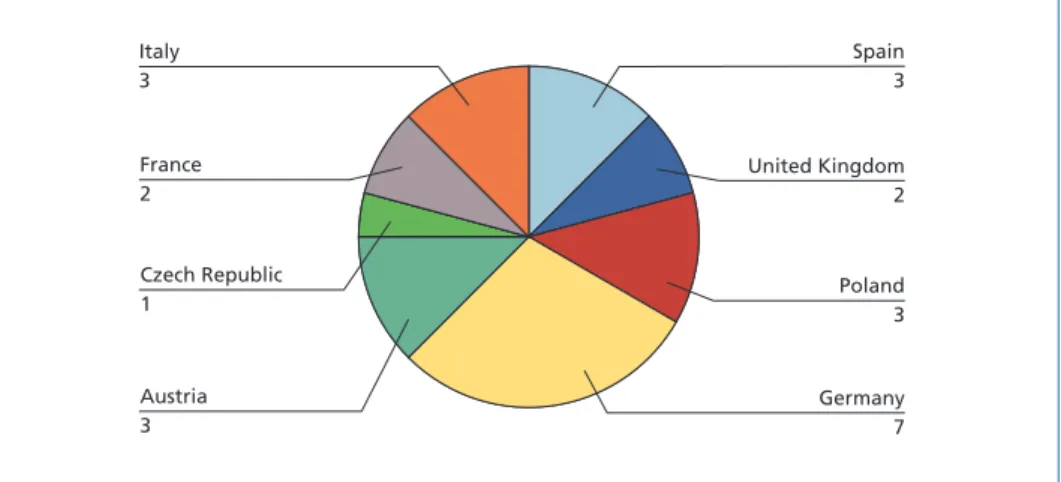
For the review of BREF for Waste Treatment, a questionnaire was elaborated by the TWG according to the aforementioned BREF guidance. This questionnaire was sent out to the operators of selected waste treatment facilities in Europe. At the end of the data collection period, 501 filled-in questionnaires from 338 waste treatment plants located in 18 EU Member States were submitted. For MBT plants (excluding MPS), a total of 21 filled-in questionnaires were collected, seven of which were from Germany. The origins of other filled-in questionnaires for MBT plants are shown in the following Figure 3.
Figure 3: Distribution of submitted filled-in questionnaires for MBT plants
Italy 3
France 2
Czech Republic 1
Austria 3
Spain 3
United Kingdom 2
Poland 3
Germany 7
MBT and SRF
The collected information and data were evaluated by the EIPPCB, particularly with regard to emissions to air and to water in correlation to the applied abatement techniques. Results of this evaluation served as a basis for the derivation of BAT and emission levels associated with the best available techniques (BAT AEL). BAT AEL means the range of emission levels obtained under normal operating conditions using a best available technique or a combination of best available techniques, as described in BAT conclusions, expressed as an average over a given period of time, under specified reference conditions [2].
2.2. Conclusions on Best Available Techniques for mechanical biological treatment of waste
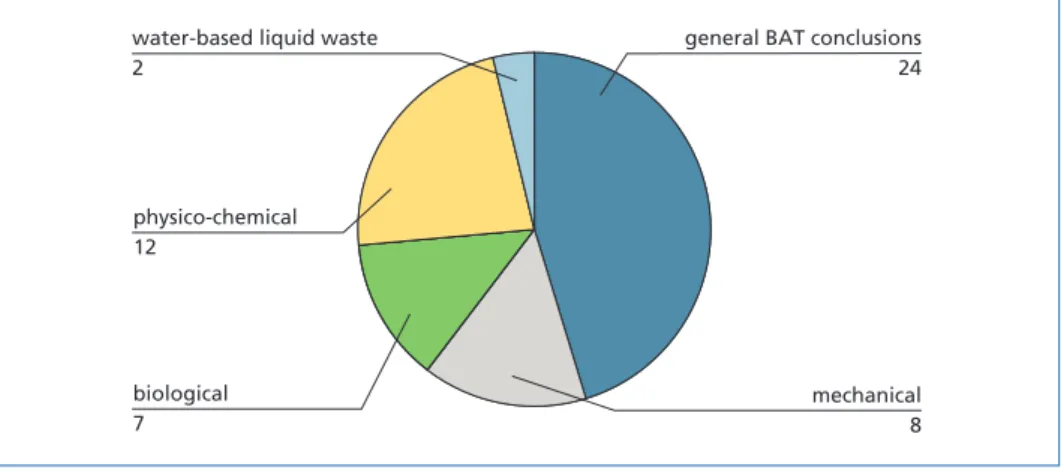
A total of 53 BAT conclusions are laid down in the Commission Implementing Decision (EU) 2018/1147 of August 10, 2018 establishing best available techniques (BAT) con- clusions for waste treatment. Nearly half of the BAT conclusions are general BAT con- clusion, which are applicable in all waste treatment facilities regardless of the treatment process. Nonetheless, applicability is given in some BAT conclusions, where restrictions apply. The distribution of the 53 BAT conclusions is shown in the following Figure 4.
Figure 4: Distribution of BAT conclusions
general BAT conclusions 24
mechanical 8 water-based liquid waste
2
physico-chemical 12
biological 7
BAT No. Content
General BAT conclusions
1 implement and adhere to an environmental management system (EMS) 2 techniques to improve the overall environmental performance of the plant 3 establish and maintain an inventory of waste water and waste gas stream 4 techniques to reduce the environmental risk associated with the storage of waste 5 set up and implement handling and transfer procedures
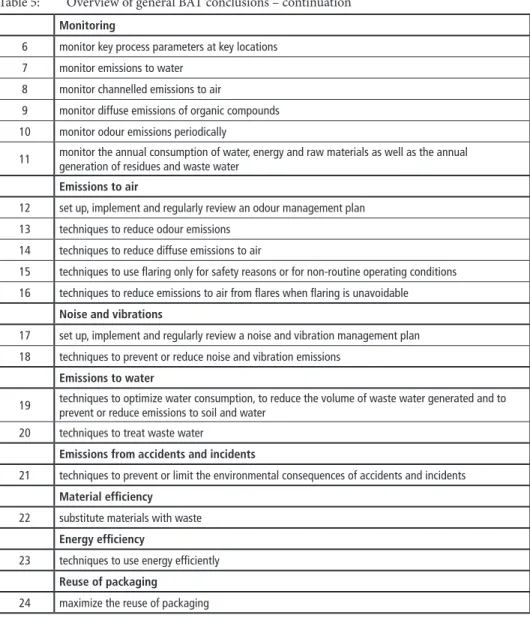
An overview of the 24 general BAT conclusions are provided in keywords in the Table 5.
Table 5: Overview of general BAT conclusions
MBT and SRF
2.2.1. BAT conclusions for emissions to water According to BAT 35, three techniques should be used in order to reduce the generation of waste water and to reduce water usage:
a) segregation of water streams, b) water recirculation, and
c) minimization of the generation of leachate.
While BAT 35 b) and c) have long become state of the art in Germany, effort will be required for the implementation of BAT 35 a).
BAT conclusions particularly relevant to MBT plants are BAT 7, 8, 20, 34, 35 and 39.
Monitoring
6 monitor key process parameters at key locations 7 monitor emissions to water
8 monitor channelled emissions to air
9 monitor diffuse emissions of organic compounds 10 monitor odour emissions periodically
11 monitor the annual consumption of water, energy and raw materials as well as the annual generation of residues and waste water
Emissions to air
12 set up, implement and regularly review an odour management plan 13 techniques to reduce odour emissions
14 techniques to reduce diffuse emissions to air
15 techniques to use flaring only for safety reasons or for non-routine operating conditions 16 techniques to reduce emissions to air from flares when flaring is unavoidable
Noise and vibrations
17 set up, implement and regularly review a noise and vibration management plan 18 techniques to prevent or reduce noise and vibration emissions
Emissions to water
19 techniques to optimize water consumption, to reduce the volume of waste water generated and to prevent or reduce emissions to soil and water
20 techniques to treat waste water
Emissions from accidents and incidents
21 techniques to prevent or limit the environmental consequences of accidents and incidents Material efficiency
22 substitute materials with waste Energy efficiency
23 techniques to use energy efficiently Reuse of packaging
24 maximize the reuse of packaging
Table 5: Overview of general BAT conclusions – continuation
MBT and SRF
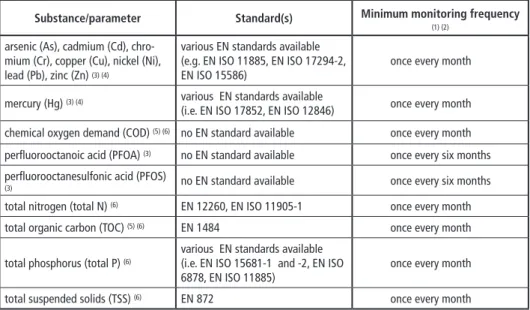
The monitoring requirements for emissions to water are defined in the BAT 7 and listed in the following Table 6.
Table 6: Monitoring requirements for emissions to water
Substance/parameter Standard(s) Minimum monitoring frequency
(1) (2)
arsenic (As), cadmium (Cd), chro- mium (Cr), copper (Cu), nickel (Ni), lead (Pb), zinc (Zn) (3) (4)
various EN standards available (e.g. EN ISO 11885, EN ISO 17294-2, EN ISO 15586)
once every month
mercury (Hg) (3) (4) various EN standards available
(i.e. EN ISO 17852, EN ISO 12846) once every month chemical oxygen demand (COD) (5) (6) no EN standard available once every month perfluorooctanoic acid (PFOA) (3) no EN standard available once every six months perfluorooctanesulfonic acid (PFOS)
(3) no EN standard available once every six months
total nitrogen (total N) (6) EN 12260, EN ISO 11905-1 once every month
total organic carbon (TOC) (5) (6) EN 1484 once every month
total phosphorus (total P) (6)
various EN standards available (i.e. EN ISO 15681-1 and -2, EN ISO
6878, EN ISO 11885) once every month
total suspended solids (TSS) (6) EN 872 once every month
(1) Monitoring frequencies may be reduced if the emission levels are proven to be sufficiently stable.
(2) In the case of batch discharge less frequent than the minimum monitoring frequency, monitoring is carried out once per batch.
(3) The monitoring only applies when the substance concerned is identified as relevant in the waste water inventory mentioned in BAT 3.
(4) In the case of an indirect discharge to a receiving water body, the monitoring frequency may be reduced if the downstream waste water treatment plant abates the pollutants concerned.
(5) Either TOC or COD is monitored. TOC is the preferred option, because its monitoring does not rely on the use of very toxic compounds.
(6) The monitoring applies only in the case of a direct discharge to a receiving water body.
Most of the listed substances have been regulated in the Annex 23 to the German Wastewater Ordinance. Monitoring of four parameters, i.e. PFOA, PFOS, TOC and TSS shall be added to the Annex 23.
Techniques for the treatment of waste water are provided in the BAT 20, which are sorted in the following groups:
• preliminary and primary treatment, such as equalization, neutralization and phys- ical separation,
• physico-chemical treatment, such as adsorption, distillation, precipitation, chem- ical oxidation, chemical reduction, evaporation, ion exchange and striping,
• biological treatment, such as activated sludge process and membrane bioreactor
• nitrogen removal, such as nitrification/denitrification, and
• solids removal, such as coagulation and flocculation, sedimentation, filtration and flotation.
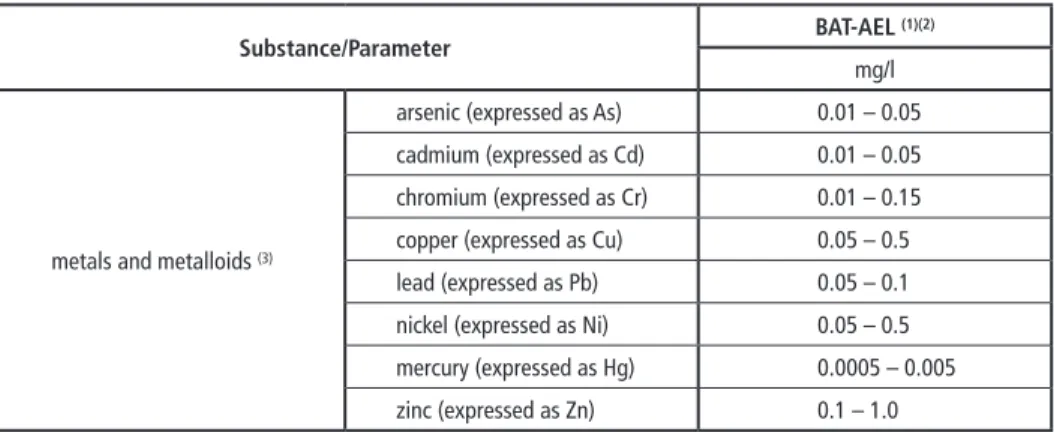
The BAT AELs for direct and indirect discharges to a receiving water body are also provided in the BAT 20 and listed in the following Table 7 and 8, respectively.
MBT and SRF
BAT AELs for metals and metalloids are more stringent when compared to the emis- sion limit values given in the Annex 23 to the German Wastewater Ordinance. The implementation of these BAT AELs in the Annex 23 is currently being discussed in a working group consisting representatives from federal states, German Environment Agency and federal government.
(1) The averaging periods are defined in the General considerations.
(2) Either the BAT-AEL for COD or the BAT-AEL for TOC applies. TOC monitoring is the preferred option because it does not rely on the use of very toxic compounds.
(3) The BAT-AEL may not apply when the temperature of the waste water is low (e.g. below 12° C).
(4) The BAT-AEL may not apply in the case of high chloride concentrations (e.g. above 10 g/l in the waste input).
(5) The BAT-AELs only apply when the substance concerned is identified as relevant in the waste water inventory mentioned in BAT 3.
Table 7: BAT-associated emission levels (BAT-AELs) for direct discharges to a receiving water body
Substance/Parameter BAT-AEL (1)
mg/l
total organic carbon (TOC) (2) 10 – 60
chemical oxygen demand (COD) (2) 30 – 180
total suspended solids (TSS) 5 – 60
total nitrogen (total N) 1 – 25 (3) (4)
total phosphorus (total P) 0.3 – 2
metals and metalloids (5)
arsenic (expressed as As) 0.01 – 0.05 cadmium (expressed as Cd) 0.01 – 0.05 chromium (expressed as Cr) 0.01 – 0.15
copper (expressed as Cu) 0.05 – 0.5
lead (expressed as Pb) 0.05 – 0.1
nickel (expressed as Ni) 0.05 – 0.5
mercury (expressed as Hg) 0.0005 – 0.005
zinc (expressed as Zn) 0.1 – 1.0
(1) The averaging periods are defined in the General considerations.
(2) The BAT-AELs may not apply if the downstream waste water treatment plant abates the pollutants concerned, provided this does not lead to a higher level of pollution in the environment.
(3) The BAT-AELs only apply when the substance concerned is identified as relevant in the waste water inventory mentioned in BAT 3.
Table 8: BAT-associated emission levels (BAT-AELs) for indirect discharges to a receiving water body
Substance/Parameter BAT-AEL (1)(2)
mg/l
metals and metalloids (3)
arsenic (expressed as As) 0.01 – 0.05 cadmium (expressed as Cd) 0.01 – 0.05 chromium (expressed as Cr) 0.01 – 0.15
copper (expressed as Cu) 0.05 – 0.5
lead (expressed as Pb) 0.05 – 0.1
nickel (expressed as Ni) 0.05 – 0.5
mercury (expressed as Hg) 0.0005 – 0.005
zinc (expressed as Zn) 0.1 – 1.0
MBT and SRF
2.2.2. BAT conclusions for emissions to air
BAT 39 specifies the following techniques for the reduction of emissions to air from MBT plants:
a) segregation of the waste gas streams, and b) recirculation of waste gas.
Both techniques have long been applied in practice in Germany. For instance, gas stream with low pollutant content is treated in a biofilter, while gas stream with high pollutant content is treated in a RTO.
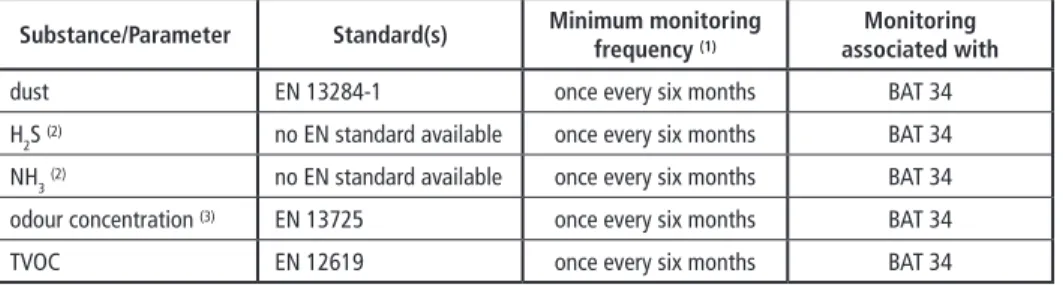
The monitoring requirements for channelled emissions to air are defined in the BAT 8 and listed in the following Table 9.
Table 9: Monitoring requirements for channelled emissions to air Substance/Parameter Standard(s) Minimum monitoring
frequency (1) Monitoring associated with
dust EN 13284-1 once every six months BAT 34
H2S (2) no EN standard available once every six months BAT 34
NH3(2) no EN standard available once every six months BAT 34
odour concentration (3) EN 13725 once every six months BAT 34
TVOC EN 12619 once every six months BAT 34
(1) Monitoring frequencies may be reduced if the emission levels are proven to be sufficiently stable.
(2) The odour concentration may be monitored instead.
(3) The monitoring of NH3 and H2S can be used as an alternative to the monitoring of the odour concentration.
According to BAT 34, one or a combination of the following techniques should be used to reduce channelled emissions to air of dust, organic compounds and odorous compounds, including H2S and NH3:
a) adsorption, b) biofilter, c) fabric filter,
d) thermal oxidation, and e) wet scrubbing.
The BAT AELs for channelled NH3, odour, dust and TVOC emissions to air are also provided in the BAT 34 and listed in the following Table 10.
The BAT AEL for dust is more stringent when compared to the emission limit value given in the 30. BImSchV (Table 1) or the TA Luft (Table 2). However, the upper range of this BAT AEL can be complied with a proper operation of fabric filter.
MBT and SRF
3. Further development of MBT in Germany
The mechanical biological treatment of residual municipal solid waste has contributed to a significant reduction of methane emission from landfill. In addition, MBT outputs such as recycled metals or RDF have been used to substitute primary raw materials and fossil fuels, thus preserving limited natural resources and playing a part in the circular economy. Nonetheless, there are still optimization potentials for the MBT technology in terms of resource and energy efficiency. For instance, the plant configuration can be optimized in respect of waste input, technical processes or other operation conditions.
In addition, the treatment process can be optimized to increase the quantity and quality of MBT outputs and to reduce the greenhouse gas emissions. The aforementioned as- pects are currently under investigation in an ongoing study supervised by the German Environment Agency [3]. Results of this study are expected in 2020.
4. Sources
[1] Commission Implementing Decision 2012/119/EU of 10 February 2012 laying down rules con- cerning guidance on the collection of data and on the drawing up of BAT reference documents and on their quality assurance referred to in Directive 2010/75/EU of the European Parliament and of the Council on industrial emissions, OJ L 63/1, 2.3.2012.
[2] European Union: Directive 2010/75/EU of the European Parliament and of the Council of 24 November 2010 on industrial emissions (integrated pollution prevention and control).
[3] Ketelsen, K.; Becker, G.: Weiterentwicklung der mechanisch-biologischen Abfallbehandlung (MBA) mit den Zielen der Optimierung der Ressourceneffizienz und Minimierung von Treib- hausemissionen. Interim report of a research project (FKZ 3717 34 331 0) funded by the Federal Ministry of the Environment, Nature Conservation and Nuclear Safety of Germany, 2019.
[4] 17th Ordinance on the incineration and co-incineration of waste (17. BImSchV)
Parameter Unit BAT-AEL
(Average over the sampling period)
NH3(1) mg/Nm3 0.3 – 20
odour concentration (1) ouE /Nm3 200 – 1,000
dust mg/Nm3 2 – 5
TVOC mg/Nm3 5 – 40 (2)
(1) Either the BAT-AEL for NH3 or the BAT-AEL for the odour concentration applies.
(2) The lower end of the range can be achieved by using thermal oxidation.
Table 10: BAT-associated emission levels (BAT-AELs) from MBT plants
MBT and SRF
Contact Person
Dr.-Ing. Ling He
German Environment Agency Research Officer
Section III 2.4 Waste Technology, Waste Technology Transfer Wörlitzer Platz 1
06844 Dessau-Roßlau GERMANY
+49 34021033374 ling.he@uba.de
Bibliografische Information der Deutschen Nationalbibliothek Die Deutsche Nationalbibliothek verzeichnet diese Publikation in der Deutschen Nationalbibliografie; detaillierte bibliografische Daten sind im Internet über http://dnb.dnb.de abrufbar
Thiel, S.; Thomé-Kozmiensky, E.; Winter, F.; Juchelková, D. (Eds.):
Waste Management, Volume 9 – Waste-to-Energy –
ISBN 978-3-944310-48-0 Thomé-Kozmiensky Verlag GmbH
Copyright: Elisabeth Thomé-Kozmiensky, M.Sc., Dr.-Ing. Stephanie Thiel All rights reserved
Publisher: Thomé-Kozmiensky Verlag GmbH • Neuruppin 2019 Editorial office: Dr.-Ing. Stephanie Thiel, Elisabeth Thomé-Kozmiensky, M.Sc.
Layout: Claudia Naumann-Deppe, Janin Burbott-Seidel, Sarah Pietsch, Ginette Teske, Roland Richter, Cordula Müller, Gabi Spiegel Printing: Universal Medien GmbH, Munich
This work is protected by copyright. The rights founded by this, particularly those of translation, reprinting, lecturing, extraction of illustrations and tables, broadcasting, micro- filming or reproduction by other means and storing in a retrieval system, remain reserved, even for exploitation only of excerpts. Reproduction of this work or of part of this work, also in individual cases, is only permissible within the limits of the legal provisions of the copyright law of the Federal Republic of Germany from 9 September 1965 in the currently valid revision. There is a fundamental duty to pay for this. Infringements are subject to the penal provisions of the copyright law.
The repeating of commonly used names, trade names, goods descriptions etc. in this work does not permit, even without specific mention, the assumption that such names are to be considered free under the terms of the law concerning goods descriptions and trade mark protection and can thus be used by anyone.
Should reference be made in this work, directly or indirectly, to laws, regulations or guide- lines, e.g. DIN, VDI, VDE, VGB, or these are quoted from, then the publisher cannot ac- cept any guarantee for correctness, completeness or currency. It is recommended to refer to the complete regulations or guidelines in their currently valid versions if required for ones own work.