Fires prime terrestrial organic carbon for riverine export to the global oceans
Matthew W. Jones
1✉ , Alysha I. Coppola
2,3, Cristina Santín
4,5, Thorsten Dittmar
6,7, Rudolf Jaffé
8, Stefan H. Doerr
4& Timothy A. Quine
9Black carbon (BC) is a recalcitrant form of organic carbon (OC) produced by landscape fires.
BC is an important component of the global carbon cycle because, compared to unburned biogenic OC, it is selectively conserved in terrestrial and oceanic pools. Here we show that the dissolved BC (DBC) content of dissolved OC (DOC) is twice greater in major (sub) tropical and high-latitude rivers than in major temperate rivers, with further signi fi cant dif- ferences between biomes. We estimate that rivers export 18 ± 4 Tg DBC year
−1globally and that, including particulate BC fl uxes, total riverine export amounts to 43 ± 15 Tg BC year
−1(12 ± 5% of the OC fl ux). While rivers export ~1% of the OC sequestered by terrestrial vegetation, our estimates suggest that 34 ± 26% of the BC produced by landscape fi res has an oceanic fate. Biogeochemical models require modi fi cation to account for the unique dynamics of BC and to predict the response of recalcitrant OC export to changing environ- mental conditions.
https://doi.org/10.1038/s41467-020-16576-z
OPEN
1Tyndall Centre for Climate Change Research, School of Environmental Sciences, University of East Anglia, Norwich, UK.2Department of Geography, University of Zurich, Zürich, Switzerland.3Geological Institute, Department of Earth Sciences, ETH Zürich, Sonneggstrasse 5, 8092, Zürich, Switzerland.
4Geography Department, College of Science, Swansea University, Swansea, UK.5Biosciences Department, College of Science, Swansea University, Swansea, UK.6Research Group for Marine Geochemistry (ICBM-MPI Bridging Group), Institute for Chemistry and Biology of the Marine Environment (ICBM), University of Oldenburg, Oldenburg, Germany.7Helmholtz Institute for Functional Marine Biodiversity (HIFMB), University of Oldenburg, Oldenburg, Germany.8Southeast Environmental Research Center and Department of Chemistry and Biochemistry, Florida International University, Miami, FL, USA.9Geography Department, College of Life and Environmental Science, University of Exeter, Exeter, UK.✉email:matthew.w.jones@uea.ac.uk
1234567890():,;
G lobally, terrestrial net primary production (NPP) seques- ters around 60 Pg C year−1from the atmosphere to stocks of organic carbon (OC) in biomass
1–3. The majority of this carbon returns to the atmosphere from the terrestrial bio- sphere over decadal timescales, through fire emissions, herbivory or by entering soils as dead organic matter and undergoing microbial decomposition
4–6. Only around 1% of terrestrial NPP is exported to the global oceans by rivers (300–800 Tg C year
−1)
7–9. Some fractions of the exported OC are bio-labile and thus drive coastal and marine food webs, while other major fractions are biologically recalcitrant and have potential for long-term storage in oceanic pools
10–15.
Black carbon (BC) is a quantitatively significant by-product of incomplete combustion of terrestrial OC. Around 40–215 Tg BC year
−1are generated by the incomplete combustion of biomass during landscape fires, forming a major component of residual charcoal and ash deposits (see “Methods”)
16. An additional 2–29 Tg BC year
−1are emitted as soot (aerosol) from landscape fires and fossil fuel combustion
17,18. The BC produced by landscape fires has three potential fates. First, it can be mineralised through biotic or abiotic processes
19,20, such as microbial decomposition or combustion during subsequent fires
21,22. Second, it can reach deep soil stores where its decomposition is exceptionally limited
23,24. Third, it can be exported to the global oceans as a fraction of riverine dissolved organic carbon (DOC) or particulate organic carbon (POC)
25,26.
BC is among the most recalcitrant forms of OC in the Earth System
27,28. Its poly-condensed aromatic molecular structure renders it relatively inaccessible to microbial organisms
19,20,29. Owing to its biological recalcitrance, BC accumulates in Earth’s major OC pools
27,28,30–32. Despite the annual production of BC equating to <0.5% of OC production by the terrestrial bio- sphere (~60 Pg C year
−1)
1–3and marine organisms (~13 Pg C year
−1)
2, BC constitutes ~5–18% of global soil OC stocks
33,
~2–5% of oceanic DOC stocks
34,35and ~5–30% of the OC in ocean sediments
27,36,37(Fig. 1). Estimates of the BC contribution to global oceanic DOC stocks do not differ substantially from estimates of the total terrigenous fraction of DOC (<5%)
14. Similarly, estimates of the BC contribution to the global stock of OC in oceanic sediments do not differ substantially from esti- mates of the terrigenous fraction of the total OC in oceanic seciments (approximately one-third)
36,38. Hence, a considerable fraction of the terrigenous OC stored in the global oceans is thought to have been altered by fire (Fig. 1). The residence time of oceanic BC stocks is on the order of millennia to tens of millennia
30,35,39,40, likely an order of magnitude longer than soil BC stocks (centuries to millennia)
19,20and multiple orders of magnitude longer than terrestrial OC (decades to centuries)
4–6. Hence, the production of BC and its subsequent export to the global oceans significantly extends the residence time of terrige- nous carbon in the Earth System.
Riverine dissolved black carbon (DBC) is chiefly a by-product of the decomposition of soil BC stocks, which are maintained by landscape fires and by small aerosol fluxes to the land surface
41,42(Fig. 1). Like OC more generally, the rate at which soil BC degrades is moderated by environmental factors, such as tem- perature, hydrology, soil characteristics (e.g. clay content, mineralogy and pH) and land use
33,42–45. Nonetheless, the dis- proportionate effect of these factors on rates of soil BC decom- position relative to bulk soil OC decomposition has been shown to drive variation in the DBC content of riverine DOC at regional scales
42,45. In addition, BC production is more concentrated in the tropics than the production of biogenic OC through NPP.
While ~50–60% of terrestrial NPP occurs in tropical forests and savannahs
1, ~80% of global BC production occurs in these biomes
16. These factors indicate that the catchment dynamics of
BC differ from those of unburned OC and promote the expec- tation of global-scale variability in the DBC content of riverine DOC. Nonetheless, Jaffé et al.
26previously identified a simple linear relationship between the concentrations of DBC and DOC in global rivers, which suggested that DBC constitutes ~10% of the global riverine flux of DOC. Deviations from the global average DBC content of DOC were observed in individual river catchments; however; deviance from the 10% average was low across the global sample of 109 observations (±1% in absolute terms, incorporating standard error of the regression coefficient errors)
26.
Here, using an extended global data set of 409 DBC and DOC concentration measurements (Supplementary Dataset)
26,42,43,45–56, we evaluate global-scale variability in the DBC content of riverine DOC across latitudes and biome boundaries and extrapolate these spatial patterns to estimate global riverine DBC export. Our data set incorporates 409 coupled measurements of DOC and DBC concentration in total, including 195 from 34 major rivers and 214 from 44 minor channels (Supplementary Table 1). The data set incorporates 300 new coupled measurements from 12 major rivers and 90 minor channels. Four hundred and five of the data points represent individual samples taken at a single time, while four of the data points represent the average of samples collected over multiple seasons. The data set includes 204 new samples from (sub)tropical rivers (<30° N/S), which is an important advance because ~90% of global BC production occurs in the (sub)tropics
16and because (sub)tropical rivers contribute ~60% of the total global DOC export flux (128 ± 20 Tg C year
−1of 205 ± 21 Tg C year
−1)
8. We combine our estimate for global DBC export with an existing estimate for particulate BC (PBC) export
25to calculate the total global export of BC by rivers.
Results and Discussion
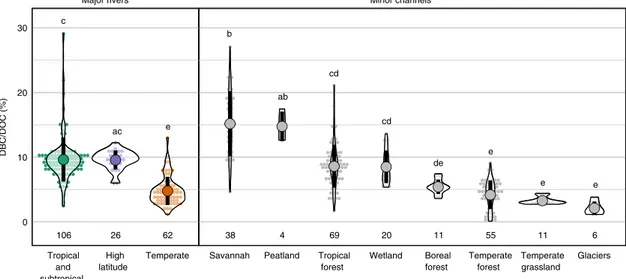
BC content of riverine DOC. Our data set reveals significant and structured global-scale variability in the DBC content of DOC, with tropical and high-latitude rivers exporting DBC in greater ratios than temperate ones. Significant latitudinal differences were observed between major rivers in different latitude ranges (Fig. 2;
Supplementary Table 1). The DBC content of DOC was, on average, twice greater in major (sub)tropical (9.7 ± 1.5%) and high-latitude rivers (9.6 ± 1.5%) than in major temperate rivers (4.6 ± 2.0%). The DBC content of DOC was also significantly greater in minor channels draining savannah (15.2 ± 5.0%) and peatland (14.8 ± 2.3%) than in channels draining tropical forest (8.6 ± 3.3%) and wetland (8.3 ± 2.7%) and in all of these channel classes when compared to channels draining temperate forest (4.4 ± 2.5%), temperate grassland (3.3 ± 0.6%) and glaciers (2.1 ± 1.0%). The DBC content of DOC in rivers draining boreal forest (5.4 ± 1.1%) was neither significantly lower than in channels draining tropical forest and wetland nor significantly greater than in channels draining temperate forest, temperate grassland and glaciers. These systematic differences in the DBC content of DOC demonstrate that the dynamics of BC and OC are not uniformly coupled across biomes and latitudes.
Differences in the average DBC content of DOC are greater
between minor channels spanning different biomes than in major
rivers spanning latitude bands (Fig. 2). Jaffé et al.
26previously
suggested that variability in the DBC content of DOC in minor
channels attenuates when integrating over large catchments, and
in support, our data set reveals some instances in which variation
in the DBC content of DOC in major rivers can be explained by
variability in the biome composition of their catchments. For
example, we identified a linear relationship between peatland
extent and the DBC content of DOC in the 6 major high-latitude
rivers included in our global data set (R
2= 0.68, p < 0.05;
Supplementary Fig. 1)
57. We suggest that this relationship occurs because the DOC in channels draining peatlands is enriched in DBC (14.8 ± 2.3%) relative to channels draining boreal forest (5.4 ± 1.1%) and glaciers (2.1 ± 1.0%) (Fig. 2).
Global riverine export of BC. Our estimate for the global export of DBC by rivers is 18.0 ± 3.9 Tg C year
−1. This estimate is lower
than that made previously by Jaffé et al.
26(26.5 ± 1.7 Tg C year
−1), which is principally because we used lower estimates for the global riverine flux of DOC that derive from a more recent meta- analysis of river discharge and DOC concentration data
8. Although our central estimate also suggests that DBC constitutes a smaller fraction of the global riverine DOC flux (8.8 ± 2.1% of 205 ± 21 Tg DOC year
−1)
8than that of Jaffé et al.
26(10.6 ± 0.7%
Vegetation OC
Atmosphere
Land
Fire emissions Herbivory
Dead biomass
Net primary production (NPP)
Root uptake
Root exudation
Soil pore water Soil OC DOC
BC
DBC Solubilisation
Adsorption Microbial
decomposition Stocks
Petagrams of Carbon (PgC)
Fluxes Teragrams of Carbon per year
(TgC/year) 10 PgC
100 TgC/year
10 TgC/year 500 PgC
PBC DBC
Oceanic POC
PBC
Oceanic DOC
DBC BC
Oceanic sediment OC
Terrigenous fraction Terrigenous
fraction
Terrigenous fraction
Terrigenous fractiongg BC
Ocean
Rivers & lakes
Solubilisation Adsorption Re-suspension
Deposition
Re-suspension
Deposition Solubilisation Adsorption
Microbial decomposition Photo-degradation
Microbial decomposition Photo- degradation D
BC production (incomplete combustion)
Mobilisation of solutes Erosion of particulates
Export of particulates
Export of solutes Atmospheric
CO2
Freshwater sediment OC
Riverine POC
Riverine DOC
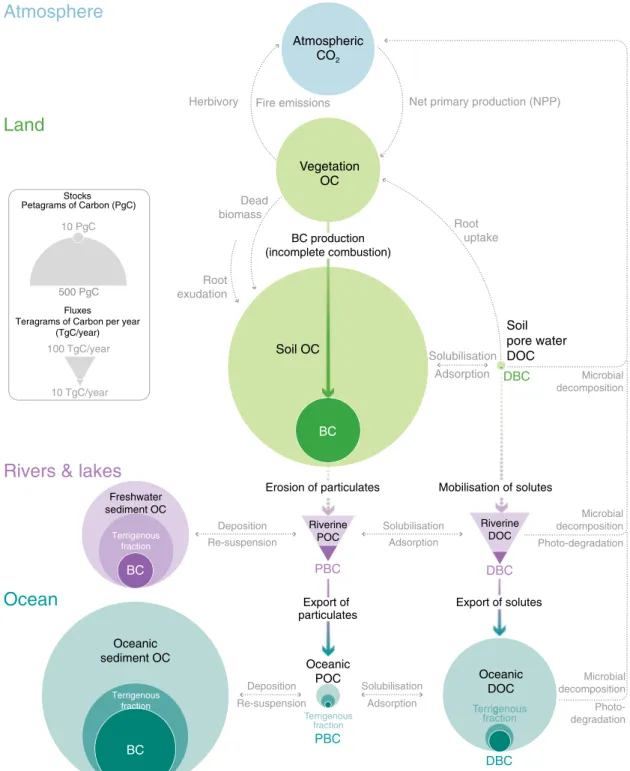
Fig. 1 Global dynamics of black carbon (BC) and organic carbon (OC).DOC dissolved organic carbon, DBC dissolved black carbon, POC particulate organic carbon, PBC particulate black carbon. The relative size of the stocks andfluxes of OC and BC in soils, sediments, dissolved organic matter and suspended particulates are indicated by the size of the circles (stocks) and triangles (fluxes). BC is selectively preserved across the land-to-ocean aquatic continuum and thus represents a large fraction of the terrigenous OC in ocean pools. Rivers are the primary source of oceanic BC, though small additional fluxes of aerosol BC (soot) to the ocean surface are not shown. The estimates for each stock andflux are provided in Supplementary Dataset along with references to source data.
of 250 Tg DOC year
−1)
38, this difference was not statistically significant.
Nonetheless, recognising that the DBC content of riverine DOC varies globally leads to a marked difference in the latitudinal distribution of DBC export. Using latitude-specific estimates for DOC export from Dai et al.
8and the distribution of the DBC content of DOC in major rivers (Fig. 2), we estimate that (sub) tropical rivers export 69 ± 26% of the total global riverine flux of DBC (12.4 ± 3.8 Tg C year
−1), while northern high-latitude rivers export 21 ± 6% (3.8 ± 0.6 Tg C year
−1) and temperate-latitude rivers just 10 ± 4% (1.8 ± 0.6 Tg C year
−1; Fig. 3; Supplementary Table 2). The large flux of DBC from (sub)tropical latitudes relates both to the large DOC export flux in this region (62 ± 12%
of the global DOC flux) and the relatively high contribution of DBC to riverine DOC exhibited by the rivers in this latitude range (Fig. 2; Supplementary Table 1). We find that the use of a single global relationship between DBC and DOC for the prediction of DBC export would result in a 54–75% (1.0–1.3 Tg C year
−1) overestimation of DBC export by temperate rivers, a 16–22%
(2.0–2.8 Tg C year
−1) underestimation of export by (sub)tropical rivers and a 10–15% underestimation of export by high-latitude rivers (Supplementary Table 2).
Our estimates account for the organic products of fire whose recalcitrance is considered to differ substantially from that of unburned vegetation (see “Methods”). We do not account for the export of other soluble products of low-temperature vegetation charring, such as levoglucosan, which have short residence times compared to those of the DBC and thus lesser significance for the oceanic storage of terrigenous carbon
58–60.
The data set on which our global export estimates are based captures global-scale spatial variability in the DBC content of riverine DOC. Our estimates do not explicitly consider the influence of hydrology and its seasonal variation on the DBC content of riverine DOC. The DBC content of riverine DOC was previously shown to vary across hydrological gradients in one river system; specifically, the Yellow River, where DBC content of DOC varied between 1% in winter and 13% in the high spring flow of 2015
52. Nonetheless, most studies have failed to identify significant seasonality in the DBC content of DOC, including in major high-latitude rivers
48, tropical rivers and temperate
catchments
51,56. Soil moisture, a proxy for seasonal hydrology, was also not found to be a significant driver of variability in the DBC content of DOC in tropical Brazilian rivers
42. We verified that the differences in the DBC content of DOC across latitudes and biomes are not due to bias in the timing of sample collection.
Such a bias could, in theory, influence the spatial variability that we observe across river classes if one river class disproportio- nately includes samples from periods with a high DBC content of DOC relative to other river classes. However, we found no evidence for significant variability in the DBC content of DOC across seasons within river classes collated at the global scale (Supplementary Fig. 2) and hence conclude that seasonality in the DBC content of DOC was insufficient to significantly bias the spatial differences between river classes that we observed in our data set.
By combining our global estimate for riverine DBC export with an existing estimate riverine PBC export (25
þ149Tg C year
−1)
25, we estimate that rivers export a total of 43 ± 15 Tg BC year
−1to the global oceans. This is equivalent to 12 ± 5% of total riverine OC export to the global oceans (362 ± 77 Tg C year
−1; see
“Methods”)
8,9. While the riverine export of OC amounts to just 0.6 ± 0.1% of the biogenic OC sequestered annually by terrestrial NPP (60 Pg C year
−1), the riverine export of BC amounts to 34 ± 26% of the BC produced annually by landscape fires (128 ± 84 Tg C year
−1; see “Methods”)
16,27. This comparison demonstrates that a considerably greater fraction of the BC produced by landscape fires has an oceanic fate than the unburned OC sequestered by terrestrial NPP.
The uncertainty range of our DBC export estimate represents our best estimate of 1σ uncertainty (i.e. we consider there to be a 68% likelihood of the export fluxes falling within the stated bounds; see “Methods”). The 1σ uncertainty of the DBC content of DOC is 35% in (sub)tropical samples, 43% in the temperate samples and 15% in high-latitude samples (Fig. 2). Meanwhile, the 1σ uncertainty of global DOC export fluxes is 16% for (sub) tropical rivers, 9% for temperate rivers and 8% for high-latitude samples (Supplementary Table 3). The moderately high uncer- tainty in the DBC content of DOC and the DOC export flux in the (sub)tropics, combined with the large contribution of tropical rivers to global DOC export, means that most of uncertainty in
Major rivers Minor channels
Tropical and subtropical
High latitude
Temperate Savannah Peatland Tropical forest
Wetland Boreal forest
Temperate forest
Temperate grassland
Glaciers 0
10 20 30
DBC/DOC (%)
ac c
e
106 26 62
e b
ab
e
e de
cd
cd
38 4 69 20 11 55 11 6
Fig. 2 Dissolved black carbon (DBC) content of dissolved organic carbon (DOC; %).Each observational value (see Supplementary Dataset) is marked as a small dot and classified by channel type. These observations are stacked horizontally as in a histogram with a grouping interval of 0.5%, while the violin plot marks the kernel probability density at the range of observed values. The mean and standard deviation of observed values are marked by a large dot and thick black line, respectively. The number of data points included in each channel class is also shown. Letters denote groups with statistically similar mean values according to Tukey honest significant difference (HSD) test.
the global DBC export flux derives from the (sub)tropical flux.
For our global estimate of total BC export, most of the global uncertainty derives from the existing estimate of PBC export, whose 1σ uncertainty exceeds 50%.
Recently, oceanic DBC was found to be ~6‰ enriched in δ
13C relative to riverine DBC, possibly indicating that there are significant non-pyrogenic sources of DBC to the global oceans
61. Hypothesised DBC sources may include: a biogenic source in ocean waters
61, a petrogenic source at the ocean bed or in coastal sediments (e.g. asphalt or aquifer brine)
40, and thermogenic matter from hydrothermal vents
62,63. We add that BC produced by the burning of plants with a C
4-type photosynthetic pathway would also be depleted in δ
13C and that it may enter the ocean DBC pool either via solubilisation of soil BC or exported PBC
64or by direct aerosol deposition to the ocean surface
65,66. As around 50% of pyrogenic carbon is produced in savannah environments
16and rivers draining savannahs are especially enriched in DBC (Fig. 2), the latter scenario does not seem unlikely. Moreover, it remains plausible that the isotopic fractionation occurs during the partial photo-degradation of DBC from terrigenous, pyrogenic sources
61. Photo-degradation is known to cause a 1–4.5‰ enrichment of freshwater DOC in δ
13C
67,68and DBC is considered to be particularly susceptible to photo-degradation
69; however, the effect of photo-degradation on the δ
13C of DBC is yet to be quantified. Future work should seek to discount these plausible sources of δ
13C-depleted pyrogenic DBC to the global oceans.
Environmental change and BC export. Over the past 20 years, a 24% net reduction in global burned area has been driven chiefly by the conversion of savannahs to agricultural land
70–72. None- theless, burned area has increased in forested regions with high
BC production rates per unit area, and thus global rates of BC production by landscape fires showed no trend in the past two decades
16. According to fire models, global burned area is likely to increase in the coming centuries, with this increase con- centrated in forests and in regions where the human capacity to suppress fire fails to keep pace with increasing ignition fre- quency
73–76. Through their control on the rates of BC input to soils and waters, these historical and future changes in global fire incidence may have cascading impacts on terrestrial BC stocks, the riverine export of BC and the placement of BC into oceanic storage.
Observations of riverine and oceanic BC have accumulated over the past two decades and represent a narrow snapshot in time relative to the residence time of BC in the Earth System. It is thus not feasible to detect trends in contribution of BC to the total fluxes of OC exported by rivers with the available data. Until a longer timeline of observational data becomes available, it will only be possible to quantify historical and future changes to BC export using models that reliably reproduce the spatial patterns of BC and OC export observed in the available snapshot. Process- based models are already used to investigate the effects of global climate and land use changes on the catchment dynamics of OC, including its riverine export
77–79, yet these have been under- utilised for the study of BC dynamics. Modelling of the processes leading to DBC export is especially needed because these processes disconnect the dynamics of BC from the physical mobility of sediments and are instead controlled by a range of interacting hydrological and biogeochemical factors that affect the solubilisation and lateral transfer of organic matter (Fig. 1)
42,59,77,78.
Until now, there has been little incentive to adapt process- based models to explicitly represent the riverine export of DBC
3.8 ± 0.6
1.4 ± 0.6
3.7 ± 1.3
8.7 ± 3.6
0.4 ± 0.2 60° N
30° N
30° S
60° S
180° 120° W 60° W 60° E 120° E
Minor channels Major rivers
(Sub)Tropical Tropical forest Savannah Temperate forest
Temperate grassland Glaciers Wetland Peatland Boreal forest Temperate
High latitude Xeric
180°
0°
0°
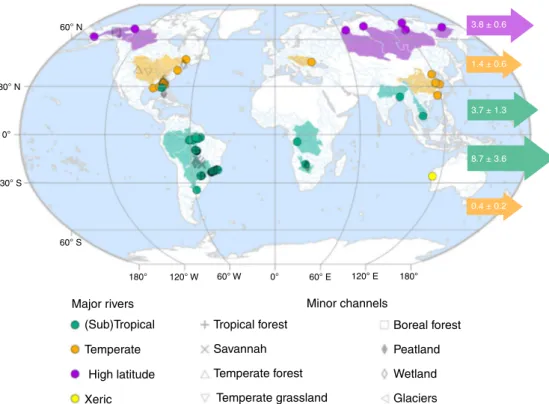
Fig. 3 Global map of the sampling locations represented by our global data set.Dissolved organic carbon (DOC) and dissolved black carbon (DBC) concentrations are available for each location (Supplementary Dataset). Sampling locations within major river systems, whose catchment areas exceed 10,000 km2(see“Methods”) are classified as (sub)tropical, temperate or high latitude according to the Freshwater Ecosystems of the World data set88. The catchment areas of these major rivers are also shown. One major xeric river system is represented in the data set but not used in the calculation of global DBC export. Minor channels draining specific biomes are classified as described in the primary literature. Horizontal arrows indicate the globalflux of DBC from each 30° latitude range (Tg C year−1).
because the DBC content of DOC has been considered constant with respect to fire regime and climate
26,59. If the DBC content of riverine DOC is consistent across spatial gradients of fire, climate and other environmental factors, then why should this be expected to respond to temporal changes in such factors? One major finding of our work is that the DBC content of DOC is spatially variable across environmental gradients, with the further implication that these variations are important to understanding historical and future changes in the DBC content of DOC. Our results highlight the pressing need to construct process-based models that explicitly account for the unique biogeochemical properties and dynamics of BC in river catchments and in the global oceans. This will enable prediction of the impact of changes in climate and fire regime on the source to sink dynamics of BC and the implications for net carbon exchange between the Earth’s surface and the atmosphere.
Methods
BC content of riverine DOC. The global data set of DBC and DOC measurements analysed here was extended from that of Jaffé et al.26, which included 109 data points from published43,49,50,80–82and unpublished sources. We added 300 new data points, including from Coppola et al.54(12 measurements), Jones et al.42(78 measurements), Bao et al.55(18 measurements), Roebuck et al.45(19 measure- ments), Roebuck et al.56(13 measurements), Marques et al.53(114 measurements), Wang et al.52(15 measurements), Wagner et al.51(30 measurements) and Man- nino and Harvey46(1 measurement).
The DBC concentration of all samples was measured using either the benzene polycarboxylic acid (BPCA) approach83or the chemo-thermal oxidation (CTO)84 approach (specific details are provided for each measurement in the Supplementary Dataset). These approaches are each widely employed in the measurement of BC in environmental samples from soils, sediments and aquatic solutions37,59,84,85. The BPCA approach detects a spectrum of aromatic moieties with varying degrees of poly-condensation, which are considered to be produced by the combustion of a wide range of fuels (e.g. woody and non-woody biomass, as well as fossil fuels) at a wide range of temperatures (~300–>1000 °C)84,86,87. Meanwhile, the CTO approach detects the most poly-condensed BC structures, which are typically associated with the BC produced in the form of soot or charcoal produced at particularly high temperatures37,84. Inter-comparisons of BC concentration measurements deriving from these techniques, among others, have been completed elsewhere (refs.84,85). The data set collated for the purpose of the current study is dominated by measurements obtained using the BPCA approach (393
measurements). Sixteen measurements were obtained by applying the CTO approach to samples from three major temperate rivers across two studies46,52. No significant difference was observed between the DBC content of DOC in these samples (4.6 ± 3.2%) and the 46 measurements obtained by 6 studies that applied the BPCA approach to samples from 7 other major temperate rivers (4.9 ± 1.7%).
As both the BPCA and CTO techniques quantify poly-condensed aromatic forms of‘pyrogenic’carbon in charcoal, soot and ash, we consider both to be valid methods for the quantification of the biologically recalcitrant BC that exhibits exceptional storage times in the aquatic pools. Therefore, we include measurements made using both approaches in our data set and suggest that inter-method variability in DBC measurements should be treated as one source of the uncertainty present in our statistical analysis of data distributions. On the other hand, we exclude one study that measured levoglucosan concentrations in riverine DOC58 on the basis that levoglucosan is a marker of low-temperature biomass charring and is bio-labile60; in contrast to poly-condensed aromatic carbon, this portion of the pyrogenic carbon continuum has low potential for long-term storage in aquatic systems59. While other approaches to quantifying poly-condensed aromatic carbon concentrations are available84,85, these are yet to be used to measure riverine DBC concentrations.
Measurements of DBC and DOC in samples from major rivers, whose catchment areas exceed 10,000 km2, were assigned to classes of the Freshwater Ecoregions of the World scheme88: polar freshwaters, temperate lowland, temperate upland & lowland, (sub)tropical lowland, (sub)tropical upland, (sub) tropical upland & lowland, xeric. The multiple temperate and (sub)tropical classes were grouped for the estimation of DBC export. For minor channels, the biome in which the study catchment occurred was adopted based on descriptions given in the primary studies or by cross-referencing sampling locations with a map of the Terrestrial Ecosystems of the World89.
OC export. The latitudinal DOC exportfluxes used in our calculation were as reported by Dai et al.8(205 ± 21 Tg C year−1, including 128 ± 20 Tg C year−1from tropical rivers, 38 ± 4 Tg C year−1from temperate rivers and 39 ± 3 Tg C year−1 from the high latitudes) and are based on global-scale extrapolation of DOC concentrations (mg L−1) in 118 world rivers and long-term average river discharge data from the world’s largest 925 exorheic rivers.
For the calculation of total OC exportfluxes, we summed existing global estimates of DOC export from Dai et al.8(205 ± 21 Tg C year−1) and POC export from Galy et al.9(157þ7450Tg C year−1). For the calculation of uncertainty in the total OC exportfluxes, we converted the nonparametric uncertainty in the POC exportflux to a synthetic normal distribution bounded by the largest difference between the median and the upper and lower quartiles (±74 Tg C year−1) and subsequently added the DOC and POCflux uncertainties in quadrature. We present the uncertainty in the total OCflux as a 1σuncertainty range (i.e. there is a 68% probability of the value falling within the stated range) but note that the lower bound is conservative. For the expression of the total OC exportflux as a fraction of the global terrestrial OC productionflux by NPP, our estimate of the total OC flux was divided by global terrestrial NPP (60 Pg C year−1; after Huston and Wolverton1), and uncertainties were computed in quadrature.
DBC export. Our estimate for global DBC export is based on the application of the average (±standard deviation) DBC content of DOC observed in major (sub)tro- pical, temperate and high-latitude rivers to the latitude-specific estimates of DOC export (ref.8; Supplementary Note 1). We opted for this approach, over the option offitting a global relationship between DBC and DOC concentrations, because we identified and avoided procedural challenges to thefitting of a simple linear regression model to this data set (Supplementary Note 1). Specifically, in order to force the residual errors of thefitted simple linear model conform to the assumption of heteroscedasticity, a measurement binning approach is required in which samples with similar DOC concentrations are grouped and the mean DOC and DBC concentration values of these groups are used as data points for statistical modelfitting (as in ref.26). This binning approach masks a portion of the variance present in the global data set of DOC and DBC concentrations and grants undue influence to samples from high-latitude rivers (Supplementary Note 1). To evaluate the sensitivity of DBC export estimates to method of calculation, we compare our estimate with that resulting from a different global DOCflux estimate and the model-fitting approach of Jaffé et al.26(Supplementary Note 2; Supplementary Tables 3–7; Supplementary Fig. 3).
We used only the observations of DBC content of riverine DOC in major rivers in our calculations of global DBC export, as opposed to all measurements of the DBC content of riverine DBC in all samples. An alternative approach would be to consider the biome composition of river catchments globally and to use this as a weighting for the central and uncertainty statistics representing the DBC content of riverine DOC in the rivers draining those biomes. We chose not to adopt the alternative approach on the basis that the distribution of sampling regions within biomes was generally restricted to small areas of the global extent of those biomes.
For example, the studies of minor channels draining tropical forests and savannahs are restricted to the continent of South America (Fig.3). In contrast, measurements from the major rivers have a global coverage in all latitude bands (Fig.3), and thus we consider these suitable for global-scale extrapolation.
To calculate uncertainty in latitudinal DBC exportfluxes, uncertainties in DOC exportfluxes and the DBC content of DOC are multiplied in quadrature and represent a 1σuncertainty estimate. The uncertainty in global DBC exportfluxes is calculated by summing the 1σuncertainties in DBC export from tropical, temperate and high latitudes in quadrature.
Total BC export. For calculation of total BC exportfluxes, we summed our global estimate of DBC export and the previously published estimate of PBC export of Coppola et al.25(25þ149 Tg C year−1). The uncertainty range of the PBC export estimate was increased slightly to account for variability in the PBC content of POC reported by Coppola et al.25in addition to the uncertainty in the global POC export flux as presented by Galy et al.9(157þ7450Tg C year−1). For the calculation of uncertainty in the total OC exportfluxes, we converted the nonparametric uncertainty in the PBC exportflux to a synthetic normal distribution bounded by the largest difference between the median and the upper and lower quartiles (±14 Tg C year−1), subsequently added the DBC and PBCflux uncertainties in quad- rature. We present the uncertainty in the total BC exportflux as a 1σuncertainty range, but note that the lower bound is conservative. For the expression of the total BC exportflux as a fraction of the global terrestrial BC production by landscape fires, our estimate for the total BC exportflux was divided by our global BC production estimate (based on Jones et al.16; see below), and uncertainties were computed in quadrature.
BC production by landscapefires. Our estimate for the global BC production by landscapefires is based on the pyrogenic carbon production estimates of Jones et al.16(256þ8460Tg C year−1). First, we converted the nonparametric uncertainty in the global pyrogenic carbon production by landscapefires to a synthetic normal distribution bounded by the largest difference between the median and the upper and lower quartiles (±84 Tg C year−1). We present the uncertainty in the total pyrogenic carbon productionflux as a 1σuncertainty range, but note that the lower bound is conservative. Second, we calculated the global BC productionflux as the product of the pyrogenic carbon production estimates and the BC content of pyrogenic carbon produced at a temperature range of 400–600 °C (50 ± 30%) as presented by Bird et al.27. For the uncertainty in global BC production, the 1σ
uncertainties in the pyrogenic carbon productionflux and the BC content of pyrogenic carbon were multiplied in quadrature.
Data availability
The data set analysed and discussed in this article is provided as a Supplementary Dataset (SUPPLEMENTARY_DATASET.xlsx).
Received: 7 January 2020; Accepted: 6 May 2020;
References
1. Huston, M. A. & Wolverton, S. The global distribution of net primary production: resolving the paradox.Ecol. Monogr.79, 343–377 (2009).
2. Ciais, P. et al. Carbon and other biogeochemical cycles. inClimate Change 2013: The Physical Science Basis. Contribution of Working Group I to the Fifth Assessment Report of the Intergovernmental Panel on Climate Change(ed.
Intergovernmental Panel on Climate Change) 465–570 (Cambridge University Press, 2013).
3. Friedlingstein, P. et al. Global carbon budget 2019.Earth Syst. Sci. Data11, 1783–1838 (2019).
4. Burd, A. B. et al. Terrestrial and marine perspectives on modeling organic matter degradation pathways.Glob. Chang. Biol.22, 121–136 (2016).
5. Sierra, C. A., Müller, M., Metzler, H., Manzoni, S. & Trumbore, S. E. The muddle of ages, turnover, transit, and residence times in the carbon cycle.
Glob. Chang. Biol.23, 1763–1773 (2017).
6. Carvalhais, N. et al. Global covariation of carbon turnover times with climate in terrestrial ecosystems.Nature514, 213–217 (2014).
7. Resplandy, L. et al. Revision of global carbonfluxes based on a reassessment of oceanic and riverine carbon transport.Nat. Geosci.11, 504–509 (2018).
8. Dai, M., Yin, Z., Meng, F., Liu, Q. & Cai, W.-J. Spatial distribution of riverine DOC inputs to the ocean: an updated global synthesis.Curr. Opin. Environ.
Sustain.4, 170–178 (2012).
9. Galy, V., Peucker-Ehrenbrink, B. & Eglinton, T. Global carbon export from the terrestrial biosphere controlled by erosion.Nature521, 204–207 (2015).
10. Regnier, P. et al. Anthropogenic perturbation of the carbonfluxes from land to ocean.Nat. Geosci.6, 597–607 (2013).
11. Bianchi, T. S. The role of terrestrially derived organic carbon in the coastal ocean: A changing paradigm and the priming effect.Proc. Natl Acad. Sci. USA 108, 19473–19481 (2011).
12. Stubbins, A. & Dittmar, T. InTreatise on Geochemistry(eds Holland, H. D. &
Turekian, K. K.) 25–156 (Elsevier, 2014).
13. Ward, N. D. et al. Where carbon goes when waterflows: carbon cycling across the aquatic continuum.Front. Mar. Sci.4, 1–27 (2017).
14. Opsahl, S. & Benner, R. Distribution and cycling of terrigenous dissolved organic matter in the ocean.Nature386, 480–482 (1997).
15. Burdige, D. J. Burial of terrestrial organic matter in marine sediments: a re- assessment.Glob. Biogeochem. Cycles19, 1–7 (2005).
16. Jones, M. W., Santín, C., van der Werf, G. R. & Doerr, S. H. Globalfire emissions buffered by the production of pyrogenic carbon.Nat. Geosci.12, 742–747 (2019).
17. Bond, T. C. et al. Bounding the role of black carbon in the climate system: a scientific assessment.J. Geophys. Res. Atmos.118, 5380–5552 (2013).
18. van der Werf, G. R. et al. Globalfire emissions estimates during 1997–2016.
Earth Syst. Sci. Data9, 697–720 (2017).
19. Kuzyakov, Y., Bogomolova, I. & Glaser, B. Biochar stability in soil:
decomposition during eight years and transformation as assessed by compound-specific 14C analysis.Soil Biol. Biochem.70, 229–236 (2014).
20. Singh, N., Abiven, S., Torn, M. S. & Schmidt, M. W. I. Fire-derived organic carbon in soil turns over on a centennial scale.Biogeosciences9, 2847–2857 (2012).
21. Santín, C., Doerr, S. H., Preston, C. & Bryant, R. Consumption of residual pyrogenic carbon by wildfire.Int. J. Wildl. Fire22, 1072–1077 (2013).
22. Doerr, S. H., Santín, C., Merino, A., Belcher, C. M. & Baxter, G. Fire as a removal mechanism of pyrogenic carbon from the environment: effects offire and pyrogenic carbon characteristics.Front. Earth Sci.6, 1–13 (2018).
23. Koele, N. et al. Amazon Basin forest pyrogenic carbon stocks:first estimate of deep storage.Geoderma306, 237–243 (2017).
24. Czimczik, C. I. & Masiello, C. A. Controls on black carbon storage in soils.
Glob. Biogeochem. Cycleshttps://doi.org/10.1029/2006GB002798(2007).
25. Coppola, A. I. et al. Global-scale evidence for the refractory nature of riverine black carbon.Nat. Geosci.11, 584–588 (2018).
26. Jaffe, R. et al. Global charcoal mobilization from soils via dissolution and riverine transport to the oceans.Science340, 345–347 (2013).
27. Bird, M. I., Wynn, J. G., Saiz, G., Wurster, C. M. & McBeath, A. The pyrogenic carbon cycle.Annu. Rev. Earth Planet Sci.43, 273–298 (2015).
28. Santín, C. et al. Towards a global assessment of pyrogenic carbon from vegetationfires.Glob. Chang. Biol.22, 76–91 (2016).
29. Hockaday, W., Grannas, A., Kim, S. & Hatcher, P. Direct molecular evidence for the degradation and mobility of black carbon in soils from ultrahigh- resolution mass spectral analysis of dissolved organic matter from afire- impacted forest soil.Org. Geochem.37, 501–510 (2006).
30. Masiello, C. A. & Druffel, E. R. M. Black carbon in deep-sea sediments.Science 280, 1911–1913 (1998).
31. Masiello, C. A. & Druffel, E. R. M. Carbon isotope geochemistry of the Santa Clara River.Glob. Biogeochem. Cycles15, 407–416 (2001).
32. Schmidt, M. W. I. et al. Persistence of soil organic matter as an ecosystem property.Nature478, 49–56 (2011).
33. Reisser, M., Purves, R. S., Schmidt, M. W. I. & Abiven, S. Pyrogenic carbon in soils: a literature-based inventory and a global estimation of its content in soil organic carbon and stocks.Front. Earth Sci.4, 1–14 (2016).
34. Dittmar, T. & Paeng, J. A heat-induced molecular signature in marine dissolved organic matter.Nat. Geosci.2, 175–179 (2009).
35. Coppola, A. I. & Druffel, E. R. M. Cycling of black carbon in the ocean.
Geophys. Res. Lett.43, 4477–4482 (2016).
36. Burdige, D. J. Preservation of organic matter in marine sediments: controls, mechanisms, and an imbalance in sediment organic carbon budgets?Chem.
Rev.107, 467–485 (2007).
37. Mitra, S., Zimmerman, A. R., Hunsinger, G. & Woerner, W. R. In Biogeochemical Dynamics at Major River-Coastal Interfaces(eds Bianchi, T., Allison, M. & Cai, W.-J.) 200–234 (Cambridge University Press, 2014).
38. Hedges, J. I., Keil, R. G. & Benner, R. What happens to terrestrial organic matter in the ocean?Org. Geochem.27, 195–212 (1997).
39. Coppola, A. I., Ziolkowski, L. A., Masiello, C. A. & Druffel, E. R. M. Aged black carbon in marine sediments and sinking particles.Geophys. Res. Lett.41, 2427–2433 (2014).
40. Ziolkowski, L. A. & Druffel, E. R. M. Aged black carbon identified in marine dissolved organic carbon.Geophys. Res. Lett.37, 4–7 (2010).
41. Jones, M. W. et al. Do regional aerosols contribute to the riverine export of dissolved black carbon?J. Geophys. Res. Biogeosciences122, 2925–2938 (2017).
42. Jones, M. W. et al. Environmental controls on the riverine export of dissolved black carbon.Glob. Biogeochem. Cycleshttps://doi.org/10.1029/2018GB006140 (2019).
43. Dittmar, T. et al. Continuousflux of dissolved black carbon from a vanished tropical forest biome.Nat. Geosci.5, 618–622 (2012).
44. Cheng, C. H., Lehmann, J., Thies, J. E. & Burton, S. D. Stability of black carbon in soils across a climatic gradient.J. Geophys. Res. Biogeosci.113, 1–10 (2008).
45. Roebuck, J. A., Seidel, M., Dittmar, T. & Jaffe, R. Land use controls on the spatial variability of dissolved black carbon in a subtropical watershed.
Environ. Sci. Technol.https://doi.org/10.1021/acs.est.8b00190(2018).
46. Mannino, A. & Harvey, H. R. Black carbon in estuarine and coastal ocean dissolved organic matter.Limnol. Oceanogr.49, 735–740 (2004).
47. Riedel, T. et al. Molecular signatures of biogeochemical transformations in dissolved organic matter from ten world rivers.Front. Earth Sci.4, 1–16 (2016).
48. Stubbins, A. et al. Utilizing colored dissolved organic matter to derive dissolved black carbon export by arctic rivers.Front. Earth Sci.3, 1–11 (2015).
49. Dittmar, T., Paeng, J., Gihring, T. M., Suryaputra, I. G. N. A. & Huettel, M.
Discharge of dissolved black carbon from afire-affected intertidal system.
Limnol. Oceanogr.57, 1171–1181 (2012).
50. Ding, Y., Yamashita, Y., Dodds, W. K. & Jaffé, R. Dissolved black carbon in grassland streams: Is there an effect of recentfire history?Chemosphere90, 2557–2562 (2013).
51. Wagner, S., Cawley, K. M., Rosario-Ortiz, F. L. & Jaffé, R. In-stream sources and links between particulate and dissolved black carbon following a wildfire.
Biogeochemistry124, 145–161 (2015).
52. Wang, X., Xu, C., Druffel, E. M., Xue, Y. & Qi, Y. Two black carbon pools transported by the Changjiang and Huanghe Rivers in China.Glob.
Biogeochem. Cycles30, 1778–1790 (2016).
53. Marques, J. S. J. et al. Dissolved black carbon in the headwaters-to-ocean continuum of Paraíba Do Sul River, Brazil.Front. Earth Sci.5, 1–12 (2017).
54. Coppola, A. I. et al. Marked isotopic variability within and between the Amazon River and marine dissolved black carbon pools.Nat. Commun.10, 4018 (2019).
55. Bao, H., Niggemann, J., Huang, D., Dittmar, T. & Kao, S. Different responses of dissolved black carbon and dissolved lignin to seasonal hydrological changes and an extreme rain event.J. Geophys. Res. Biogeosci.124, 479–493 (2019).
56. Roebuck, J. A., Medeiros, P. M., Letourneau, M. L. & Jaffé, R. Hydrological controls on the seasonal variability of dissolved and particulate black carbon in the Altamaha River, GA.J. Geophys. Res. Biogeosci.123, 3055–3071 (2018).
57. Wu, Y., Chan, E., Melton, J. R. & Verseghy, D. L. A map of global peatland distribution created using machine learning for use in terrestrial ecosystem and earth system models.Geosci. Model Dev.https://doi.org/10.5194/gmd- 2017-152(2017).
58. Myers-Pigg, A. N., Louchouarn, P. & Teisserenc, R. Flux of dissolved and particulate low-temperature pyrogenic carbon from two high-latitude rivers across the spring freshet hydrograph.Front. Mar. Sci.4, 1–11 (2017).
59. Wagner, S., Jaffé, R. & Stubbins, A. Dissolved black carbon in aquatic ecosystems.Limnol. Oceanogr. Lett.3, 168–185 (2018).
60. Norwood, M. J., Louchouarn, P., Kuo, L.-J. & Harvey, O. R. Characterization and biodegradation of water-soluble biomarkers and organic carbon extracted from low temperature chars.Org. Geochem.56, 111–119 (2013).
61. Wagner, S. et al. Isotopic composition of oceanic dissolved black carbon reveals non-riverine source.Nat. Commun.10, 5064 (2019).
62. Rossel, P. E. et al. Thermally altered marine dissolved organic matter in hydrothermalfluids.Org. Geochem.110, 73–86 (2017).
63. Dittmar, T. & Koch, B. P. Thermogenic organic matter dissolved in the abyssal ocean.Mar. Chem.102, 208–217 (2006).
64. Roebuck, J. A., Podgorksi, D. C., Wagner, S. & Jaffé, R. Photodissolution of charcoal andfire-impacted soil as a potential source of dissolved black carbon in aquatic environments.Org. Geochem.112, 16–21 (2017).
65. Jurado, E., Dachs, J., Duarte, C. M. & Simó, R. Atmospheric deposition of organic and black carbon to the global oceans.Atmos. Environ.42, 7931–7939 (2008).
66. Bao, H., Niggemann, J., Luo, L., Dittmar, T. & Kao, S.-J. Aerosols as a source of dissolved black carbon to the ocean.Nat. Commun.8, 510 (2017).
67. Opsahl, S. P. & Zepp, R. G. Photochemically-induced alteration of stable carbon isotope ratios (δ13C) in terrigeneous dissolved organic carbon.
Geophys. Res. Lett.28, 2417–2420 (2001).
68. Osburn, C. L., Morris, D. P., Thorn, K. A. & Moeller, R. E. Chemical and optical changes in freshwater dissolved organic matter exposed to solar radiation.Biogeochemistry54, 251–278 (2001).
69. Stubbins, A., Niggemann, J. & Dittmar, T. Photo-lability of deep ocean dissolved black carbon.Biogeosciences9, 1661–1670 (2012).
70. Andela, N. et al. A human-driven decline in global burned area.Science356, 1356–1362 (2017).
71. Forkel, M. et al. A data-driven approach to identify controls on globalfire activity from satellite and climate observations (SOFIA V1).Geosci. Model Dev.10, 4443–4476 (2017).
72. Lasslop, G., Coppola, A. I., Voulgarakis, A., Yue, C. & Veraverbeke, S.
Influence offire on the carbon cycle and climate.Curr. Clim. Chang. Rep.5, 112–123 (2019).
73. Flannigan, M. et al. Global wildlandfire season severity in the 21st century.
For. Ecol. Manag.294, 54–61 (2013).
74. Knorr, W., Arneth, A. & Jiang, L. Demographic controls of future globalfire risk.Nat. Clim. Chang6, 781–785 (2016).
75. Pechony, O. & Shindell, D. T. Driving forces of global wildfires over the past millennium and the forthcoming century.Proc. Natl Acad. Sci. USA107, 19167–19170 (2010).
76. Kloster, S. & Lasslop, G. Historical and futurefire occurrence (1850 to 2100) simulated in CMIP5 Earth System Models.Glob. Planet. Change150, 58–69 (2017).
77. Neff, J. C. & Asner, G. P. Dissolved organic carbon in terrestrial ecosystems:
synthesis and a model.Ecosystems4, 29–48 (2001).
78. Nakhavali, M. et al. Representation of dissolved organic carbon in the JULES land surface model (vn4.4_JULES-DOCM).Geosci. Model Dev.11, 593–609 (2018).
79. Lauerwald, R. et al. ORCHILEAK (revision 3875): a new model branch to simulate carbon transfers along the terrestrial-aquatic continuum of the Amazon basin.Geosci. Model Dev.10, 3821–3859 (2017).
80. Stubbins, A. et al. Anthropogenic aerosols as a source of ancient dissolved organic matter in glaciers.Nat. Geosci.5, 198–201 (2012).
81. Ding, Y., Yamashita, Y., Jones, J. & Jaffé, R. Dissolved black carbon in boreal forest and glacial rivers of central Alaska: assessment of biomass burning versus anthropogenic sources.Biogeochemistry123, 15–25 (2015).
82. Ding, Y., Cawley, K. M., da Cunha, C. N. & Jaffé, R. Environmental dynamics of dissolved black carbon in wetlands.Biogeochemistry119, 259–273 (2014).
83. Dittmar, T. The molecular level determination of black carbon in marine dissolved organic matter.Org. Geochem.39, 396–407 (2008).
84. Hammes, K. et al. Comparison of quantification methods to measurefire- derived (black/elemental) carbon in soils and sediments using reference materials from soil, water, sediment and the atmosphere.Glob. Biogeochem.
Cycles21, 1–18 (2007).
85. Zimmerman, A. R. & Mitra, S. Trial byfire: on the terminology and methods used in pyrogenic organic carbon research.Front. Earth Sci.5,
95 (2017).
86. Abiven, S., Hengartner, P., Schneider, M. P. W., Singh, N. & Schmidt, M. W. I. Pyrogenic carbon soluble fraction is larger and more aromatic in aged charcoal than in fresh charcoal.Soil Biol. Biochem.43, 1615–1617 (2011).
87. Wiedemeier, D. B. et al. Aromaticity and degree of aromatic condensation of char.Org. Geochem.78, 135–143 (2015).
88. Abell, R. et al. Freshwater ecoregions of the world: a new map of biogeographic units for freshwater biodiversity conservation.Bioscience58, 403–414 (2008).
89. Olson, D. M. et al. Terrestrial ecoregions of the world: a new map of life on Earth.Bioscience51, 933–938 (2001).
Acknowledgements
This work was principally funded by the UK Natural Environmental Research Council GW4+studentship awarded to M.W.J. under the supervision of T.A.Q. (NE/L002434/1).
S.H.D., C.S. and M.W.J. receivedfinancial support from a Leverhulme Trust Research Project Grant awarded to S.H.D. (RPG-2014-095). A.I.C. acknowledges thefinancial support of the University of Zurich Forschungskredit Fellowship and the SNSF Ambi- zione grant (PZ00P2_185835). C.S. acknowledges thefinancial support of a European Union Horizon 2020 research and innovation grant (Marie Skłodowska-Curie grant 663830). R.J. acknowledges thefinancial support of the National Science Foundation through the FCE-LTER programme and the George Barley Endowment from the Southeast Environmental Research Center at Florida International University (this is contribution number 961 from the SERC in the Institute of Environment at FIU). M.W.J.
acknowledges thefinancial support of the Tyndall Centre for Climate Change Research for costs associated withfigure production. We thank Nigel Hawtin and Renee Kar- unungan for their assistance withfigure production. We thank the reviewers for their constructive comments throughout the review process.
Author contributions
M.W.J. conceptualised the study. M.W.J. and T.A.Q. acquired the principal funding and devised the methodology. M.W.J., A.I.C., R.J. and T.D. curated the data set. M.W.J.
conducted the formal analyses, produced thefigures and prepared the original draft of the article. T.A.Q., S.H.D. and C.S. supervised M.W.J. during the completion of this work. All authors aided in the interpretation of results and contributed to review and editing of the article.
Competing interests
The authors declare no competing interests.
Additional information
Supplementary informationis available for this paper athttps://doi.org/10.1038/s41467- 020-16576-z.
Correspondenceand requests for materials should be addressed to M.W.J.
Peer review informationNature Communicationsthanks Omar Harvey, Patrick Louchouarn and other anonymous reviewers for their contributions to the peer review of this work. Peer review reports are available.
Reprints and permission informationis available athttp://www.nature.com/reprints Publisher’s noteSpringer Nature remains neutral with regard to jurisdictional claims in published maps and institutional affiliations.
Open Access This article is licensed under a Creative Commons Attribution 4.0 International License, which permits use, sharing, adaptation, distribution and reproduction in any medium or format, as long as you give appropriate credit to the original author(s) and the source, provide a link to the Creative Commons license, and indicate if changes were made. The images or other third party material in this article are included in the article’s Creative Commons license, unless indicated otherwise in a credit line to the material. If material is not included in the article’s Creative Commons license and your intended use is not permitted by statutory regulation or exceeds the permitted use, you will need to obtain permission directly from the copyright holder. To view a copy of this license, visithttp://creativecommons.org/
licenses/by/4.0/.
© The Author(s) 2020