Research Collection
Dataset
Research data supporting: "Enhanced Ice Nucleation Efficiency of Mineral Dust Particles in Ammonia/Ammonium Solution Droplets"
Author(s):
Kumar, Anand Publication Date:
2018
Permanent Link:
https://doi.org/10.3929/ethz-b-000262184
Rights / License:
In Copyright - Non-Commercial Use Permitted
This page was generated automatically upon download from the ETH Zurich Research Collection. For more information please consult the Terms of use.
ETH Library
Supplementary material to Chapter 4 of PhD dissertation (No. 25239) titled
“Enhanced Ice Nucleation Efficiency of Mineral Dust Particles in
Ammonia/Ammonium Solution Droplets” submitted by Anand Kumar
S1 DSC thermograms of immersion freezing with emulsions of freshly prepared SA quartz suspensions in glass vials in water or aqueous solutions
We show one set of DSC thermograms (1 K min-1 cooling cycle) for each solute concentration for the freshly prepared suspensions in glass vials and measured emulsions.
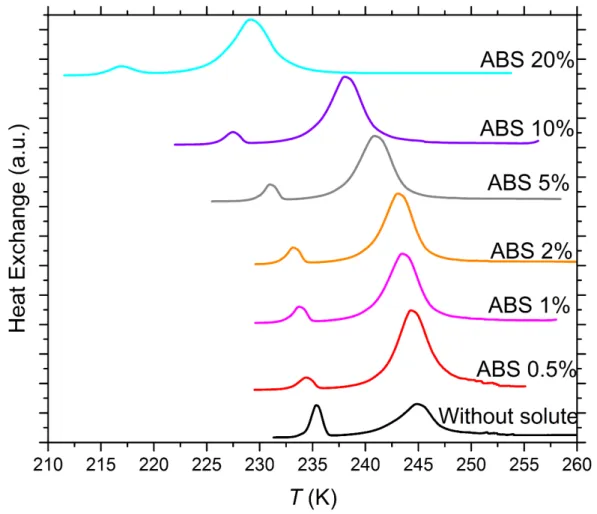
Figure S1. DSC thermograms of 5 wt% of SA quartz particles suspended in ammonium bisulfate (ABS) solution droplets of varying concentration. All curves are normalized such that the areas under the heterogeneous and homogeneous freezing curves sum up to the same value. Numbers next to each curve: Solute concentration in wt%.
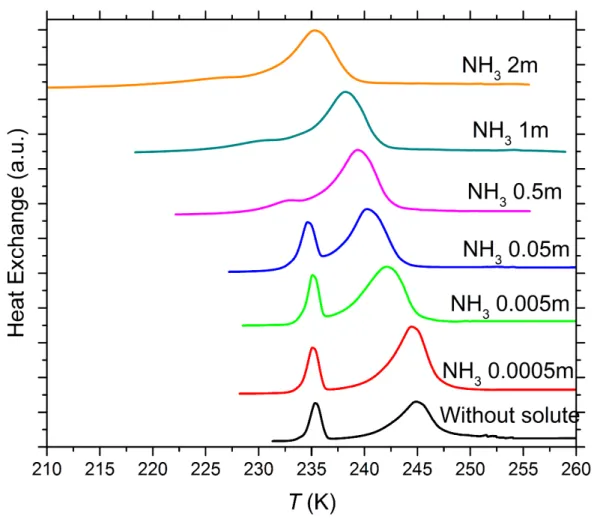
Figure S2. DSC thermograms of 5 wt% SA quartz particles suspended in ammonia (NH3) solution droplets of varying
concentration. All curves are normalized such that the areas under the heterogeneous and homogeneous freezing curves sum up to the same value. Numbers next to each curve: Solute concentration in molality.
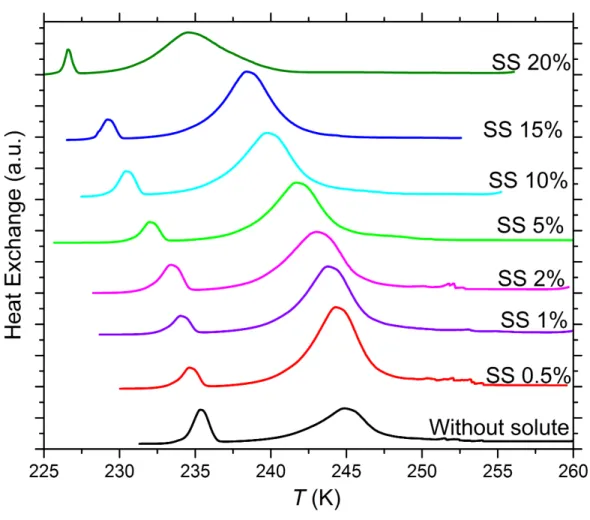
Figure S3. DSC thermograms of 5 wt% SA quartz particles suspended in sodium sulfate (SS) solution droplets of varying concentration. All curves are normalized such that the areas under the heterogeneous and homogeneous freezing curves sum up to the same value. Numbers next to each curve: Solute concentration in wt%.
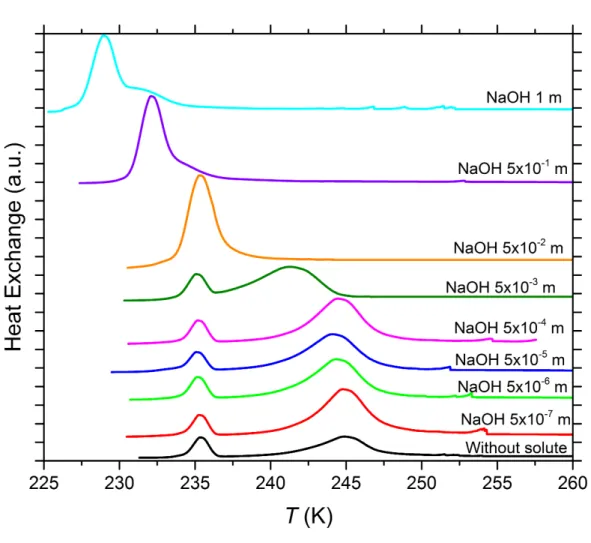
Figure S4. DSC thermograms of 5 wt% SA quartz particles suspended in sodium hydroxide (NaOH) solution droplets of varying concentration. All curves are normalized such that the areas under the heterogeneous and homogeneous freezing curves sum up to the same value. Numbers next to each curve: Solute concentration in molality.
S2 DSC thermograms of immersion freezing with emulsions of SA quartz suspensions in water or aqueous solutions prepared in glass vials and aged over a period of 5 days
At least two sets of suspensions prepared in glass vials with SA quartz (5 wt%) in pure water, NH3 solution (0.005 molal), (NH4)2SO4 solution (10 wt%), NH4HSO4 solution (2 wt%) Na2SO4 solution (5 wt%) and NaOH solutions (5x10⁻³ and 5x10⁻⁶ molal) were aged over a period of 5 days. Immersion freezing experiments were carried out with the DSC setup on the day of preparation (fresh), then on 5 subsequent days after preparation in order to assess the long-term effect of various solutes on the IN efficiency of quartz. We show one set of DSC thermograms (1 K min-1 cooling cycle) containing each solute concentration once over the measured time period.
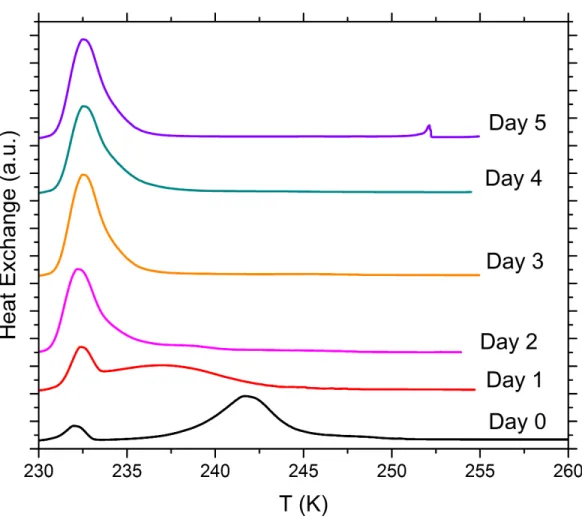
Figure S5. DSC thermograms of aging tests with 5 wt% SA quartz particles suspended in pure water droplets measured over a period of 5 days. All curves are normalized such that the areas under the heterogeneous and homogeneous freezing curves sum up to the same value.
Figure S6. DSC thermograms of aging tests with 5 wt% SA quartz particles suspended in 10 wt% ammonium sulfate solution droplets measured over a period of 5 days. All curves are normalized such that the areas under the heterogeneous and
homogeneous freezing curves sum up to the same value.
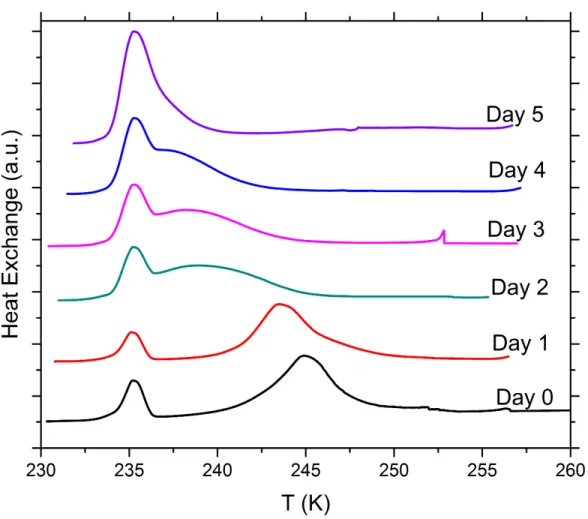
Figure S7. DSC thermograms of aging tests with 5 wt% SA quartz particles suspended in 2 wt% ammonium bisulfate solution droplets measured over a period of 5 days. All curves are normalized such that the areas under the heterogeneous and
homogeneous freezing curves sum up to the same value.
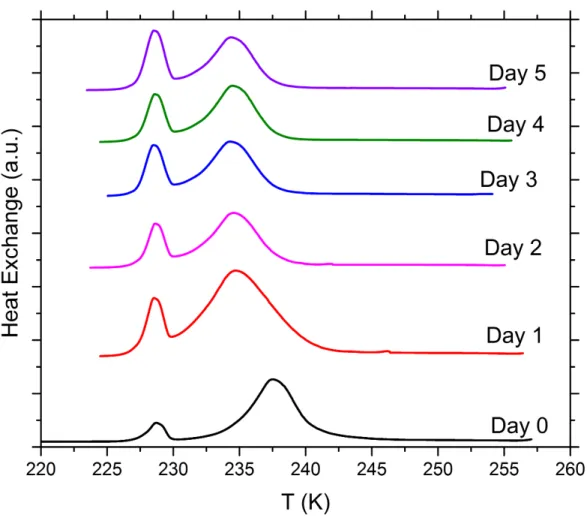
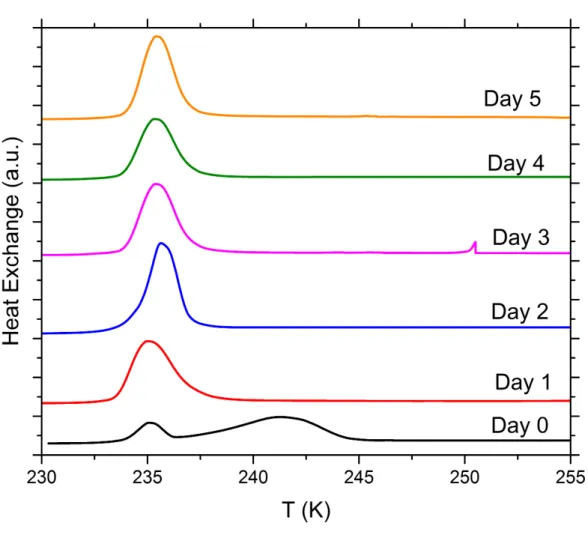
Figure S8. DSC thermograms of aging tests with 5 wt% SA quartz particles suspended in 0.005 molal ammonia solution droplets measured over a period of 5 days. All curves are normalized such that the areas under the heterogeneous and homogeneous freezing curves sum up to the same value.
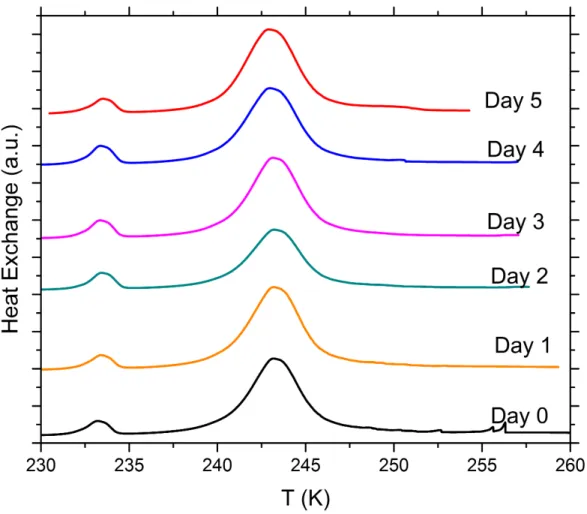
Figure S9. DSC thermograms of aging tests with 5 wt% SA quartz particles suspended in 5 wt% sodium sulfate solution droplets measured over a period of 5 days. All curves are normalized such that the areas under the heterogeneous and homogeneous freezing curves sum up to the same value.
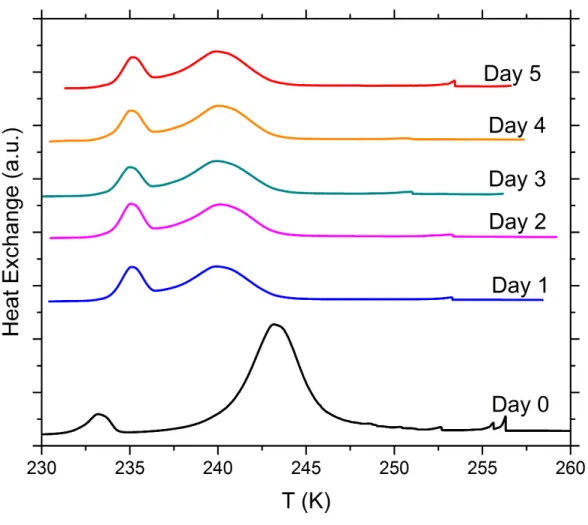
Figure S10. DSC thermograms of aging tests with 5 wt% SA quartz particles suspended in 5x10⁻³ molal sodium hydroxide solution droplets measured over a period of 5 days. All curves are normalized such that the areas under the heterogeneous and homogeneous freezing curves sum up to the same value.
Figure S11. DSC thermograms of aging tests with 5 wt% SA quartz particles suspended in 5x10⁻⁶ molal sodium hydroxide solution droplets measured over a period of 5 days. All curves are normalized such that the areas under the heterogeneous and homogeneous freezing curves sum up to the same value.
S3 DSC thermograms of immersion freezing with emulsions of SA quartz suspensions prepared in glass vials in water or aqueous solutions aged over a period of 5 days and resuspended in water to assess the reversibility of the solute effect on IN efficiency
At least two sets of suspensions prepared with SA quartz (5 wt%) in pure water, NH3 solution (0.005 molal), (NH4)2SO4 solution (10 wt%), NH4HSO4 solution (2 wt%) Na2SO4 solution (5 wt%) and NaOH solutions (5x10⁻³ and 5x10⁻⁶ molal) were aged over a period of 5 days. The aged suspensions were then centrifuged for 2 minutes at 600 rpm, the supernatant solution was removed and the settled particles were washed with pure water. This process was repeated five times and the washed particles were resuspended in pure water. Using DSC, we compared immersion freezing of emulsions containing dust treated in this manner with emulsions of the same solute concentration prepared with fresh dust. We show 2 – 4 thermograms (1 K min-1 cooling cycle) for each reversibility test.
Figure S12. DSC thermograms of reversibility tests on four separate suspensions with 5 wt% SA quartz particles aged for 5 days in pure water. Aged particles were collected after aging and resuspended in pure water. All curves are normalized such that the areas under the heterogeneous and homogeneous freezing curves sum up to the same value.
Figure S13. DSC thermograms of reversibility tests on separate suspensions with 5 wt% SA quartz particles aged for 5 days in 10 wt% ammonium sulfate solution. Aged particles were collected after aging and resuspended in pure water. All curves are normalized such that the areas under the heterogeneous and homogeneous freezing curves sum up to the same value.
Figure S14. DSC thermograms of reversibility tests on separate suspensions with 5 wt% SA quartz particles aged for 5 days in 2 wt% ammonium bisulfate solution. Aged particles were collected after aging and resuspended in pure water. All curves are normalized such that the areas under the heterogeneous and homogeneous freezing curves sum up to the same value.
Figure S15. DSC thermograms of reversibility tests on separate suspensions with 5 wt% SA quartz particles aged for 5 days in 0.005 molal ammonia solution. Aged particles were collected after aging and resuspended in pure water. All curves are normalized such that the areas under the heterogeneous and homogeneous freezing curves sum up to the same value.
Figure S16. DSC thermograms of reversibility tests on separate suspensions with 5 wt% SA quartz particles aged for 5 days in 5 wt% sodium sulfate solution. Aged particles were collected after aging and resuspended in pure water. All curves are normalized such that the areas under the heterogeneous and homogeneous freezing curves sum up to the same value.
Figure S17. DSC thermograms of reversibility tests on separate suspensions with 5 wt% SA quartz particles aged for 5 days in 5x10⁻⁶ molal sodium hydroxide solution. Aged particles were collected after aging and resuspended in pure water. All curves are normalized such that the areas under the heterogeneous and homogeneous freezing curves sum up to the same value.
Figure S18. DSC thermograms of reversibility tests on separate suspensions with 5 wt% SA quartz particles aged for 5 days in 5x10⁻³ molal sodium hydroxide solution. Aged particles were collected after aging and resuspended in pure water. All curves are normalized such that the areas under the heterogeneous and homogeneous freezing curves sum up to the same value.
S4 DSC Thermograms of immersion freezing experiments with emulsions of SA quartz suspensions prepared in
polypropylene falcon tubes in water or aqueous solutions aged over a period of 5 days and resuspended in water to assess the reversibility of the solute effect on IN efficiency
At least two sets of suspensions prepared with quartz (5 wt%) in pure water, NH3 solution (0.005 molal), and NaOH solutions (5x10⁻³ molal) were prepared in polypropylene falcon tubes and aged over a period of 5 days. The aged suspensions were then centrifuged for 2 minutes at 600 rpm, the supernatant solution was removed and the settled particles were washed with pure water.
This process was repeated five times and the washed particles were resuspended in pure water. Using DSC, we compared immersion freezing of emulsions containing dust treated in this manner with emulsions of the same solute concentration prepared with fresh dust. We show one set of DSC thermograms (1 K min-1 cooling cycle) during 5-day aging and reversibility containing each solute concentration once.
Figure S19. DSC thermograms of aging and reversibility tests on suspensions with 5 wt% SA quartz particles prepared in polypropylene vials and aged for 5 days in pure water. Aged particles were collected after aging and resuspended in pure water.
All curves are normalized such that the areas under the heterogeneous and homogeneous freezing curves sum up to the same value.
Figure S20. DSC thermograms of aging and reversibility tests on suspensions with 5 wt% SA quartz particles prepared in polypropylene tubes and aged for 5 days in ammonia solution (0.005 molal). Aged particles were collected after aging and resuspended in pure water. All curves are normalized such that the areas under the heterogeneous and homogeneous freezing curves sum up to the same value.
Figure S21. DSC thermograms of aging and reversibility tests on suspensions with 5 wt% SA quartz particles prepared in polypropylene vials and aged for 5 days in sodium hydroxide solution (0.005 molal). Aged particles were collected after aging and resuspended in pure water. All curves are normalized such that the areas under the heterogeneous and homogeneous freezing curves sum up to the same value.
S5 DSC Thermograms of immersion freezing experiments with emulsions of milled SA quartz suspensions in water We milled the SA quartz sample and ran emulsion freezing experiments on 1 wt % and 5wt % milled SA quartz in pure water to assess the effect of additional milling on its IN efficiency.
Figure S22. DSC thermograms of freezing experiments on separate suspensions with 1 wt% milled SA quartz particles in pure water. All curves are normalized such that the areas under the heterogeneous and homogeneous freezing curves sum up to the same value.
Figure S23. DSC thermograms of freezing experiments on separate suspensions with 5 wt% milled SA quartz particles in pure water. All curves are normalized such that the areas under the heterogeneous and homogeneous freezing curves sum up to the same value.
S6 Evaluation of presence of semivolatile organic species on quartz
In order to evaluate the presence of semivolatile species, if any, we ran thermogravimetric tests on Sigma Aldrich quartz, TU Vienna quartz and the quartz sample from Kaufmann et al. (2016), with a Thermogravimetric Analyzer (TGA) (Perkin Elmer Pyris 1), which has a weight sensitivity of 0.1 µg and 2 ºC temperature precision.
Figure S24. Mass loss of the SA quartz sample measured by thermogravimetric analysis. Blue line: temperature (ºC); black line:
sample weight loss (in %). A minor loss of up to 0.30% in weight was observed.
Figure S25. Mass loss of the Kaufmann quartz sample measured by thermogravimetric analysis. Blue line: temperature (ºC);
black line: sample weight loss (in %). A minor loss of up to 0.14% in weight was observed.
Figure S26. Mass loss of the TU Vienna sample measured by thermogravimetric analysis.. Blue line: temperature (ºC); black line: sample weight loss (in %). A minor loss of up to 0.2% in weight was observed.
S7 Silica particles
S6.1 Synthesis of submicron nonporous Stöber silica particles
Ammonia (66 ml, 28 %), deionized water (133 ml) and ethanol (217 ml, 99.8 %) were stirred at 25 °C for 10 min. Then tetraethyl orthosilicate (TEOS) (20 ml, 44.8 mmol, 99 %) was added within 20 s under vigorous stirring. After a few minutes, silica particles started to precipitate. After 4 h of reaction, the suspension was centrifuged. The precipitate was then washed with deionized water (350 ml) twice and once with ethanol (100 ml). The particles were dried (80 °C, ≥ 2 h) before they were ground in methanol (99
%) and dried (80 ° C, ≥ 1 h) again. Then they were calcined at 550 °C. A white powder was obtained with a yield of 80 % (≈ 6.5 g).
S6.2 Particle functionalization: Stöber silica particles
Stöber particles were in addition hydroxylated: A calcined sample (1.0 g) was suspended in toluene (200 mL) and heated to 60 °C.
A calculated amount of water was added according to Eq. S1 with vigorous stirring, and occasional sonication, the particles were suspended during 60 min, before they were filtered off, washed with deionized water (80 mL) and dried (120 °C, 20 mbar) overnight.
𝑉𝑉𝑤𝑤=𝑀𝑀𝑤𝑤𝜎𝜎𝑆𝑆𝑆𝑆𝑆𝑆𝑆𝑆𝜌𝜌 𝐴𝐴𝑠𝑠𝑚𝑚𝑆𝑆𝑆𝑆𝑆𝑆2
𝑤𝑤𝑁𝑁𝐴𝐴 (S1) In this equation, 𝑚𝑚𝑆𝑆𝑆𝑆𝑆𝑆2 is the weight of the particles, As the specific surface area, concentration of surface silanol groups σSiOH = 4.6 nm-2, Mw is the molar mass of water, ρw the density of water and NA the Avogadro constant.
S8 Scanning electron microscopy images of quartz samples S8.1 Sigma Aldrich quartz
Figure S27. SEM images of SA quartz at various magnifications.
S8.2 Quartz sample from Kaufmann et al. (2016)
Figure S28. SEM images of Kaufmann quartz at various magnifications.
S9 Particle size distribution of Sigma-Aldrich quartz
Number size distribution of the SA quartz sample was obtained with a TSI 3080 scanning mobility particle sizer (SMPS) and a TSI 3321 aerodynamic particle sizer (APS). The dry particles were dispersed using a fluidized bed. The sample shows a strong bimodal particle size distribution with mode diameters of 481 nm and 1.5 µm. There is a third, yet extremely weak, mode around 201 nm particle diameter.
Figure S29. Particle size distribution of SA quartz sample. Solid black squares: APS; solid black triangles: SMPS; red lines: two lognormal fits to data obtained from APS and SMPS; blue line: resultant bimodal lognormal fit to the observed dataset.