https://doi.org/10.5194/acp-21-163-2021
© Author(s) 2021. This work is distributed under the Creative Commons Attribution 4.0 License.
Concerted measurements of free amino acids at the Cabo Verde islands: high enrichments in submicron sea spray
aerosol particles and cloud droplets
Nadja Triesch1, Manuela van Pinxteren1, Anja Engel2, and Hartmut Herrmann1
1Atmospheric Chemistry Department (ACD), Leibniz-Institute for Tropospheric Research (TROPOS), Leipzig 04318, Germany
2GEOMAR Helmholtz Centre for Ocean Research, Kiel 24105, Germany Correspondence:Hartmut Herrmann (herrmann@tropos.de)
Received: 23 October 2019 – Discussion started: 17 February 2020
Revised: 5 November 2020 – Accepted: 13 November 2020 – Published: 11 January 2021
Abstract. Measurements of free amino acids (FAAs) in the marine environment to elucidate their transfer from the ocean into the atmosphere, to marine aerosol particles and to clouds, were performed at the MarParCloud (marine biolog- ical production, organic aerosol particles and marine clouds:
a process chain) campaign at the Cabo Verde islands in au- tumn 2017. According to physical and chemical specifica- tions such as the behavior of air masses, particulate MSA concentrations and MSA/sulfate ratios, as well as particu- late mass concentrations of dust tracers, aerosol particles pre- dominantly of marine origin with low to medium dust in- fluences were observed. FAAs were investigated in different compartments: they were examined in two types of seawa- ter underlying water (ULW) and in the sea surface micro- layer (SML), as well as in ambient marine size-segregated aerosol particle samples at two heights (ground height based at the Cape Verde Atmospheric Observatory, CVAO, and at 744 m height on Mt. Verde) and in cloud water using con- certed measurements. TheP
FAA concentration in the SML varied between 0.13 and 3.64 µmol L−1, whereas it was be- tween 0.01 and 1.10 µmol L−1in the ULW; also, a strong en- richment ofP
FAA (EFSML: 1.1–298.4, average of 57.2) was found in the SML. In the submicron (0.05–1.2 µm) aerosol particles at the CVAO, the composition of FAAs was more complex, and higher atmospheric concentrations of PFAA (up to 6.3 ng m−3) compared to the supermicron (1.2–10 µm) aerosol particles (maximum of 0.5 ng m−3) were observed.
The total P
FAA concentration (PM10) was between 1.8 and 6.8 ng m−3and tended to increase during the campaign.
AveragedP
FAA concentrations in the aerosol particles on Mt. Verde were lower (submicron: 1.5 ng m−3; supermicron:
1.2 ng m−3) compared to the CVAO. A similar contribution percentage ofP
FAA to dissolved organic carbon (DOC) in the seawater (up to 7.6 %) and to water-soluble organic car- bon (WSOC) in the submicron aerosol particles (up to 5.3 %) indicated a related transfer process of FAAs and DOC in the marine environment.
Considering solely ocean–atmosphere transfer and ne- glecting atmospheric processing, high FAA enrichment fac- tors were found in both aerosol particles in the submicron range (EFaer(PFAA): 2×10³–6×10³) and medium enrich- ment factors in the supermicron range (EFaer(PFAA): 1×101– 3×101). In addition, indications for a biogenic FAA forma- tion were observed. Furthermore, one striking finding was the high and varying FAA cloud water concentration (11.2–
489.9 ng m−3), as well as enrichments (EFCW: 4×10³ and 1×10⁴compared to the SML and ULW, respectively), which were reported here for the first time. The abundance of inor- ganic marine tracers (sodium, methanesulfonic acid) in cloud water suggests an influence of oceanic sources on marine clouds. Finally, the varying composition of the FAAs in the different matrices shows that their abundance and ocean–
atmosphere transfer are influenced by additional biotic and abiotic formation and degradation processes. Simple physic- ochemical parameters (e.g., surface activity) are not suffi- cient to describe the concentration and enrichments of the FAAs in the marine environment. For a precise representa- tion in organic matter (OM) transfer models, further studies
are needed to unravel their drivers and understand their com- position.
1 Introduction
Amino acids contribute to the global nitrogen and carbon cy- cle and to the atmosphere–biosphere nutrient cycle (Zhang and Anastasio, 2003; Wedyan and Preston, 2008). They can be divided into free single amino acids (FAAs) and com- bined amino acids (CAAs), which include proteins, pep- tides and other combined forms (Mandalakis et al., 2011).
Amino acids are produced in the ocean and are reported to be in the upper layer of the ocean, the sea surface micro- layer (SML) (Kuznetsova et al., 2004; Reinthaler et al., 2008;
van Pinxteren et al., 2012; Engel and Galgani, 2016). The SML, as the direct interface between the ocean and the at- mosphere, may play an important role as a source of organic matter (OM) in aerosol particles within the marine environ- ment (Cunliffe et al., 2013; Engel et al., 2017; Wurl et al., 2017). Specific organic groups of compounds, including ni- trogenous OM (Engel and Galgani, 2016), can be strongly enriched in the SML. From the ocean, amino acids, as part of the class of proteinaceous compounds, can be transferred into atmospheric particles via bubble bursting (Kuznetsova et al., 2005; Rastelli et al., 2017). These proteinaceous com- pounds are often analyzed as sum parameter “proteins” us- ing an analytical staining method with Coomassie blue de- veloped by Bradford (1976) and have often been applied in previous studies (Gutiérrez-Castillo et al., 2005; Mandalakis et al., 2011; Rastelli et al., 2017). Despite their attribution to proteins, the FAAs are better utilizable forms of nitrogen instead of proteins for aquatic organisms such as phytoplank- ton and bacteria (Antia et al., 1991; McGregor and Anastasio, 2001).
Due to their structure and hygroscopic properties, amino acids can act as both ice-forming particles (INPs) (Wolber and Warren, 1989; Szyrmer and Zawadzki, 1997; Pandey et al., 2016; Kanji et al., 2017) and cloud condensation nuclei (CCN) (Kristensson et al., 2010) in the atmosphere, while amino acids such as arginine and asparagine can exist as metastable droplets instead of solid particles at low relative humidity; this has been shown a laboratory study (Chan et al., 2005). In general, previous studies have shown that amino acids in aerosol particles can have both natural and anthro- pogenic sources. Having been detected in volcanic emissions (Scalabrin et al., 2012) and during biomass burning events (Chan et al., 2005; Feltracco et al., 2019), amino acids can be produced by plants, pollens, fungi, bacterial spores and algae (Milne and Zika, 1993; Zhang and Anastasio, 2003;
Matos et al., 2016). Nevertheless, they are useful indicators for aerosol particle age and origin (Barbaro et al., 2011; Mat- sumoto and Uematsu, 2005; Scalabrin et al., 2012). Based on a cluster and factor analysis, Scalabrin et al. (2012) suggested
two possible sources for the amino acids in the ultrafine Arc- tic aerosol particles. The authors first mentioned the regional development (isoleucine, leucine, threonine) and long-range transport (glycine) of amino acids from marine areas and sec- ondly, the influence of local sources such as of marine pri- mary production (proline, valine, serine, tyrosine, glutamic acid). A different approach by Mashayekhy Rad et al. (2019) investigated the atmospheric proteinogenic aerosol particles in the Arctic and attributed them to different sources based, among others, on the reactivity of the distinct amino acids.
The authors differentiated here between long-range trans- port (glycine), terrestrial and marine aerosol particles (pro- line, valine, serine, tyrosine), and coastal and marine phy- toplankton and bacteria (isoleucine, leucine and threonine) as important sources for amino acids (Mashayekhy Rad et al., 2019). In fact, previous studies have assigned individ- ual amino acids to specific marine biogenic sources and used them as biomarkers. Hammer and Kattner (1986) reported correlations between aspartic acid, diatoms and zooplank- ton in seawater. GABA (γ-aminobutyric acid) was referred to as an indicator for the microbiological decomposition of OM (Dauwe et al., 1999; Engel et al., 2018) and is used as a microbiological proxy in aerosol particles. To facilitate the comparison of amino acids in different studies, one possibil- ity is to group them according to the physiochemical prop- erties of amino acids (“hydropathy index”; Kyte and Doolit- tle, 1982), as Pommié et al. (2004) suggested based on the partition coefficient between water and ethanol. This divides them into hydrophilic, neutral and hydrophobic amino acids as discussed in Barbaro et al. (2015), for FAAs in Antarctic aerosol particles. They also observed that hydrophilic FAAs in the Antarctic were predominant in locally produced ma- rine aerosol particles, while hydrophobic amino acids pre- vailed in aerosol particles collected at the continental station.
Although the study and characterization of amino acids are of paramount importance for atmospheric scientists, the true role and the fate of amino acids in the atmosphere are still poorly understood (Matos et al., 2016). Despite several studies of FAAs also conducted in the marine environment, there is still a huge uncertainty as to the question of whether FAAs are of marine origin or not. Matsumoto and Uematsu (2005) showed that the long-range transport of land-derived sources largely contributes to the amino acid concentration in the North Pacific. On the other hand, based on a posi- tive correlation between amino acids in seawater and the at- mosphere, Wedyan and Preston (2008) pointed out that the particulate amino acids in the Southern Ocean are of marine origin. These findings are likely due to regionally varying source strengths, given different meteorological and biolog- ical conditions, which necessarily require further measure- ments in distinct marine regions. Unfortunately, measure- ments are lacking that regard the abundance and molecu- lar composition of amino acids in both seawater and size- segregated aerosol particles, especially in the tropical At- lantic Ocean.
So the aim of the present study is to investigate the occur- rence of FAAs in the marine environment which includes all important compartments: i.e., the seawater underlying water (ULW), the SML, the aerosol particles and finally cloud wa- ter in the remote tropical North Atlantic Ocean at the Cape Verde Atmospheric Observatory (CVAO). Their abundance, origin and possible transfer from the seawater, as well as their transport within the atmosphere, are studied in partic- ular. Therefore, the FAAs are measured on a molecular level and divided into hydrophilic (glutamic acid, aspartic acid, GABA), neutral (serine, glycine, threonine, proline, tyrosine) and hydrophobic (alanine, valine, phenylalanine, isoleucine, leucine) compounds according to their hydropathy index.
The similarities and differences between the amino acid com- position in submicron (0.05–1.2 µm) and supermicron (1.2–
10 µm) aerosol particles are especially elucidated. Finally, the potential of individual FAAs as proxies or tracers for spe- cific sources of aerosol particles and cloud water in the trop- ical marine environment is outlined.
2 Experiment 2.1 Study area
Within the framework of the MarParCloud (marine biologi- cal production, organic aerosol particles and marine clouds:
a process chain) project with contributions from MARSU (MARine atmospheric Science Unravelled: analytical and mass spectrometric techniques development and applica- tion), a field campaign was performed at the CVAO from 13 September to 13 October 2017. This remote marine sta- tion is located on the northeast coast of the island of São Vicente, directly by the ocean (16◦5104900N, 24◦5200200E), which Carpenter et al. (2010) and Fomba et al. (2014) de- scribed in more detail. In accordance with the classification of Longhurst (2007), the ocean around the Cabo Verde is- lands belongs to the region “North Atlantic Tropical Gy- ral Province” (NATR), which is described as the region with the lowest surface chlorophyll in the North Atlantic Ocean that has a greater annual than seasonal variability.
During this campaign, concerted measurements were per- formed including the sampling of size-segregated aerosol particles at the CVAO and seawater sampling at the ocean site (∼16◦5301700N,∼24◦5402500E). The location was care- fully chosen to have a minimal influence from the island and was located in the wind direction of the CVAO as shown in Fig. S1. Here, an aerosol particle sampler and cloud wa- ter sampler were installed at the mountain station “Monte Verde” (MV) on the top of the mountain (16◦5201100N, 24◦5600200W). Further details on the MarParCloud campaign are provided by van Pinxteren et al. (2020).
2.1.1 Seawater sampling
The seawater samples were taken from a fishing boat, launch- ing from Baía das Gatas, São Vicente. A glass plate with a sampling area of 2500 cm2 was vertically immersed in the seawater and then slowly drawn upwards to take the SML.
The surface films adhered to the surface of the glass plate and were removed with Teflon wipers directly into a bottle.
This glass plate approach is described in detail by Cunliffe (2014). The ULW was sampled at a depth of 1 m into a plas- tic bottle fitted on a telescopic rod. To avoid influences from the SML, the bottles were opened underwater at the intended sampling depth. All seawater samples were stored in plas- tic bottles at−20◦C until the time of analysis. All materials for the seawater sampling were pre-cleaned with a 10 % HCl solution and high-purity water.
2.1.2 Aerosol particle sampling
Size-segregated aerosol particles were sampled using five- stage Berner-type impactors (Hauke, Gmunden, Austria) at the top of a 30 m sampling tower at the CVAO since this location best represents the conditions above the ocean in accordance with previous studies. The internal boundary layer (IBL), which can form when air passes a surface with changing roughness (i.e., the transfer from open water to island), is mainly beneath 30 m (Niedermeier et al., 2014).
Moreover, aerosol particles were sampled on the top of MV (744 m a.s.l.). To avoid the condensation of atmospheric wa- ter in the aerosol particle sampling substrate, a conditioning unit consisting of a 3 m long tube was installed between the impactor inlet and the sampling unit. By heating the sampled air, the high relative humidity of the ambient air before col- lecting the aerosol particles was set to 75 %–80 %. The tem- perature difference between the ambient air at the impactor inlet and the sampled air after the conditioning unit was be- low 9 K (van Pinxteren et al., 2020). The Berner impactors were operated with a flow rate of 75 L min−1for 24 h, and pre-baked aluminum foils (350◦C for 2 h) were used as sub- strate material. The five stage Berner impactor includes stage 1 (B1): 0.05–0.14 µm; stage 2 (B2): 0.14–0.42 µm; stage 3 (B3): 0.42–1.2 µm; stage 4 (B4): 1.2–3.5 µm and stage 5 (B5): 3.5–10 µm. When it comes to the segregated aerosol particle samples, our study differentiates between the ones of submicron size (B1, B2, B3), the ones of supermicron size (B4, B5) and the ones of PM10(B1–5). After the sampling, the aluminum foils were stored in aluminum boxes at−20◦C until the time of analysis. It needs to be pointed out that the Berner impactors ran continuously; thus, the impactor on MV sampled aerosol particles also during cloud events.
However, due to the preconditioning unit, the cloud droplets were efficiently removed before the aerosol particles were collected on the aluminum foils.
2.1.3 Cloud water sampling
At the MV station, an acrylic glass Caltech Active Strand Cloud water Collector version 2 (CASCC2), according to Demoz et al. (1996), was used to sample cloud water. Dur- ing a “cloud event”, the bottles were changed every 2–3 h, whereas on the other days, the sampling time was, e.g., overnight (every 12 h). For each sampling, the Teflon rods used were pre-cleaned with a 10 % HCl solution followed by high-purity water. The liquid water content (LWC) of the cloud was measured continuously by a particle volume mon- itor (PVM-100, Gerber Scientific, USA). Finally, the col- lected cloud water was sampled in pre-cleaned plastic bottles and stored at−20◦C until the time of analysis.
2.2 Analyses
2.2.1 Seawater analyses
For the dissolved organic carbon and total dissolved ni- trogen (DOC/TDN) content and the analysis of inorganic ions, the seawater samples were first filtered (0.45 µm sy- ringe filter) and then quantified with a TOC-VCPH ana- lyzer (Shimadzu, Japan) or ion chromatography (ICS3000, Dionex, Sunnyvale, CA, USA), as described in van Pinx- teren et al. (2017). As the seawater samples must first undergo a desalination step for the FAA analysis, 32 mL (SML samples) or 48 mL (ULW samples) were desalinated using Dionex™ OnGuard™ II Ag/H cartridges (Thermo Fisher Scientific™, Waltham, Massachusetts, USA). The volume of the desalinated samples was reduced to sev- eral microliters using a vacuum concentrator at T =30◦C (miVac sample Duo, GeneVac Ltd., Ipswich, United King- dom) with a recovery rate of >86 %. The 0.2 µm sy- ringe filters (Acrodisc GHP, 25 mm; Pall Corporation, New York, USA) enabled the filtering of the enriched samples;
then, a derivatization was performed with the AccQ-Tag™
precolumn derivatization method (Waters, Eschborn, Ger- many). Besides, the FAA analysis includes the determina- tion of glycine (Gly), L-alanine (Ala), L-serine (Ser), L- glutamic acid (Glu), L-threonine (Thr), L-proline (Pro), L- tyrosine (Tyr), L-valine (Val), L-phenylalanine (Phe), L- aspartic acid (Asp), L-isoleucine (Ile), L-leucine (Leu), L- methionine (Met), L-glutamine (Gln) and γ-aminobutyric acid (GABA) (purity≥99 %; Sigma-Aldrich, St. Louis, Mis- souri, USA). Ultra-high performance liquid chromatogra- phy with electrospray ionization and Orbitrap mass spec- trometry (UHPLC/ESI-Orbitrap-MS) performed the analyt- ical measurements of the derivatized FAAs. The UHPLC system (Vanquish Horizon UHPLC system, Thermo Fisher Scientific™, Waltham, Massachusetts, USA) was coupled with an ESI-Orbitrap mass spectrometer (Q Exactive™ plus, Thermo Fisher Scientific™, Waltham, Massachusetts, USA).
The samples were subsequently separated through an AC- QUITY UPLC® HSS T3 column (Waters, Eschborn, Ger-
many) with dimensions of 1.8 µm (particle size), 2.1 mm (in- ner diameter) and 100 mm (length) at a constant temperature of 30◦C and a detection in positive mode. The eluent com- position consisted of (A) 0.2 vol % acetic acid in high-purity water (Millipore Elix 3 and Element A10, Merck Millipore, Darmstadt, Germany) and (B) acetonitrile (Optima®LC/MS Grade, Fisher Scientific, Hampton, New Hampshire, USA).
The flow rate of the eluent was 0.3 mL min−1. The eluent gradient program was 5 % B for 1 min, from 5 % B to 100 % B in 16 min, 100 % B for 2 min constant and from 100 % B to 5 % B in 0.1 min, and 5 % B was then kept constant for 3.9 min. This analytical procedure can be used for amines, too, as described in van Pinxteren et al. (2019). The FAA con- centrations were determined via external calibration. Since no chiral column was used in the UHPLC separation, we cannot differentiate between L- and D-amino acids in our ambient samples. Each seawater sample was measured as a duplicate with a relative standard deviation<10 % and un- der consideration of the blank samples for seawater. They consist of high-purity water, which was filled in pre-cleaned plastic bottles and handled the same as the seawater samples.
The limit of quantification (LOQ) of the individual FAAs in seawater samples is in good agreement with the FAA analysis of seawater samples (e.g., Kuznetsova et al., 2004) and are listed in Table S1. The LOQs were mostly below 10 nmol L−1; however, GABA and Met exhibited LOQs of 24.2 and 16.8 nmol L−1, respectively (due to high blank val- ues). A quantification of some FAAs in seawater, mainly in the ULW with its generally lower FAA concentrations com- pared to the SML, is therefore partly limited.
2.2.2 Aerosol particle filter analyses
For analyzing the size-segregated aerosol particle samples, the substrate material of each stage was extracted in 3 mL of high-purity water (Millipore Elix 3 and Element A10, Merck Millipore, Darmstadt, Germany). The aqueous par- ticle extracts were divided into aliquots for the analysis of water-soluble organic carbon and total dissolved nitrogen (WSOC/TDN), inorganic ions, and amino acids. The aliquots for WSOC/TDN were first filtered with a 0.45 µm syringe filter and then determined by a TOC-VCPH analyzer (Shi- madzu, Japan), as described in van Pinxteren et al. (2012).
For the analysis of inorganic ions, the aliquots (250 µL) were filtered (0.45 µm syringe filter) and investigated using ion chromatography (ICS3000, Dionex, Sunnyvale, CA, USA), as outlined in Müller et al. (2010). The aliquot (1.5 mL) of the aqueous particle extracts for FAA analysis was reduced to several microliters with a vacuum concentrator atT =30◦C (miVac sample Duo, GeneVac Ltd., Ipswich, United King- dom), filtered using 0.2 µm syringe filters, and derivatized and analyzed using the UHPLC/ESI-Orbitrap-MS method, as explained in Sect. 2.2.1 for seawater samples. FAA concen- trations were calculated via external calibration; each sample was measured in duplicate with a relative standard deviation
<10 % and under consideration of field blanks. For gener- ating field blanks, pre-baked aluminum foils without active sampling were cut and prepared the same as field samples, including extraction and measurements for WSOC/TDN, in- organic ions and amino acid analysis. All values presented here for aerosol particle samples are field blank corrected.
The LOQs of the individual FAAs in aerosol particle sam- ples are listed in Table S1 and are in good agreement with the sensitivity of other analytical methods for FAAs in aerosol particles (e.g., Matsumoto and Uematsu, 2005). Although a variance in LOQs between the individual FAAs is apparent, FAAs with relatively high LOQs (39.5 pg m−3) such as Ala, GABA, and Asp in submicron and supermicron aerosol par- ticles could be quantified (as discussed in Sect. 3.2 and 3.4).
The analysis of mineral dust tracers on nucleopore foils sampled with the Berner impactor was performed with the total reflection X-ray fluorescence S2 PICOFOX (Bruker AXS, Berlin, Germany) equipped with a Mo-X-ray source on polished quartz substrates, as can be seen in Fomba et al. (2013). The particulate mass (PM) of the aerosol parti- cle samples was determined by weighing the filter before and after sampling (van Pinxteren et al., 2015). Back tra- jectory analyses provided information regarding the origins of air masses. Back trajectories of 7 d were calculated on an hourly basis within the sampling intervals using the NOAA HYSPLIT model (HYbrid Single-Particle Lagrangian In- tegrated Trajectory; http://www.arl.noaa.gov/ready/hysplit4.
html (last access: 21 December 2020), 26 November 2016) in the ensemble mode at an arrival height of 500±200 m (van Pinxteren et al., 2010); van Pinxteren et al. (2020) provide more details. The calculated backward trajectories are repre- sentative of both aerosol particle sampling stations (CVAO and MV).
2.2.3 Cloud water analyses
The cloud water samples were processed the same way as seawater samples for the analysis of DOC/TDN and in- organic ions (Sect. 2.2.1). For the amino acid analysis, the volume of cloud water samples (44 mL) was reduced to several milliliters using a vacuum concentrator at T = 30◦C (miVac sample Duo, GeneVac Ltd., Ipswich, United Kingdom). After the filtration with 0.2 µm syringe filters (Acrodisc-GHP; 25 mm, Pall Corporation, New York, USA), an aliquot of the prepared cloud water was derivatized based on the AccQ-Tag™ precolumn derivatization method (Wa- ters, Eschborn, Germany). The analytical measurements of the derivatized FAAs were performed with UHPLC/ESI- Orbitrap-MS (Sect. 2.2.1). The cloud water samples were measured as duplicates with a relative standard deviation
<10 %. Via external calibration, the amino acid concentra- tions under the consideration of the cloud water blanks were calculated. The blank samples of cloud water were generated by rinsing the pre-cleaned Teflon rods with high-purity wa- ter after their installation in the cloud water sampler. Then,
the blank samples were handled the same way as the field cloud water samples, including the derivatization and ana- lytical separation, as described in Sect. 2.2.1. Overall, the LOQs of the individual FAAs in cloud water samples are in good agreement with the reported sensitivity of the FAA analysis in cloud water (Bianco et al., 2016) and listed in Ta- ble S1. Since the LOQs of the FAAs in cloud water are below 0.3 ng m−3and often below 0.06 ng m−3, a limitation of the FAA composition in cloud water due to the LOQs is rather unlikely despite the variance of FAA concentrations (11.2–
489.9 ng m−3) in cloud water (Sect. 3.3). To calculate the at- mospheric concentration of FAAs in cloud water, the mea- sured concentrations were multiplied by the measured liquid water content (LWC) of the clouds, as Fomba et al. (2015) applied previously.
2.2.4 Enrichment factors
The enrichment factor in the SML (EFSML) was calculated by dividing the concentration of the analyte in the SML with the concentration of the analyte in the ULW using the fol- lowing Eq. (1):
EFSML=c(analyte)SML
c(analyte)ULW
. (1)
Accordingly, both an enrichment in the SML with EFSML>1 and a depletion in the SML with EFSML<1 are indicated.
The FAA concentration in the ULW was assumed to be based on the concentration (LOQ/2) of individual amino acids for seawater samples from the same campaign day when individual FAAs could be quantified in the SML sam- ples but not in the corresponding ULW ones due to FAA values below the LOQs (listed in Table S1). For the cal- culation of this estimated EFSML, specially marked in the following, the concentration of 25.2 nmol L−1 was used for c(analyte)ULWin Eq. (1).
To calculate the enrichment factor of the individual ana- lytes in different matrices (M), the concentration of the ana- lyte in matrix 1 (M1) relative to the sodium (Na+) concentra- tion inM1was divided by the analyte concentration in matrix 2 (M2) relative to the Na+concentration inM2using Eq. (2):
EFM1 =
c(analyte)M1/c Na+
M1
c(analyte)M2/c Na+
M2
. (2)
The aerosol enrichment factor (EFaer) was calculated in each of the five Berner stages (Bx with x=1–5 as M1) using the respective analyte or Na+ concentration in relation to the SML or the ULW asM2. For this purpose, the aerosol particle concentrations, typically sampled at a 24 h interval, were combined with SML and ULW concentrations which had been collected during the aerosol particle sampling pe- riod. The analyte concentration in each size class of size- segregated aerosol particle samples (B1–5) was combined with the analyte concentration in SML and ULW. The cal- culation of the EFaer was limited to the availability of data
in both matrices – size-segregated aerosol particles and SML and/or ULW samples. The EFaercould only be calculated if both the analyte concentration and the sodium concentration could be quantified in the size-segregated aerosol particles and the corresponding SML and/or ULW samples. To calcu- late the enrichment factor in cloud water (EFCW), the con- centration of the analyte and of Na+in the cloud water was considered asM1and those of the SML or the ULW asM2. The determination of EFaer was possible forn=3 samples on the basis of both SML and ULW. The EFCWcould only be determined for n=1 sample though, based on the SML and/or ULW measurements. Section 3.4 discusses both the EFaerand the EFCWin more detail.
3 Results and discussion 3.1 Seawater samples
3.1.1 Free amino acids in seawater samples
Free amino acids (FAAs) were measured in the seawater as a source region of FAAs in primary marine aerosol particles.
Figure 1b shows the measured P
FAA concentration in the SML and the ULW samples, together with their enrichment factor EFSML(Eq. 1).
PFAA included all investigated amino acids (listed in Sect. 2.2.1) except for Met, Gln and GABA. As discussed in Sect. 2.2.1, GABA and Met have the highest LOQs of the analytical method used here, which may be one reason why these two analytes could not be quantified in the seawater samples (ULW and SML).
Looking at the percentage composition within the ULW (10.1 % hydrophilic, 57.0 % neutral, 32.8 % hydrophobic) and the SML (10.6 % hydrophilic, 61.7 % neutral, 27.7 % hydrophobic), the values are similar to each other. How- ever, the concentration of P
FAA varied between 0.01 and 1.10 µmol L−1 in the ULW and between 0.13 and 3.64 µmol L−1in the SML. Interestingly, in the second half of the campaign, theP
FAA concentration was higher than in the first part. Previous studies in different oceanic ar- eas (Kuznetsova and Lee, 2002; Kuznetsova et al., 2004;
Reinthaler et al., 2008; van Pinxteren et al., 2012; Engel and Galgani, 2016) have already reported a generally strong variability inP
FAA concentrations, especially in the SML.
Reinthaler et al. (2008) concluded that the SML in the open ocean is a highly variable environment with high concen- trations of dissolved FAAs and their high enrichment in the SML is without clear diel variations in their concentrations.
Nevertheless, the variance of the P
FAA concentrations in the SML and ULW observed here could neither be explained by the variance of DOC or TDN values nor by wind speed and chl a concentrations (see Fig. 1, Tables S2, S5) since no correlation between these parameters and the concentra- tion or enrichment of FAAs was found. This is consistent
with other publications which observed that the amino acid concentration in seawater is not related to environmental pa- rameters such as wind, humidity and light (Kuznetsova et al., 2004; van Pinxteren et al., 2012). The results of the in- dividual FAA concentrations in seawater (ULW, SML) and their EFSML, listed in Table S3, show clear differences be- tween the individual amino acids and the amino acid classes.
The most highly enriched amino acids in the SML are the neutral ones with values of up to 203 compared to the hy- drophilic (EFSML: 2–98) and hydrophobic (EFSML: 1–96) amino acids. This may be related to the fact that Ser, Thr and Gly, as part of the neutral amino acids, are main com- ponents of cell wall proteins (Hecky et al., 1973). The di- rect release of FAAs through cell lysis and the associated destruction of the cell wall can thus explain the increased en- richment of neutral amino acids in the SML. Our study con- firmed that the SML is often non-uniformly enriched with FAAs as outlined from previous observations (Kuznetsova and Lee, 2002; Reinthaler et al., 2008; van Pinxteren et al., 2012; Engel and Galgani, 2016). Different factors, such as the transport of FAAs from the ULW to the SML, the in situ production by an extracellular hydrolysis of CAA or a direct release of FAAs by cell lysis, probably cause the observed enrichment of FAAs in the SML. Kuznetsova and Lee (2002) showed that the rapid extracellular hydrolysis of CAAs in the SML was not the cause of the non-uniform enrichment in the SML. Moreover, they suggested that the intracellu- lar pools of organisms rich in dissolved free and combined amino acids (DFAAs and DCAAs) compared to seawater can be leached out by stressed microorganisms, resulting in the release of DFAAs which in turn influences the pools of both DFAAs and DCAAs in seawater. Based on previous stud- ies, the transportation and releasing mechanisms seem most likely to be the reasons for the observed enrichment of FAAs.
However, further experiments are required to finally eluci- date the most important drivers causing the enrichment.
Altogether, it can be concluded that there is some vari- ability in the FAA concentration in the SML and in the ULW with a clear trend of its strong enrichment in the SML.
The fact that the FAA concentrations were in accordance with the ones measured at the same location in Novem- ber 2013 (0.64 µmol L−1; Table S4) supports the suggestion that the FAA concentrations reported here can be consid- ered representative of the NATR region as part of the North Atlantic Ocean. These concentrations are generally similar when comparing them to FAA concentrations in other ma- rine regions (Kuznetsova and Lee, 2002; Reinthaler et al., 2008). Reinthaler et al. (2008) considered concentrations of dissolved FAAs of 0.02–0.13 µmol L−1(ULW) and of 0.43–
11.58 µmol L−1(SML) in the subtropical Atlantic Ocean, as well as values of 0.07–0.60 µmol L−1 (ULW) and of 0.77–
3.76 µmol L−1 (SML) in the western Mediterranean Sea.
Consequently, the FAA concentrations in the NATR region, with its very low surface chlorophyll and a greater annual than seasonal variability are on the same order of magnitude
Figure 1. (a)DOC, TDN and chlaconcentrations in seawater and wind speed and(b)individual FAA concentration in the seawater samples and the enrichment factor EFSMLofP
FAA. EFSMLis based on measurements (black stars), EFSMLis based on LOQ/2 estimation (gray stars).
compared to other marine regions (i.e., subtropical Atlantic and western Mediterranean Sea; Reinthaler et al., 2008).
3.1.2 Contribution of FAAs to DOC and TDN content in seawater
DOC and TDN concentrations and their enrichment in the SML (EFSML) are listed in Table S5. The contribution of PFAA to DOC or TDN in seawater has been calculated (taking into account the carbon and nitrogen content of the amino acids; Table S6) and is also listed in Table S5. The carbon content ofP
FAA contributed to the DOC with val- ues between 0.1 % and 7.6 % in the seawater samples and a median of 2.4 % (n=17), differing between 2.8 % (n=11) in the SML and 1.8 % (n=6) in the ULW samples. Looking at the nitrogen content fromP
FAA to TDN in the seawa- ter samples, 0.1 %–42.4 % of the TDN consisted of P
FAA with a median of 8.3 % (n=18). In the SML,P
FAA con- tributed on average 11.9 % (n=11) to TDN, whereas they contributed in the ULW 3.2 % (n=7). The observed daily variations within the contribution of P
FAA to DOC/TDN,
result from the daily variations inP
FAA concentrations in seawater (Fig. 1) and of DOC/TDN (Table S5). In the SML of the Atlantic Ocean and the western Mediterranean Sea, the DFAAs contributed∼12 % of the DOC and∼30 % of the dissolved organic nitrogen (DON) (Reinthaler et al., 2008).
Our results regarding the contribution to DOC were of the same order of magnitude but slightly lower than those of Reinthaler et al. (2008).
3.2 Size-segregated aerosol particles
3.2.1 Size-segregated aerosol particles at the CVAO First indications for aerosol particle origin
To obtain a first indication of the particle origin that might help to explain the differences in the particle composition concerning amino acids, the particles were associated with the origin of the air masses and with marine and dust tracers.
Overall, the CVAO station experienced northeasterly trade winds during this campaign, which are typical for this sea-
son within this region (Fomba et al., 2014; van Pinxteren et al., 2020). According to physical and chemical specifications such as the air mass origins, particulate MSA concentrations and MSA/sulfate ratios, as well as particulate mass concen- trations of dust tracers, aerosol particles predominantly of marine origin with low to medium dust influences were ob- served. The dust and marine tracers of the aerosol particles considered here are discussed in more detail in the Supple- ment (Table S8 and in “aerosol particles: dust and marine tracers”). Further information on the classification of the air masses and distinct concentrations of dust tracers are given in the overview paper of this campaign (van Pinxteren et al., 2020).
Free amino acids in size-segregated aerosol particles:
concentrations
The lower panel of Fig. 2b shows the atmospheric concen- tration of FAAs in each Berner stage at the CVAO, whereas the upper panel represents the concentration in the submi- cron, the supermicron and PM aerosol particle size ranges. In the submicron aerosol particles, the concentration ofP
FAA was between 1.3 ng m−3 (1 October 2017) and 6.3 ng m−3 (7 October 2017). While the concentration P
FAA varied between 0.2 ng m−3 (6 October 2017) and 1.4 ng m−3 (22 September 2017) in the supermicron size range, the highest atmospheric concentrations ofP
FAA were found in the sub- micron aerosol particles (mean of 3.2 ng m−3) compared to the supermicron ones (mean of 0.6 ng m−3). Daily variations in the P
FAA content of the investigated size-segregated aerosol particle samples were observed; the P
FAA tended to increase slightly throughout the campaign. OM parameter- ization studies showed that wind speed and chlaconcentra- tions were the most important parameters for the regulation of the OM production in sea spray aerosol particles (Gantt et al., 2011; Rinaldi et al., 2013; van Pinxteren et al., 2017).
Correlations between theP
FAA concentrations of the size- segregated aerosol particles (considered as submicron, super- micron and PM10) and the wind speed were not observed for data reported here (Fig. 2, Table S2). However, the available wind speed and wind direction data represented an average value of 24 h. Therefore, short, pronounced changes in the wind speed that might have affected the amino acid trans- fer would not have been visible in the averaged wind speed value. The major source of bubbles is whitecaps or breaking waves that occur when the wind speed exceeds 3–4 m s−1 (Blanchard, 1975), which was continuously reported during the campaign. Hence, the high wind speeds, together with the constantly observed breaking waves, indicated that the wind intensity in this region might be consistently sufficient to transfer the amino acids from the ocean into the atmo- sphere. No significant correlation could be observed between theP
FAA concentration of size-segregated aerosol particle samples (submicron, supermicron and PM10) and the chla concentration in seawater. Nevertheless, the increasing chl
aconcentration throughout the campaign (Fig. 2, Table S2) could be a reason for the slight increase in the concentrations of PFAA in seawater and in submicron aerosol particles, indicating a possible connection between ocean and atmo- sphere, e.g., the transfer of amino acids from the ocean into the atmosphere.
Overall, the concentrations reported here agree well with other FAA studies on marine aerosol particles. Matsumoto and Uematsu (2005) found averaged total concentrations of dissolved FAAs of 4.5 ng m−3in aerosol particles (average of<2.5 and >2.5 µm) in the western North Pacific Ocean.
Moreover, Wedyan and Preston (2008) observed an average concentration of dissolved FAA of 2.5 ng m−3 on total sus- pended particles (TSPs) during a transect ship cruise in the Atlantic Ocean. For Antarctic aerosol particles, the observed mean total FAA concentration in size-segregated aerosol par- ticle samples (<0.49–10 µm) at the Mario Zucchelli Station was 4.6 ng m−3(Barbaro et al., 2015). Hence, regarding the sum of FAAs, a striking similarity was found between FAA concentrations in different parts of the ocean that proba- bly underlay different influences (e.g., pristine region in the Southern Ocean, continental-influenced aerosol particles in the North Pacific Ocean).
Free amino acids in size-segregated aerosol particles:
composition
PFAA included all investigated amino acids (listed in Sect. 2.2.1) except for Met and Gln, analytes which were not detected in the size-segregated aerosol particle samples. The most abundant FAA was Gly, which was consistently found in submicron and supermicron aerosol particles, followed by Ala and Ser. However, towards the end of the campaign (4–7 October 2017), a high contribution of the hydrophilic FAAs GABA and Asp was detected (shown in the upper panel of Fig. 2b), which caused the slight increase in the total FAA concentration.
The higher complexity of the FAA composition in the submicron aerosol particles could only be determined be- cause the analytical method applied here was able to quantify the individual molecular FAA species. Such differentiation would not be possible with methods that determine the pro- teins as a sum parameter (e.g., the often applied Bradford method).
The high abundance of Gly in the aerosol particles is in good agreement with the Gly occurrence in other marine studies. Gly seems to be the dominant FAA, independent of whether the particles were sampled in the Arctic (Scalabrin et al., 2012), Antarctic (Barbaro et al., 2015) or in the North Pa- cific (Matsumoto and Uematsu, 2005) or whether they were attributed to a local marine source (Wedyan and Preston, 2008; Barbaro et al., 2015) or were rather under continental or long-range influences (Matsumoto and Uematsu, 2005).
Other abundant FAAs reported at the different locations are arginine (not analyzed here), Ser and Ala; the latter ones are
Figure 2. (a)Overview of wind speed and wind direction at the CVAO and the chlaconcentration in seawater;(b)atmospheric concentration of individual FAAs: sum of all Berner stages (B1–5) in the submicron and supermicron size ranges (upper panel) and the atmospheric concentration of FAA in all individual Berner stages (lower panel) during the campaign at the CVAO
also dominant FAAs found in the study here reported. Con- sequently, the usage of the major FAAs as chemical biomark- ers seems to be restricted to some extent due to their lack of source specificity. The high abundance of GABA found in the second half of the campaign has neither been partly re- garded (i.e., included as a standard compound) in some ma- rine studies nor yet been reported in ambient marine aerosol particles but seems to be special for this location. However, the reasons for the high concentration of hydrophilic FAAs within these respective sampling days remain unclear since no change in the environmental parameters determined (e.g., wind speed, wind direction, chlaconcentration; Fig. 2a) was observed. In addition, we considered further FAA physico-
chemical parameters, such as the octanol–water partition co- efficient (KOW), the topological polar surface area (TPSA), which describes the surface activity, and the density (Ta- ble S9), to describe the concentration changes. However, no statistically relevant correlations between the FAA concen- tration or composition and physicochemical parameters were found here either. Our observations could not clarify possi- ble additional (i.e., non-marine) sources leading to the higher concentrations and complexity in the FAA composition. The dynamics behind the varying FAA concentrations and com- positions at this location seem to be complex.
Following this hydropathy classification, the submicron aerosol particles consisted on average of 5 % hydrophobic,
15 % hydrophilic and 80 % neutral amino acids, while the supermicron aerosol particles contained on average only 7 % hydrophobic and 93 % neutral amino acids (Table S7). Dur- ing the campaign, an increase in the contribution of hy- drophilic amino acids was observed with a maximum of 55 % on 7 October 2017. Barbaro et al. (2015) reported that hy- drophilic components were predominant (60 %) in locally produced marine Antarctic aerosol particles, whereas hy- drophobic compounds were the rather dominant aerosol par- ticles collected at the continental station (23 % and 27 %).
The relatively high content of hydrophilic FAAs during cer- tain periods of the campaign points at least to some influence of local oceanic sources.
Contribution of FAA to WSOC and water-soluble organic nitrogen
In consideration of the carbon or nitrogen content of the amino acids (Table S6), the contribution ofPFAA to WSOC and water-soluble organic nitrogen (WSON) in the size- segregated aerosol particles was calculated (Table S10). In the submicron size range, P
FAA contributed up to 5.3 % (average 1.1 %) to WSOC, while in the supermicron range, PFAA only contributed up to 0.04 % to WSOC. Looking at P
FAA’s total contribution to WSOC (PM10), 0.7 % of WSOC consists ofP
FAA, which is in good agreement with the value of the study by Mandalakis et al. (2011). Consid- ering the nitrogen content of the amino acids, P
FAA con- tributed to the estimated WSON (WSON=25 % of mea- sured TDN concentrations according to Lesworth et al., 2010) an average of 0.4 % in the submicron and of 0.05 % in the supermicron size ranges. The observed daily variations in the contribution ofPFAA to WSOC/WSON were derived from the daily variations in the atmospheric concentrations of PFAA (Fig. 2) and of WSOC/ WSON (Table S10). In sum- mary, P
FAA contributed up to 5.3 % to WSOC and 1.8 % to WSON when it comes to the submicron aerosol particles (7 October 2017) and up to 0.15 % to WSOC and 0.1 % to WSON for the supermicron aerosol particles. These percent- ages were on the same order of magnitude as for other or- ganic compound groups, e.g., amines. It was shown by van Pinxteren et al. (2019) that amines contributed on average 5 % to the submicron WSOC content in marine aerosol par- ticles. The percentage ofP
FAA to WSOC (up to 5.3 %) in the submicron aerosol particles especially demonstrated that FAA comprised a substantial fraction of submicron WSOC in marine aerosol particles.
3.2.2 Size-segregated aerosol particles at MV
From the MV samples, FAAs and additional parameters such as PM, WSOC, sodium and MSA were investigated.
The results are listed in Table S11. The submicron aerosol particles at MV had an averaged P
FAA concentration of 1.5 ng m−3(0.8–1.9 ng m−3) which was about 3 times lower
compared to the P
FAA concentration at the CVAO. The PFAA concentration in the supermicron aerosol particles at MV (1.2 ng m−3; 0.2–2.9 ng m−3) was similar to the respec- tive concentration at the CVAO. Additional online measure- ments of particle size number distributions (PSNDs) at the CVAO and MV, described in Gong et al. (2020), were in good agreement with one another during cloud-free times. This in- dicated that, for cloud-free conditions, the aerosol particles measured at ground level (30 m) within the IBL, which is mainly below 30 m (Niedermeier et al., 2014), represented the aerosol particles at cloud level. Thus, the aerosol par- ticles within the marine boundary layer (MBL) were well mixed, and Mt. Verde was most of the time within the MBL (van Pinxteren et al., 2020). However, as described above, the Berner measurements were (continuously) taken during cloud-free and during cloudy times. The concentration and composition of the aerosol particles can therefore be affected by the clouds that formed and disappeared consistently dur- ing the sampling period of the aerosol particles on Mt. Verde (for further details on the frequency of the cloud events see Gong et al., 2020, and van Pinxteren et al., 2020). There was also no rain during the entire campaign. Furthermore, aging processes may occur during the upwind of the aerosol parti- cles from the CVAO to the MV station, which takes about 4 h considering an average vertical wind of 5 cm s−1(van Pinx- teren et al., 2020). The particles at MV exhibited lower parti- cle masses, as well as lower concentrations of the aerosol par- ticle constituents. The decrease in concentrations ofP
FAA, PM, sodium, MSA and WSOC was reduced by a factor of 3 to 4 with respect to the submicron aerosol particles. How- ever, no uniform depletion ratio between their concentrations at the CVAO and MV was found for the supermicron aerosol particles (Table S11). While the PM of the supermicron par- ticles was reduced by a factor of 4 at MV (similar to the sub- micron aerosol particles), sodium and WSOC were depleted more strongly (factor of 11–12) compared to their respective concentrations at the CVAO. This suggests that the submi- cron particles were rather uniformly affected and depleted, likely by cloud processes, while the supermicron particles were influenced by clouds, and potentially other sources, in a non-uniform way. Nevertheless, the abundance of the marine tracers (sodium, MSA), together with the presence of FAAs in the aerosol particles (which mainly had a similar compo- sition compared to the oceanic and ground-based particulate FAAs), indicated an oceanic contribution to the aerosol par- ticles at cloud level.
3.3 Cloud water samples
The concentration of FAAs in cloud water (Fig. 3, Table S12) was, although varying, always significantly higher than the aerosol particles (Table S8) and several orders of magnitude above the LOQs (Table S1). The individual atmospheric con- centration of FAAs in cloud water was calculated based on the measured liquid water content (LWC) (Sect. 2.2.3 and
Table S12). TheP
FAA concentrations varied strongly be- tween 11.2 and 489.9 ng m−3, as shown in Fig. 3.
The inorganic marine tracers in cloud water (Na+: 5.7 µg m−3; MSA: 25.1 ng m−3; Table S12) were also present in higher concentrations compared to the aerosol particle samples at the CVAO (submicron: Na+: 72.3 ng m−3; MSA:
6.0 ng m−3) and MV (submicron: Na+: 17.0 ng m−3; MSA:
1.8 ng m−3; Table S11). The concentrations of cloud water sulfate (average: 2.9 µg m−3; Table S12) and sodium were higher than in cloud water samples collected at East Peak in Puerto Rico, which can be seen in Gioda et al. (2009).
Our observed carbon concentration of FAAs in cloud wa- ter at the MV station was between 17 and 757 µg C L−1and on the same order of magnitude as in a previous study of cloud water sampled on top of the Puy de Dôme moun- tain, inland of France (211±19 µg C L−1; Bianco et al., 2016), but showed a higher variance. Besides the concentra- tion, the composition of FAAs in cloud water also showed a high variability in the study presented here. In cloud water samples with PFAA<65 ng m−3, Gly was usually domi- nant, followed by Ser. However, cloud water samples with PFAA>290 ng m−3 showed a higher complexity in FAA composition, including the concentrations of Asp and Ala.
Other abundant FAAs were Thr, Leu and Ile. In terms of the hydropathy classification, the first part of the campaign (27 September–5 October 2017) was dominated by neutral FAAs, whereas a sudden increase in the hydrophilic FAAs was observed in its second part (6–8 October 2017). Compar- ative studies on the FAA composition of cloud water in the marine environment are lacking, but especially in the second part of the campaign, it pointed to a local marine (biogenic) influence. The high concentrations of Asp might be related to diatoms and zooplankton in seawater (Hammer and Kattner, 1986). Scalabrin et al. (2012) reported local marine sources for Ile, Leu and Thr detected in aerosol particles, whereas Mashayekhy Rad et al. (2019) suggested coastal and ma- rine phytoplankton and bacteria as possible sources for these amino acids. Therefore, the FAA composition might be re- lated to an oceanic transfer via bubble bursting and/or mi- crobial in situ production. Interestingly, GABA, which was highly abundant in the aerosol particles maybe due to bio- genic production, was not present in the cloud water samples.
The presence of the marine tracers (sodium, MSA) in cloud water supports a coupling to oceanic sources. In addition, the majority of low-level clouds were formed over the ocean, and ocean-derived components are expected to have some influ- ence on cloud formation (van Pinxteren et al., 2020). Never- theless, contributions from the desert and other non-marine sources cannot be excluded.
The reason for the high concentrations of FAAs in cloud water (compared to the oceanic and aerosol particle concen- trations) remains speculative to date and will be the subject of further studies. Altogether, the in situ formation of FAAs in cloud water by chemical abiotic processes in the cloud or by atmospheric biogenic formation, as proposed by Jaber Jaber
et al. (2020), as well as by selective enrichment processes and pH-dependent chemical reactions, might be potential ad- ditional sources besides aerosol particles.
3.4 Concerted measurements of FAA in the marine compartments (seawater, aerosol particles and cloud water)
Only a few studies which concern the simultaneous inves- tigation of FAAs in the marine compartments – seawater, aerosol particles and cloud water – using concerted measure- ments are present to date; most of them measured artificially the aerosol particles generated. Kuznetsova et al. (2005) characterized proteinaceous compounds in marine ambient aerosol particles, in generated aerosol particles and in corre- sponding SML samples. Rastelli et al. (2017) investigated the transfer of OM (sum parameter for lipids, carbohydrates and proteins) from the ocean surface into marine aerosol particles under controlled conditions using a bubble-bursting experi- mental system. In previous studies, the transfer of microor- ganisms from the ocean to the aerosol particles could be re- ported (Aller et al., 2005; Pósfai et al., 2003), and even in submicron marine aerosol particles, viruses and prokaryotes were present (Rastelli et al., 2017).
Within the study presented here, a simultaneous sam- pling of all marine matrices – seawater (ULW, SML), size- segregated aerosol particles (CVAO, MV) and cloud water samples – could be obtained for a period between 4 and 7 Oc- tober 2017 comprising six blocks of size-segregated aerosol particles (three at the CVAO and three at MV), three seawa- ter samples (three SML and three ULW) and one cloud water sample (7 October 2017; 07:48–11:48 local time, GMT−1).
For these sampling intervals, the fractional residence time of the air masses was mainly above water, and the mass concen- tration of trace metals and inorganic marine tracers (sodium, MSA) (Table S8) strongly suggests a dominant marine origin of air masses. Sources other than marine (dust, continental) are, by contrast, of minor importance during this sampling period. The averaged values of these sampling days represent a case study to combine and compare the FAAs in all matri- ces to investigate a possible transfer of FAAs from the ocean into the atmosphere and a possible transport of FAAs within the atmosphere. The comparability of the different matri- ces (e.g., seawater samples as a spot sample, aerosol particle samples covering a 24 h period) is discussed in Fig. S2.
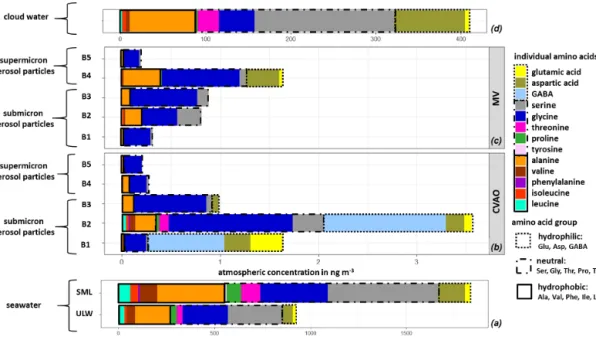
The averaged FAA composition of this case study in all marine compartments is shown in Fig. 4. The high com- plexity of FAAs observed in seawater was also found in the aerosol particles, as well as in cloud water, and generally shows a high similarity between FAAs in the different com- partments. All marine compartments contained Gly, Ser, Glu and Ala as dominant species, i.e., representatives of the hy- drophilic, neutral and hydrophobic groups. However, the per- centage contribution of the individual FAAs to theP
FAA varies within the different compartments.
Figure 3.Concentration of individual FAAs in cloud water samples at the MV station (in ng m−3). The time represents the local start and end times of the cloud water sampling.
Figure 4.Case study: individual FAA concentrations in(a)seawater samples (ULW, SML; in nmol L−1), in(b)size-segregated aerosol particle samples at the CVAO and(c)at the MV station (size range: 0–4 ng m−3) and in(d)cloud water samples (size range: 0–400 ng m−3).
Representatives of the hydrophilic, neutral, hydrophobic and aromatic amino acids are discussed below with respect to their distribution within the different marine matrices and with respect to a potential transfer. For a better comparison of the individual amino acids, the mean life time τ of the amino acids in the CVAO (“remote aerosol case”) and in the MV (“remote cloud case”) aerosol particle samples was con- sidered, as described in Table S13. The mean life timeτ of the individual amino acids depends on the pH-dependent rate constant k and the OH radical concentration of the different atmospheric scenarios (Supplement, Eq. 3).
3.4.1 Hydrophilic amino acids
The hydrophilic amino acids (Asp, Glu, GABA) comprised a significant fraction in the ULW and the SML, as well as in the (submicron) aerosol particles and in cloud wa- ter (Fig. 4a–d). They were not detected in the supermicron aerosol particles. A conspicuous finding is the high concen- tration of GABA, which is present exclusively in the sub- micron aerosol particles (B1 and B2: 0.05–0.42 µm) at the CVAO. Despite the relatively high LOQ of GABA in sea- water (Table S1), a major abundance of GABA in seawater
would be detectable. GABA is a metabolic product of the microbiological decarboxylation of Glu, which has been de- tected in all marine compartments. Active microbial enzymes on nascent sea spray aerosol have recently been reported by Malfatti et al. (2019). The abundance of GABA in the sub- micron aerosol particles suggests that either GABA could have been produced by the microbiological decarboxylation of Glu by present (marine) microorganisms in the aerosol particles or that GABA was transferred from the seawater to the atmosphere. However, GABA could not be found in sea- water (ULW and SML), and this is not related to the sensitiv- ity of the analytical method. Hence, a very enhanced oceanic transfer of GABA would be needed to explain this finding.
Such an enhanced transfer was, however, not observed for the other hydrophilic amino acids (Glu and Asp), and their percentage composition was not strongly different regarding seawater and submicron aerosol particles at the CVAO. Un- less the oceanic transfer of GABA is very different compared to other hydrophilic amino acids, this pathway does not ex- plain the high abundance of GABA in the submicron aerosol particles at the CVAO.
Together with the facts that GABA is a known indicator for the microbiological decomposition of OM (Dauwe et al., 1999; Engel et al., 2018) and microorganisms are known to be present in marine aerosol particles even in the submicron size range (Rastelli et al., 2017), the formation of GABA in the aerosol particles might be related to an in situ formation.
Interestingly, GABA was not detected in cloud water sam- ples, although bacteria were found during the campaign in cloud water (van Pinxteren et al., 2020) whose presence has been reported in the literature (Jardine, 2009; Vaïtilingom et al., 2013; Jiaxian et al., 2019). It remains speculative whether GABA was degraded in cloud water despite its rather long lifetime (remote cloud case: 28.8 h; Table S13) or whether it was not produced by the bacteria in cloud water. Asp has been detected in all marine compartments and showed high cloud water concentrations. Correlations between Asp with diatoms and zooplankton have been reported for the marine environment (Hammer and Kattner, 1986). Hence, the occur- rence of Asp in the marine environment can be attributed to a biogenic origin, while the high concentrations of Asp in cloud water (Figs. 3 and 4d) might be related to an oceanic source. In the Antarctic, Barbaro et al. (2015) attributed the hydrophilic amino acid fraction mainly to locally produced aerosol particles. According to the biogenic sources of the hydrophilic acids and their characteristics observed here, a local marine source for Asp and Glu, together with the bio- genic formation of GABA in the aerosol particles in the Cabo Verde islands, could be prevalent.
3.4.2 Neutral and hydrophobic amino acids
Neutral amino acids were generally the amino acid group with the highest concentration in all investigated marine compartments, accounting for more than 50 % of the FAA
total (Fig. 4a–d). Ser and Gly were the dominant representa- tives of this group. It is remarkable that especially the aerosol particles in the larger size range (e.g., supermicron aerosol particles: B4, B5) at both sampling stations are less com- plex in amino acid composition and almost exclusively dom- inated by Gly, followed by Ser and Ala (Fig. 4b, c). Gly is discussed in the literature as a photochemical degradation product of other existing amino acids, and this comparatively more stable amino acid (Gly) thus becomes a major compo- nent of the FAA composition (Barbaro et al., 2015). Com- pared to other amino acids, Gly and Ser have a very low at- mospheric reactivity (McGregor and Anastasio, 2001) and therefore a higher mean lifetimeτ (Gly: 0.48 h; Ser: 0.24 h;
remote aerosol case; Table S13). Due to its atmospheric sta- bility, Gly is proposed as an indicator for long-range trans- port (Barbaro et al., 2015, and references therein) and has a very low atmospheric reactivity (McGregor and Anastasio, 2001). However, our results clearly show that Gly and Ser are also present in seawater to a high extent, likely result- ing from the siliceous exoskeleton of diatom cell walls (e.g., Hecky et al., 1973). Hence, besides long-range transport, a transfer from the ocean via bubble bursting might be an ad- ditional likely source of the stable, long-lived FAAs in the atmosphere. The neutral amino acid Pro has been reported to be of biogenic origin in the marine environment and was detected in seawater (Fig. 4a), in submicron aerosol particles at the CVAO (Fig. 4b) and in cloud water (Fig. 4d). Fischer et al. (2004) demonstrated that Pro can be used to identify the presence of algal spores in aerosol particles and might thus be used as a tracer for an oceanic source. The pres- ence of Pro in all marine compartments suggests a transfer from the ocean into the atmosphere up to cloud level. This is supported by the comparatively low atmospheric reactivity of Pro (remote aerosol case: 0.24 h; Table S13). Finally, the hydrophobic FAAs Ile, Leu and Thr were found in all ma- rine compartments in low concentrations. They are classified as relatively reactive amino acids and their abundance has been attributed to local or semi-local sources consequently (e.g., Mashayekhy Rad et al., 2019). Their low but constant abundance in all marine matrices again indicates a bubble- bursting transfer.
3.4.3 Aromatic amino acids
Aromatic FAAs like Phe and Tyr were present in seawater but not in the aerosol particles nor in cloud water samples. It could be assumed that either these aromatic FAAs were not transferred from the ocean into the atmosphere, they reacted already after their transfer due to chemical transformation re- actions, or they were not detected because of their low atmo- spheric concentration. The mean lifetimesτ of Phe (0.014 h) and Tyr (0.007 h) (Table S13) showed that both FAAs had a comparatively high atmospheric reactivity (τ <1 min) in re- mote aerosol case conditions. Hence, a rapid chemical re- action of these compounds is most likely. Moreover, previ-
ous studies reported low atmospheric concentrations of Tyr and Phe in aerosol particles. Barbaro et al. (2011) found Phe (0.5 ng m−3) and Tyr (0.3 ng m−3) with a contribution of <1 % toPFAA (PFAA: 42.5 ng m−3) on TSP samples in the urban background (Venice, Italy). In our study at the CVAO, the mean value ofP
FAA in PM10 aerosol particles was 3.8 ng m−3(Sect. 3.2). Assuming that Phe and Tyr were contributing a very small fraction to P
FAA, as reported in Barbaro et al. (2011), their concentrations would be below the detection limit and would thus probably not be detected.
It can be concluded that either the aromatic FAAs could not be quantified in aerosol particles due to the sensitivity of the analytical method used here or they could react very quickly in the atmosphere and would therefore not be detected.
3.4.4 Transfer of amino acids from the ocean into the atmosphere
A high similarity regarding the FAA species within the differ- ent marine compartments could be observed, although some differences could also be identified (e.g., GABA). Together with the high concentration of ocean-derived compounds (Na+, MSA) in the aerosol particles and cloud water, this indicates a coupling between the FAAs in the ocean and the atmosphere. A quantitative metric for comparing compounds in the ocean and in the atmosphere is the EFaer(Eq. 2). The concept is mainly applied to closed systems (e.g., Quinn et al., 2015; Rastelli et al., 2017) because FAA formation or degradation pathways in the aerosol particles including bio- logical or photochemical atmospheric reactions, and possible transport from sources other than marine, are excluded in this parameter. However, for comparison purposes, it might be useful to calculate the EFaeralso from open systems, as done, e.g., by Russell et al. (2010) or van Pinxteren et al. (2017).
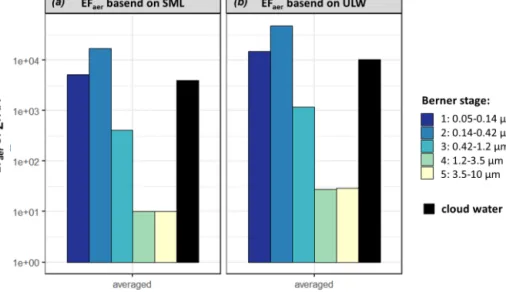
The averaged EFaerofPFAA in the individual Berner stages of the case study at the CVAO based on SML and ULW con- centrations are shown in Fig. 5.
The EFaerofP
FAA, based on SML, were in the supermi- cron size range (1×101, B5, 1×101, B4) and several orders of magnitude smaller than in the submicron range (4×10², B3, 2×10⁴, B2, 5×10³, B1). Furthermore, the calculated EFaer, based on ULW, was up to 1 order of magnitude higher in the aerosol particles than the EFaer, based on the SML.
This is due to the different FAA concentrations in seawa- ter (Sect. 3.1) as the sodium values were very similar at 12.45 g L−1in the ULW and 12.53 g L−1in the SML. It was shown by van Pinxteren et al. (2017) that the EFaer of the WSOC in the submicron marine ambient aerosol particles at Cabo Verde ranged between 103and 105. The averaged EFaer of the WSOC during our campaign was between 2×10³and 1×10⁴in the submicron range, between 3×10²and 4×10² in the supermicron range (Table S14), and in good agreement with van Pinxteren et al. (2017). Comparing the EFaer of PFAA (1×101–2×10⁴) with the EFaerof WSOC (1×101– 2×10⁴)in the submicron range, both EFaervalues are on the
same order of magnitude. Moreover, similar percentages of PFAA were observed for the DOC in the SML (up to 7.6 %) (Sect. 3.1) and for the WSOC in submicron aerosol particles (up to 5.3 %) (Sect. 3.2).
Previous studies have shown that OM ejected into the at- mosphere during bubble bursting results in the formation of sea spray aerosol particles containing OM similar to SML (Russell et al., 2010; Cunliffe et al., 2013, and references therein). Especially the film droplets have been reported to be enriched in OM and are suggested to transfer OM from the SML into submicron aerosol particles (Wilson et al., 2015). The supermicron aerosol particles tend to form from the larger jet droplets and thus represent the ULW composi- tion (Blanchard, 1975; Wilson et al., 2015). We cannot derive mechanistic transfer characterizations from the ambient mea- surements performed here. Nevertheless, the constant FAA enrichment in the SML, together with the strong FAA en- richment in the submicron aerosol particles, strongly sug- gests that film droplets form the submicron particles. How- ever, Wang et al. (2017) showed that jet drops (which transfer OM from the ULW) also have the potential to contribute sig- nificantly to the formation of submicron sea spray aerosol particles; so jet droplets can also contribute to FAA forma- tion.
Applying the concept of the enrichment factor to cloud wa- ter and calculating the EFCW(Eq. 2), EFCW(PFAA)=4×10³ (based on SML) and 1×10⁴(based on ULW) could be de- termined. As mentioned in Sect. 3.3, several atmospheric processing (aging), oceanic transfer and biogenic-driven pro- cesses might contribute to this high enrichment and need to be addressed in future studies. The high FAA concentrations and enrichments might have implications for OM processing through clouds and are worth further studying.
4 Conclusion and outlook
Concerted measurements, i.e., simultaneous measurements of seawater, size-segregated aerosol particles and cloud wa- ter samples during the MarParCloud campaign at the CVAO and MV stations, allowed us to investigate FAAs on a molec- ular level, which are important contributors to marine OM.
The similarities between the FAA composition in the seawa- ter (SML) and in the submicron aerosol particle samples, as described in Sect. 3.4, indicated that a certain FAA contribu- tion, in particular the hydrophilic amino acids Asp and Glu in the submicron aerosol particles at the CVAO, was proba- bly caused by sea spray and might be transferred up to cloud level. The neutral and hydrophobic amino acids were also present in all marine compartments, suggesting some inter- connections. Stable amino acids like Gly are often reported as long-range tracers, but their abundance in seawater and marine air masses prevailing during the sampling period sug- gests an (additional) oceanic source. The oceanic link is sup- ported by a high atmospheric concentration of ocean-derived