Characterization of altered cytokine production by memory CD4 T cells in NZBxW murine model of SLE
D I S S E R T A T I O N
zur Erlangung des akademischen Grades D o c t o r r e r u m n a t u r a l i u m
(Dr. rer. nat.) im Fach Biologie
eingereicht an der
Lebenswissenschaftlichen Fakultät der Humboldt-Universität zu Berlin
von
Anaida Abajyan, MD
Präsidentin der Humboldt-Universität zu Berlin Prof. Dr.-Ing. Dr. Sabine Kunst
Dekan der Lebenswissenschaftlichen Fakultät der Humboldt-Universität zu Berlin Prof. Dr. Bernhard Grimm
Gutachter: 1. Prof. Dr. Andreas Radbruch 2. Dr. Michal Or-Guil
3. Prof. Dr. Falk Hiepe
Tag der mündlichen Prüfung: 7 Mai 2019
Acknowledgement
I Acknowledgement
I am very grateful to all those people, who supported me with this work. These are Prof. Dr. Ria Baumgrass, Dr. Melanie Venzke, Dr. Paul Hammer, Dr. Martin Karl, Dr. Timo Lischke, Dr. Tobias Scheel, Yen Hoang, Stefanie Gryzik, Dr. Manja Jargosch, Dr. Katharina Hecklau, Dr. Christian Gabriel and also many master and bachelor students of our group. I also thank all workers of German Rheumatism Research Centre (DRFZ), especially Prof. Dr. Andreas Radbruch, Dr.
Andrey Kruglov, Dr. Tobias Alexander, Dr. Jens Humrich, Prof. Dr. Gabriela Riemekasten as well as the workers of FACS facility and administration, veterinarians, animal care takers, laboratory managers and “Medienküche”. For financial support, I thank German Academic Exchange Service (DAAD), the foundation of the state parliament of Berlin-City, DRFZ and Charité-
Universitätsmedizin zu Berlin (SFB-650). A special thank goes to my family and friends for their permanent support and motivation.
Zusammenfassung
II
Zusammenfassung
Der systemische Lupus erythematodes (SLE) ist eine Autoimmunerkrankung, bei der eine Vielzahl an Organen betroffen sein kann. Hierbei spielen T-Zellen mit gestörter
Zytokinproduktion, insbesondere von IL-2 und IFN-γ, eine besondere Rolle. Mit Fortschreiten der Krankheit sinkt die Anzahl an IL-2-Produzenten und gleichzeitig steigt die Anzahl an IFN-γ- Produzenten. Während die Rolle von IFN-γ in SLE bisher kontrovers diskutiert wird, wirkt sich die verringerte Produktion von IL-2 beispielsweise negativ auf regulatorische T-Zellen aus, was zur Pathogenese der Krankheit beiträgt.
In dieser Arbeit erfolgte eine Charakterisierung der Zytokinproduzierenden CD4+ Gedächtnis- T-Zellen in erkrankten NZBxW Mäusen, einem Modell für SLE. Anhand der Produktion von IL-2 und/oder IFN-γ wurde dabei in DN (IFN-γ—IL-2—doppelt negative), IL-2 SP (IFN-γ—IL-2+
einzelpositive), DP (IFN-γ+IL-2+ doppelt positive) und IFN-γ SP (IFN-γ+IL-2—einzelpositive) Zellen unterschieden. Ein mehrstufiges Verfahren der Zellsortierung ermöglichte die Isolierung der vier Zellpopulationen. Genexpressionsanalysen legten offen, dass die während der Krankheit vermehrt vorkommende Population der IFN-γ SP Zellen im Vergleich zu DP Zellen deutliche Unterschiede in ihrem Genexpressionsmuster aufweist. IFN-γ SP Zellen exprimieren u.a.
verstärkt Chemokinrezeptoren, co-stimulatorische und co-inhibitorische Moleküle, sowie Apoptose-Marker und zeigen eine verminderte Produktion von Effektorzytokinen.
Weiterführende funktionelle Analysen untermauerten die Expressionsdaten und zeigten eine verminderte Proliferationsfähigkeit und verstärkte Apoptose der IFN-γ SP Zellen. Die Daten zeigen, dass der Phänotyp der IFN-γ SP Zellen in erkrankten NZBxW Lupus-Mäusen gestört ist, wodurch die IFN-γ SP Zellen zur Erkrankung beitragen könnten.
Summary
III Summary
Systemic lupus erythematosus (SLE) is an autoimmune disease, which can affect almost every organ system of the body. Thereby altered cytokine production by T cells plays an important role in the pathogenesis of the disease. With disease progression, production of IL-2 decreases and production of IFN-γ increases. It has been shown that IL-2 deficiency affects TREG
homeostasis in SLE and thus contributes to its pathogenesis. The role of IFN-γ in SLE is, however, controversial.
In this work, a comprehensive characterization of four subpopulations of memory CD4 T cells of diseased NZBxW lupus-prone mice was performed. These cell subsets are DN (IFN-γ—IL-2— double negative), IL-2 SP (IFN-γ—IL-2+ single positive), DP (IFN-γ+IL-2+ double positive) and IFN-γ SP (IFN-γ+IL-2—single positive) cells. A multi-step cell sorting procedure was used to isolate these cell subsets. The data showed that IFN-γ SP cells were characterized by a different gene expression profile than DP cells. In detail, IFN-γ SP cells revealed an enhanced expression of chemokine receptors, co-stimulatory and co-inhibitory molecules as well as apoptosis markers and decreased production of effector cytokines. In addition, functional analyses showed that IFN-γ SP cells were tended to increased apoptosis and decreased proliferation. These data show an altered phenotype of IFN-γ SP cells of diseased NZBxW lupus-prone mice, which might be important for the disease pathogenesis at least in this animal model of SLE.
Table of Contents
IV
Table of Contents
Table of Contents
Acknowledgement ... I Zusammenfassung ... II Summary ... III Table of Contents ... IV Abbreviations ... VII List of Figures ... II List of Tables ... IV
1. Introduction ... 1
1.1. Immune system ... 1
1.1.1. Innate immune system ... 1
1.1.2. Adaptive immune system ... 2
1.1.2.1. Immunological memory ... 3
1.2. T cell activation and differentiation ... 4
1.3. Cytokines ... 6
1.3.1. Pleiotropic properties of IFN-γ ... 8
1.3.2. Immunomodulatory and immunostimulatory properties of IL-2... 11
1.4. Systemic lupus erythematosus ... 13
1.4.1. Definition, etiology and epidemiology of SLE ... 13
1.4.2. Cytokines in the pathogenesis of SLE ... 14
1.4.2.1. The role of IFN-γ in SLE ... 17
1.4.2.2. The role of IL-2 in SLE ... 18
1.4.3. Clinical manifestation and diagnosis of SLE ... 19
1.4.4. Treatment options for SLE ... 20
1.4.4.1. Anti-cytokine therapies for SLE ... 21
1.5. NZBxW murine model of SLE ... 23
1.6. Aims of this work ... 24
2. Materials and methods ... 25
2.1. Materials ... 25
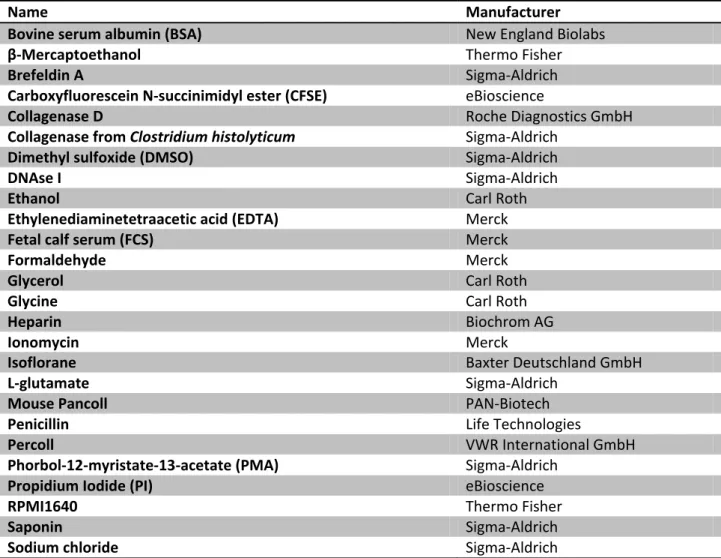
2.1.1. Chemical products ... 25
2.1.2. Antibodies ... 25
2.1.3. Kits and arrays ... 26
2.1.4. Analysis software ... 26
2.1.5. Consumables and devises ... 26
2.1.6. Recombinant proteins for cell culture ... 27
2.1.7. Buffers and media ... 27
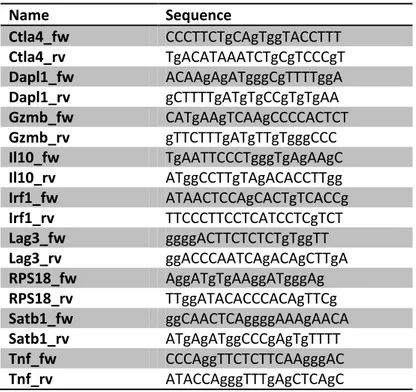
2.1.8. Oligonucleotides ... 28
2.1.9. Mice... 28
2.2. Cell biological methods ... 29
2.2.1. Methods of cell sorting ... 29
Table of Contents
V
2.2.2. Isolation of T cells from lymphoid organs ... 29
2.2.3. Isolation of lymphocytes from non-lymphoid organs ... 30
2.2.4. Isolation of memory CD4 T cells using FACS ... 31
2.2.5. Determination of cell numbers using hemocytometer ... 31
2.2.6. Stimulation of T cells in vitro ... 32
2.2.7. Preparation of cells for the analysis by flow cytometry ... 33
2.2.7.1. Dead cell staining ... 33
2.2.7.2. Surface staining ... 34
2.2.7.3. Fixation with formaldehyde ... 34
2.2.7.4. Permeabilization with saponin ... 35
2.2.7.5. Intracellular cytokine staining ... 35
2.2.8. Cytokine secretion assay ... 35
2.2.9. Isolation of memory CD4 T cell subsets for gene expression analysis ... 36
2.2.10. Cultivation of memory CD4 T cell subsets in vitro ... 37
2.2.11. Proliferation assay ... 38
2.2.12. Ki-67 staining ... 38
2.2.13. Apoptosis assay ... 39
2.3. Molecular biological methods ... 40
2.3.1. Microarrays ... 40
2.3.2. RNA purification ... 41
2.3.3. cDNA synthesis ... 41
2.3.4. Quantitative real-time polymerase chain reaction (qRT-PCR) ... 42
2.3.5. Quality analysis of current Affymetrix Gene Chips dataset ... 42
2.4. Statistical methods ... 44
2.4.1. Normalization of microarray data by RMA method ... 44
2.4.2. Correlation analysis of gene expression data ... 45
2.4.3. Statistical analysis of differences in gene expression ... 45
2.4.4. Student's t-test ... 46
2.4.5. Fisher's exact test ... 46
2.4.6. Venn diagrams ... 46
2.4.7. Simulation of random overlap of two gene lists ... 46
2.4.8. Gene enrichment analysis of microarray data ... 47
2.4.9. Three-parameter visualization of flow cytometry data ... 47
3. Results ...49
3.1. Balance of naive and memory CD4 T cells of diseased NZBxW lupus-prone mice ... 49
3.1.1. Increased frequencies of memory CD4 T cells in lymphoid organs ... 49
3.1.2. Increased frequencies of memory CD4 T cells in non-lymphoid organs ... 51
3.2. Altered pattern of IFN-γ and IL-2 production in diseased NZBxW lupus-prone mice ... 52
3.2.1. Increased frequencies of IFN-γ SP cells in lymphoid organs ... 52
3.2.2. Increased amounts of IFN-γ SP cells in non-lymphoid organs ... 55
3.3. Gene expression of memory CD4 T cell subsets of diseased NZBxW lupus-prone mice ... 57
3.3.1. Specific gene expression profiles of DN, IL-2 SP, DP and IFN-γ SP cells ... 57
3.3.2. Different gene expression between IFN-γ SP and DP cells ... 60
3.4. Analysis of microarray data on protein level ... 64
3.4.1. Equal expression of housekeeping genes in all samples ... 64
3.4.2. Increased expression of co-inhibitory receptors in IFN-γ SP vs. DP cells ... 65
Table of Contents
VI
3.4.3. Altered cytokine expression in IFN-γ SP vs. DP cells ... 67
3.4.4. Altered expression of apoptosis-related genes in IFN-γ SP vs. DP cells ... 70
3.4.5. Altered expression of transcription factors in IFN-γ SP vs. DP cells ... 72
3.5. Overlap of genes between IFN-γ SP cells in SLE and exhausted, effector and memory T cells in viral infection ... 74
3.6. Functional properties of IFN-γ SP cells of diseased NZBxW lupus-prone mice ... 77
3.6.1. Stable IFN-γ production by memory CD4 T cells upon IFN-γ administration to in vitro cultures ... 77
3.6.2. Decreased proliferation potential of IFN-γ SP cells ... 78
3.6.3. Increased apoptosis potential of IFN-γ SP cells ... 80
3.6.4. Different biological processes of IFN-γ SP vs. DP cells ... 81
3.7. Cytokine expression before and after onset of lupus nephritis ... 83
3.7.1. Decreased TNF-α expression by IFN-γ SP cells after onset of LN ... 83
3.7.2. Increased IL-10 expression by IFN-γ SP cells after onset of LN ... 85
4. Discussion ... 88
4.1. Altered IFN-γ and IL-2 production by memory CD4 T cells in the pathogenesis of SLE ... 88
4.2. Multi-step cell purification enabled informative gene expression analysis ... 93
4.3. Altered gene and protein expression of IFN-γ SP cells of diseased NZBxW lupus-prone mice ... 96
4.3.1. Increased expression of inflammatory chemokines by IFN-γ SP cells ... 97
4.3.2. Increased expression of co-inhibitory receptors by IFN-γ SP cells ... 99
4.3.3. Increased expression of IFN-regulated transcription factors by IFN-γ SP cells ... 100
4.3.4. Pleiotropic functions of IL-10 and TNF-α in SLE ... 102
4.3.4.1. Three-parameter visualization tool for cytokine co-expression analysis ... 102
4.3.4.2. Increased expression of IL-10 by IFN-γ SP cells... 102
4.3.4.3. Decreased expression of TNF-α by IFN-γ SP cells ... 104
4.3.5. IFN-γ SP cells tend to increased apoptosis ... 106
4.4. IFN-γ SP cells share features of hyperactivated and exhausted cells ... 107
4.5. Differentiation of IFN-γ SP cells upon IFN-γ administration to the in vitro cultures ... 108
4.6. Impact of stimulation of cells with PMA and Ionomycin ... 109
Conclusions ... 111
Outlook ... 112
References ... 113
Declaration of Originality ... 125
Abbreviations
VII Abbreviations
A Adenine
ANA Anti-nuclear autoantibody AP-1 Activator protein 1 APC Antigen presenting cell
APC Allophycocyanin
ASCT Autologous stem cell transplantation B220 B cell isoform of 220 kDa
BAFF B cell activating factor
BALB/c Albino laboratory-bred strain of the house mouse BCL B cell leukemia/lymphoma
BCR B cell receptoe BLyS B lymphocyte stimulator BP Biological process BSA Bovine serum albumin
C Cytosine
CCL Chemokine (C-C Motif) ligand CCR Chemokine (C-C Motif) receptor CCRL Chemokine (C-C Motif) receptor-like CD Cluster of differentiation
cDNA Complementary DNA
CFSE Carboxyfluorescein N-succinimidyl ester CIA Collagen induced arthritis
CSF Colony stimulating factor CSV Comma-separated values
CTLA-4 Cytotoxic T lymphocyte-associated antigen 4 CXCR Chemokine (C-X-C Motif) receptor
DAPL-1 Death-associated protein-like1
DAVID Database for annotation, visualization and integrated discovery
DN IFN-γ–IL-2– double negative cells DNA Deoxyribonucleic acid DNase I Deoxyribonuclease I
DP IFN-γ+IL-2+ double positive cells dsDNA Double stranded DNA
EAE Experimental autoimmune encephalomyelitis
F1 Filial 1
FACS Fluorescent-activated cells sorting Fc-γR Fragment crystallizable gamma receptor FITC Fluoresceinisothiocyanat
FOXP3 Forkhead box P3
G Guanine
GATA-3 GATA Binding Protein 3
GO Gene ontology
GZMB Granzyme B
ICOS Inducible T cell co-stimulator
IFN Interferon
IFNGR Interferon gamma receptor IFN-γ SP IFN-γ+IL-2– single positive cells
Ig Immunoglobulin
IL Interleukin
IL12RB2 Interleukin 12 receptor beta 2 IL18R1 Interleukin 18 receptor 1 IL-2 SP IFN-γ–IL-2+ single positive cells IL4RA Interleukin 4 receptor alpha IRF Interferon regulatory factor LAG-3 Lymphocyte-activation gene 3
LN Lupus nephritis
LOG2 binary logarithm mAb Monoclonal antibody MAC-1 Macrophage-1 antigen MACS Magnetic-activated cells sorting MAPK Mitogen-activated protein kinases MHC Major histocompatibility complex
mRNA Messenger RNA
NFAT Nuclear factor of activated T cells NF-κB Nuclear factor of κB
NK Natural killer cell NKT Natural killer T cell
NZBxW New Zeeland Black and White PBMC Peripheral blood mononuclear cells PBS Phosphate-buffered saline PCC Pearson Correlation Coefficient PCoA Principal Coordinates Analysis PCR Polymerase chain reaction PD-1 Programmed cell death protein 1
PE Phycoerythrin
PerCP Peridinin-chlorophyll-protein
PI Propidium iodide
PKC Protein kinase C
PM Perfect match
PMA Phorbol 12-myristate 13-acetate qRT-PCR Quantitative real-time PCR
RBC Red blood cell
RIN RNA integrity numbers RMA Multichip averaging RNA Ribonucleic acid RNase Ribonuclease
RORγT Retinoic acid receptor-related orphan receptor-γt RPMI Roswell Park Memorial Institute
RPS18 Ribosomal protein S18
RT Room temperature
SATB-1 Special AT-rich sequence-binding protein 1 SLE Systemic lupus erythematosus
SMAD2 Sma and Mad related proteins
STAT Signal transducers and activators of transcription
T Thymidine
T-bet T-box 21
TC Cytotoxic T cell TCM Central memory T cell TCR T cell receptor TEM Effector memory T cell TFH Follicular T helper cell TGF- β Transforming growth factor-β
TH T helper cell
TLR Toll-like receptor TNF Tumor necrosis factor TNFR Tumor necrosis factor receptor
TNFRSF Tumor necrosis factor receptor superfamily TREG Regulatory T cell
UV Ultraviolet
xg Times gravity
List of Figures
II
List of Figures
Figure 1. Differentiation of memory T cells. ... 4
Figure 2. Differentiation of naive CD4 T cells. ... 6
Figure 3. Cytokine receptor families. ... 7
Figure 4. Functions of IFN-γ. ... 11
Figure 5. Functions of IL-2. ... 12
Figure 6. SLE pathogenesis. ... 15
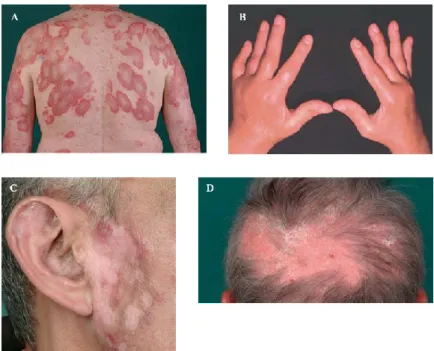
Figure 7. Clinical manifestations of SLE. ... 19
Figure 8. Targets for SLE treatment. ... 22
Figure 9. Sorting strategy for naive and memory CD4 T cells... 31
Figure 10. Stimulation of T cells via PMA and Ionomycin. ... 32
Figure 11. Discrimination of viable and dead cells by flow cytometry. ... 34
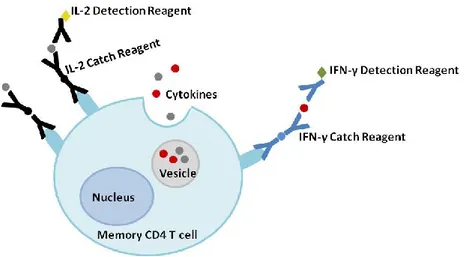
Figure 12. Cytokine secretion assay. ... 36
Figure 13. Isolation of memory CD4 T cell subsets. ... 37
Figure 14. Visualization of cell proliferation. ... 38
Figure 15. Ki-67 staining for flow cytometry. ... 39
Figure 16. Discrimination of apoptotic cells from dead cells. ... 40
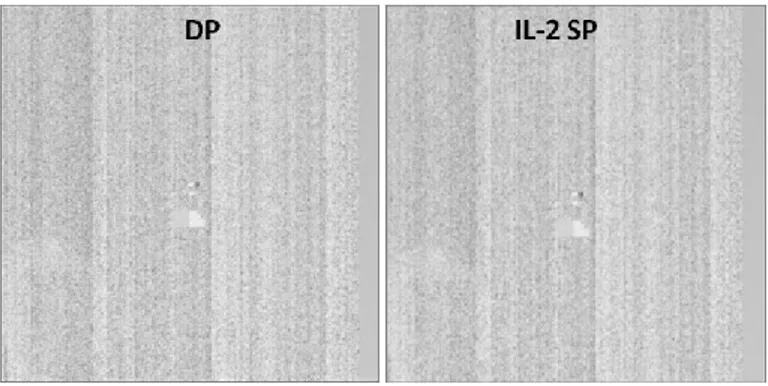
Figure 17. Raw image plots of microarray data. ... 43
Figure 18. MA plots for the array comparisons. ... 44
Figure 19. Probe-level data of microarray analysis. ... 45
Figure 20. Three-parameter visualization of flow cytometry data. ... 48
Figure 21. Increased frequencies of memory CD4 T cells in lymphoid organs of diseased NZBxW lupus- prone mice. ... 50
Figure 22. Increased frequencies of memory CD4 T cells in non-lymphoid organs of diseased NZBxW lupus-prone mice. ... 52
Figure 23. Distribution of DN, IL-2 SP, DP and IFN-γ SP cells. ... 53
Figure 24. Increased frequencies of the IFN-γ SP cell subset of memory CD4 T cells of diseased NZBxW lupus-prone mice. ... 55
Figure 25. Increased IFN-γ and IL-2 production by memory CD4 T cells in target organs of diseased NZBxW lupus-prone mice. ... 57
Figure 26. Principal Coordinates Analysis (PCoA) of gene expression data. ... 59
Figure 27. Pearson Correlation Coefficient (PCC) analysis of gene expression data. ... 60
Figure 28. Differentially expressed genes between subsets of memory CD4 T cells. ... 61
Figure 29. Differentially expressed genes in IFN-γ SP vs. DP cells. ... 63
Figure 30. Uniform expression of Rps18 housekeeping gene. ... 65
Figure 31. Increased expression of LAG-3 by IFN-γ SP cells of diseased NZBxW lupus-prone mice. ... 66
Figure 32. Increased expression of CTLA-4 by IFN-γ SP cells of diseased NZBxW lupus-prone mice. ... 67
Figure 33. Decreased expression of TNF-α by IFN-γ SP cells of diseased NZBxW lupus-prone mice. ... 68
Figure 34. Increased expression of IL-10 by IFN-γ SP cells of diseased NZBxW lupus-prone mice. ... 69
Figure 35. Increased expression of GzmB by IFN-γ SP cells of diseased NZBxW lupus-prone mice. ... 71
Figure 36. Decreased expression of Dapl1 by IFN-γ SP cells of diseased NZBxW lupus-prone mice. ... 72
Figure 37. Increased expression of Satb1 by IFN-γ SP cells of diseased NZBxW lupus-prone mice. ... 73
Figure 38 Increased expression of Irf1 by IFN-γ SP cells of diseased NZBxW lupus-prone mice. ... 73
III Figure 39. Genes, differentially expressed between IFN-γ SP vs. DP cells of diseased NZBxW lupus-prone
mice overlap with genes, differentially expressed between memory vs. effector, and exhausted vs.
effector CD4 T cells of mice infected with LCMV. ... 76
Figure 40. Stable IFN-γ production upon repetitive stimulations under conditions of IFN-γ administration to in vitro cultures. ... 78
Figure 41. Proliferation of cell subsets of memory CD4 T cells of diseased NZBxW lupus-prone mice defined by Ki-67 staining. ... 79
Figure 42. Decreased proliferative capacity of IFN-γ SP vs. DP cells. ... 80
Figure 43. Increased apoptosis potential of IFN-γ SP vs. DP cells. ... 81
Figure 44. Biological functions affected by altered gene expression in IFN-γ SP vs. DP cells. ... 82
Figure 45. Decreased TNF-α production in IFN-γ SP cells after onset of LN. ... 84
Figure 46. Increased IL-10 production by IFN-γ SP cells after onset of LN... 85
Figure 47. Linear model of TH1 cell differentiation and memory development. ... 92
List of Tables
IV
List of Tables
Table 1. Altered cytokine expression during SLE. ... 16
Table 2. List of chemical products ... 25
Table 3. List of fluorochrome-labeled antibodies for flow cytometric analysis ... 25
Table 4. List of unlabeled antibodies and beads ... 26
Table 5. List of kits and arrays ... 26
Table 6. List of analysis software ... 26
Table 7. List of consumables and devises ... 26
Table 8. List of cytokines for cell culture ... 27
Table 9. List of buffers and media ... 27
Table 10. List of oligodeoxynucleotides for qRT-PCR ... 28
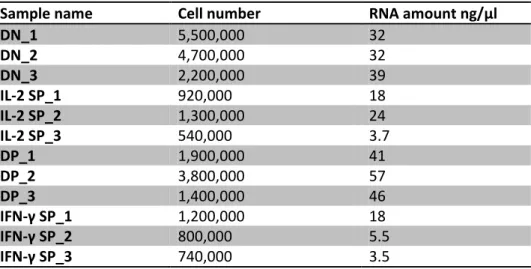
Table 11. Numbers of DN, IL-2 SP, DP and IFN-γ SP cells and corresponding amounts of isolated RNA ... 41
Table 12. Effects of gene manipulation on SLE manifestation ... 96
Introduction
1 1. Introduction
1.1. Immune system
The main function of the immune system is to protect the body from pathogenic agents. It consists of a variety of organs, tissues, cells and molecules, which ensure this protection. The main tasks of the immune system are immunological recognition, immune effector functions, immune regulation and immunological memory.
The immune system can be classified into the innate and adaptive immune system, which play important roles in the defense against pathogens (Murphy et al., 2012).
1.1.1. Innate immune system
The innate immune system provides antigen-nonspecific first line defense against pathogens.
Innate immune responses occur rapidly on exposure to a pathogen and are provided by a variety of components, such as physical and chemical barriers (skin and antimicrobial proteins of mucosa), the complement system and phagocytic cells, such as dendritic cells, macrophages, natural killer cells and granulocytes (neutrophils, eosinophils and basophils) as well as mast cells, which release enzymes and toxic proteins, when activated. These components ensure the functions of the innate immune system, namely acting as a barrier against pathogenic agents, their fast recognition, recruitment of immune cells to the sites of infection and activation of the adaptive immune system (Alberts et al., 2002).
Innate immune response initiates adaptive immune responses through antigen presentation.
Thereby an important step is the maturation of dendritic cells. Immature dendritic cells are activated by recognition of common pathogenic structures via their toll-like receptors (TLR) and other pathogen recognition receptors. Activated dendritic cells act as antigen presenting cells (APC) and carry pathogenic antigens to peripheral lymphoid organs, where they present them to T cells. Besides antigen presentation, activated dendritic cells express specialized co-
stimulatory molecules, which are essentially required for the activation of naive T cells and their differentiation into effector cells (Janeway and Medzhitov, 2002).
Introduction
2
1.1.2. Adaptive immune system
Adaptive immune responses are initiated in peripheral lymphoid organs: lymph nodes, spleen and mucosa-associated lymphoid tissue (e.g. Peyer’s patches). Key components of the adaptive immune system are lymphocytes. There are two types of lymphocytes: B and T cells, which have different roles in the immune system. They are distinguished from each other by the sites of maturation and expression of distinct types of antigen receptors (Murphy et al., 2012).
B cells develop in the bone marrow and further mature in the periphery. The specific antigen receptor of B cells is the B cell receptor (BCR), or surface immunoglobulin (sIg). After an antigen binds to the BCR, the B cell gets activated and differentiates into memory B cells or plasma cells. Plasma cells in their turn secrete soluble antibodies (immunoglobulins) and act in the humoral immune response (Higdon et al., 2016).
T cell precursors arise from a common lymphoid progenitor and enter the thymus, where they develop into naive T cells (Gasteiger and Rudensky, 2014). After they have completed their development in the thymus, naive T cells enter the bloodstream and circulate between blood and peripheral lymphoid tissues until they encounter their specific antigen. The antigen receptor of T cells is the T cell receptor (TCR). After first encounter to the antigen, naive T cells get activated and proliferate and differentiate into effector T cells. This process constitutes the primary immune response (Janeway et al., 2001). Effector cells have different functions (see 1.2.); however, their common feature is to respond quickly and efficiently as soon as they encounter their specific antigen on target cells. This response results in the removal of the foreign antigen from the organism (Davis and Bjorkman, 1988). T cells can be divided into three functional classes: CD8 cytotoxic T cells (TC cells), which have a killing function, CD4 helper T cells (TH cells), which have an activating function, and regulatory T cells (TREG cells), which control immune responses by suppressing the activity of other lymphocytes (Murphy et al., 2012).
Unlike the innate immune system, the adaptive immune system is highly specific and can provide long-lasting protection by the creation of immunological memory.
Introduction
3 1.1.2.1. Immunological memory
Immunological memory is one of the most important tasks of the adaptive immune system. It enables the immune system to respond more rapidly and effectively to previously encountered pathogens und thus protects the organism from diseases (Murphy et al., 2012). Memory immune cells should fulfill three main criteria. First, they should be long-lived and maintain independently of stimulation or antigen persistence. Second, they should be specific for a particular antigen. Third, memory cells should be intrinsically activated by the previously encountered antigen (Farber et al., 2016). After the clearance of an antigen, most of the effector T and B cells die; however, some of them survive and become long-lived memory cells (Murphy et al., 2012). These memory T and B cells fulfill criteria of memory immune cells;
therefore, they can be considered as the bases of the immunological memory.
In this work, altered cytokine production was analyzed in memory CD4 T cells. Therefore, a short overview of the differentiation of naive T cells into memory T cells will be given.
There are two types of memory T cells: central memory and effector memory T cells (Figure 1).
Central memory T cells (TCM) express cell surface markers CCR7 and CD62L. These receptors are also expressed by naive T cells and are responsible for the migration of cells into T cell areas of secondary lymphoid organs. Upon restimulation, TCM cells rapidly lose CCR7 and CD62L and differentiate into effector memory T cells. However, further differentiation into effector T cells is delayed and these effector T cells express few amounts of cytokines.
Effector memory T cells (TEM) lack CCR7 and CD62L. They express inflammatory chemokines and can rapidly migrate into inflamed tissues. Early after restimulation, effector memory T cells rapidly mature into effector T cells and secrete large amounts of cytokines (Sallusto et al., 2004).
Introduction
4
Figure 1. Differentiation of memory T cells.
Central memory T cells (TCM) and effector memory T cells (TEM) arise from activated naive T cells or activated effector T cells. TCM and TEM cells are distinguished from each other by the expression of CCR7 and CD62L. After restimulation, they mature into effector T cells. TCM cells can also differentiate into TEM cells early after restimulation. After clearance of the antigen, most of the effector cells undergo
apoptosis within a few days.
1.2. T cell activation and differentiation
Naive T cells differentiate into effector T cells after they get activated. Activation of naive T cells is initiated after they encounter their specific antigen, which is presented to them by antigen presenting cells (APCs) in following manner: APCs internalize pathogenic structures in
peripheral tissues and degrade proteins into peptides. Antigenic peptides fulfill certain structural criteria that allow APCs to load these peptides onto special surface molecules, so called major histocompatibility complex (MHC) class I and II molecules. In this way, APCs present antigens to T cells in secondary lymphoid organs and initiate antigen-specific immune responses by effector T cells or immunological tolerance by regulatory T cells (Guermonprez et al., 2002).
Thus, a mature naive T cell gets activated, when it recognizes the appropriate peptide:MHC complex presented by APCs. However, complete differentiation of effector and regulatory T cells requires two more signals: These are on the one hand the interaction of co-stimulatory molecules (B7.1 and B7.2) on the surface of APCs with the co-stimulatory receptor on T cells CD28 and on the other hand cytokines, which determine the direction of T cell differentiation (Murphy et al., 2012).
Naive T cells have the ability to differentiate into several functional cell subtypes, which are specialized for certain immunological responses. For example, naive CD8 T cells differentiate
Introduction
5 into cytotoxic effector CD8 T cells (TC cells), which recognize peptide:MHC I complexes on target cells invaded by the pathogen and kill them. CD4 T helper cells (TH cells) recognize peptide:MHC II complexes presented by APCs and initiate a pathogen-directed immunological response by activation of other cells of the immune system.
There are several subtypes of CD4 T cells, e.g. TH1, TH2, TH17, TFH and TREG cells (Figure 2). Except for TREG cells, which have an inhibitory function and limit the extent of the immune response, all other CD4 T cell subtypes have an activating function (Sallusto et al., 2004). TH1 cells stimulate cells of the innate immune system (e.g. macrophages) to kill target cells invaded by intracellular bacteria and provide co-stimulatory signals for B cells to produce antibodies against
extracellular pathogens. TH2 cells are required for the class switching of B cells to produce IgE antibodies to fight extracellular parasite infections and are important for allergies. TH17 cells stimulate neutrophils to clear extracellular bacteria and promote barrier integrity. TFH cells provide help for B cells to produce antibodies in lymphoid follicles. TFH cells can produce cytokines, characteristic for TH1 and/or TH2 cells. TREG cells suppress effector T cell responses to limit the extent of immune responses and prevent autoimmunity (Caza and Landas, 2015).
The balance between T cell subtypes is important for the efficient functioning of the immune system (Caza and Landas, 2015). It is known that the predominance of TH1 or TH2 cell responses is often characteristic for the development of chronic autoimmune diseases or allergies,
respectively (Murphy et al., 2012).
The functions of T cell subtypes are mainly defined by the production of mediator proteins, called cytokines (Caza and Landas, 2015).
Introduction
6
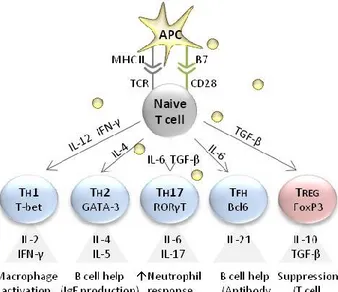
Figure 2. Differentiation of naive CD4 T cells.
Antigen producing cells (APC) provide activating signals to naive T cells via the T cell receptor (TCR) and the co-stimulatory receptor CD28. Activated T cells are able to differentiate into several T cell subtypes, e.g. TH1, TH2, TH17 cells, follicular helper T cells (TFH) or regulatory T cells (TREG). The direction of
differentiation is guided by cytokines released by APCs and other cells of the innate immune system in response to infection. Each subtype of T cells is characterized by the expression of a certain master transcription factor and the pattern of released cytokines.
1.3. Cytokines
Cytokines are small proteins, which have important functions in the signaling of the immune system. Main biological activities of cytokines include both cellular and humoral immune responses, induction of inflammatory responses, regulation of hematopoiesis, control of cellular proliferation and differentiation and induction of wound healing (Dinarello, 2007).
Cytokines are produced by a variety of cells usually in response to an activating stimulus and initiate their biological effects through the binding to specific receptors on the surface of target cells. Cytokines can act in an autocrine manner (affect the behavior of the cell that releases the cytokine), a paracrine manner (affect the behavior of neighbor cell) and an endocrine manner (affect the behavior of distant cell) (Firestein et al., 2012).
Cytokines and their receptors can be grouped by structure into different families: the hematopoietin family, the interferon (INF) family and the tumor necrosis factor (TNF) family (Figure 3). The hematopoietin receptor superfamily includes homodimeric (e.g. receptors for erythropoietin) and heterodimeric receptors with involving the common chain (e.g. receptors
Introduction
7 for IL-3, IL-5, GM-CSF, IL-2 and IL-15). IFN superfamily receptors include heterodimeric
receptors without the common chain (e.g. receptors for IFN-α, IFN-β, IFN-γ and IL-10). Most members of TNF receptor superfamily (e.g., TNFR1 and TNFR2, CD40, Fas, CD30, CD27) are transmembrane proteins and are found as homotrimers (Murphy et al., 2012).
Figure 3. Cytokine receptor families.
The hematopoietin receptor family includes homo- and heterodimeric receptors with the common chain. The interferon (IFN) receptor family includes heterodimeric receptors without the common chain.
The tumor necrosis factor (TNF) receptor family includes homotrimeric receptors.
Hematopoietin and IFN receptors signal through protein tyrosine kinases of the Janus kinase (JAK) family, thereby activating transcription factors known as Signal transducers and activators of transcription (STATs). Phosphorylated STAT molecules enter the nucleus and initiate the expression of selected genes (e.g. for growth and differentiation of lymphocyte subsets).
Stimulation of TNF receptors are mediated either by Fas and tumor necrosis factor receptor 1 (TNFR1) or only TNFR2. TNFR1 contains a cytoplasmic death domain and is expressed by a wide range of cells. Dependent on the cell type, it induces apoptosis through procaspase activation or pro-inflammatory responses (such as production of TNF-α) through the activation of
transcription factors, such as Nuclear factor of κB (NF-κB) and Activator protein 1 (AP-1) via TNF receptor-associated factor 2 (TRAF-2). In contrast to TNFR1, TNFR2 lacks a death domain and is expressed mostly on T cells. TNFR2 activates the NF-κB pathway, promoting cell survival rather than cell death (Murphy et al., 2012).
Inactivation of cytokine signaling occurs through negative feedback loops and involves dephosphorylation of cytokine receptor complexes, i.e. JAKs and STATs, by tyrosine phosphatases (Murphy et al., 2012).
Introduction
8
Properties of two main cytokines, IFN-γ and IL-2, which were investigated in this work are given below.
1.3.1. Pleiotropic properties of IFN-γ
The interferon (IFN) family includes two main classes of interferons, type I IFNs (e.g., IFN-, IFN-) and type II IFN (only IFN-γ) (Platanias, 2005). As this work focuses mainly on IFN-γ, an overview of IFN-γ will be given.
IFN-γ was discovered about 50 years ago through its antiviral activities (Wheelock, 1965). The binding chain of IFN-γ receptor (IFN-γR) is located on human chromosome 6 (Farrar and Schreiber, 1993). IFN-γ can be produced by various cell types of the immune system, among them CD4 T cells, mainly TH1 cells (Mosmann and Coffman, 1989; Sanders et al., 1988), CD8 T cells (Kasahara et al., 1983), B cells (Bao et al., 2014), natural killer cells (NK cells) (Boehm et al., 1997; Luetke-Eversloh et al., 2014), natural killer T cells (NKT cells) (Kronenberg, 2005) as well as macrophages and dendritic cells (Frucht et al., 2001).
Since IFN-γ plays a crucial role in immune responses, regulation of its expression is tightly controlled by multiple stimuli. IFN-γ production by T cells and NK cells is stimulated by IL-12 and IL-18 secreted by APCs (Okamura et al., 1998). Many transcription factors have been shown to contribute to the production of IFN-γ, among them the master transcription factor of TH1 cells T-bet (Szabo et al., 2000) as well as STAT4 (Carter and Murphy, 1999), AP-1 (Barbulescu et al., 1998), Nuclear factor of activated T cells (NFAT) and NF-κB (Sica et al., 1997). In addition, IFN-γ expression is negatively regulated by signals of transforming growth factor β (TGF-β) (Gorelik and Flavell, 2000; Kulkarni et al., 1993), IL-6 (Diehl et al., 2000) and the transcription factor Suppressor of cytokine signaling 1 (SOCS1) (Alexander et al., 1999; Fujimoto et al., 2000).
IFN-γ participates in diverse immunological responses. As a major effector cytokine of TH1 cells, IFN-γ production amplifies TH1 cell-regulated responses by enhanced differentiation of naive CD4 T cells towards TH1 cells in a positive feedback loop (Bradley et al., 1996; Das et al., 2001;
Lighvani et al., 2001; Wakil et al., 1998; Zhang et al., 2001). Also, it has been reported that IFN-γ is able to stimulate the production of IL-12 by phagocytes (Yoshida et al., 1994) that may
further drive TH1 differentiation. In contrast, IFN-γ has been shown to interfere with other TH
cell responses, as it inhibits IL-4 secretion by TH2 cells (Gajewski and Fitch, 1988; Gajewski et al.,
Introduction
9 1988) as well as IL-17 secretion by TH17 cells (Cruz et al., 2006; Harrington et al., 2005; Park et al., 2005).
Apart from its effects on T cell differentiation, IFN-γ plays an instrumental role in controlling intracellular bacterial infections via priming of innate immune cells. It increases antigen
processing and presentation by upregulation of MHC class I and II antigen presenting pathways (Boehm et al., 1997). Furthermore, IFN-γ may enhance antibacterial activity of macrophages and thus plays a crucial role in the host defense against pathogens. Correspondingly, mice lacking IFN-γ or IFN-γR showed increased susceptibility to poorly virulent Mycobacteria species and certain parasites (Huang et al., 1993; Kamijo et al., 1993; van den Broek et al., 1995).
Strikingly, complete or partial deficiency of IFN-γR in humans is strongly associated with susceptibility to Mycobacteria and Salmonella, early onset of infection and premature death.
Moreover, impaired IFN-γ signaling leads to poor granuloma formation and uncontrolled
growth of bacteria within macrophages (Doffinger et al., 2000; Jouanguy et al., 1999a; Jouanguy et al., 1999b). Individuals deficient for IFN-γ itself die very early from sepsis due to decreased neutrophil mobility and NK cell activity, demonstrating the immunomodulatory properties of IFN-γ (Davies et al., 1982).
There is increasing evidence for the relevance of IFN-γ in anti-tumor immunity. Initial hints have come from the fact that mice lacking IFN-γR developed tumors induced by chemical agents more rapidly and more frequently than wild-type mice (Kaplan et al., 1998). However, systemic administration of IFN-γ demonstrated limited efficacy in mice and humans with cancers.
Further research showed that the therapeutic efficacy of IFN-γ is rather dependent on the responsiveness of tumor cells to IFN-γ. Anti-tumor effects of IFN-γ can be explained by its cytostatic, pro-apoptotic and anti-proliferative features (Tannenbaum and Hamilton, 2000).
Aside from its functions in host defense and anti-tumor immunity, IFN-γ has been shown to contribute to autoimmune diseases, such as autoimmune nephritis (Heremans et al., 1978), systemic lupus erythematosus (SLE) (Baechler et al., 2003; Lee et al., 2001), multiple sclerosis (Panitch et al., 1987) and diabetes mellitus (Sarvetnick et al., 1988). The mechanisms by which IFN-γ contributes to autoimmune diseases remain unclear. However, several experiments shed some light on the role of IFN-γ in autoimmunity. Thus, it has been shown that increased
epidermal transgenic expression of IFN-γ leads to the development of glomerulonephritis through increased production of anti-dsDNA and anti-histone autoantibodies by B cells (Seery,
Introduction
10
2000). This effect could be achieved due to the contribution of IFN-γ to antibody production and antibody class switching in B cells (Schroder et al., 2004). Also, IFN-γ might contribute to autoimmune diseases through the infiltration of target organs by IFN-γ producing T cells, causing end organ damage (Hu and Ivashkiv, 2009; Schwarting et al., 1998a; Schwarting et al., 1998b). CXCR3, a TH1-associated chemokine receptor, has been found to be increased in lupus nephritis and was shown to contribute to tissue inflammation and autoantibody production (Lacotte et al., 2013).
Interestingly, in mouse models of collagen-induced arthritis (CIA) and experimental
autoimmune encephalomyelitis (EAE) IFN-γ showed rather a protective function, limiting tissue damage associated with inflammation (Ferber et al., 1996; Manoury-Schwartz et al., 1997;
Willenborg et al., 1996). The protective role of IFN-γ in these experimentally induced
autoimmune conditions might be explained by the fact that IFN-γ on the one hand inhibits IL-17 production by pathogenic TH17 cells and on the other hand enhances the activity of regulatory T cells (Kelchtermans et al., 2008).
Taken together, IFN-γ is involved in innate and adaptive immune responses. It plays a crucial role in protection of the organism against pathogens by increasing activity of macrophages and inducing TH1 responses; it has immunomodulatory functions by enhancing the activity of NK cells, neutrophils and leucocytes, by inhibiting the activity of TH17 cells and enhancing the activity of TREG cells. IFN-γ has even anti-tumor functions by its direct cytotoxic effects on cancer cells and activation of the adaptive immune system against cancer cells (Lugade et al., 2008).
However, IFN-γ contributes significantly to a variety of autoimmune diseases in a pro- inflammatory manner. The functions of IFN-γ are summarized in Figure 4.
Introduction
11 Figure 4. Functions of IFN-γ.
A schematic illustration. SLE - systemic lupus erythematosus, DM - diabetes mellitus, MS - multiple sclerosis, IBD - inflammatory bowel disease, CIA - collagen-induced arthritis, EAE - experimental autoimmune encephalomyelitis, EAU - experimental autoimmune uveitis.
1.3.2. Immunomodulatory and immunostimulatory properties of IL-2
The cytokine IL-2 is of central importance for immune responses (Fuhrmann et al., 2016). IL-2 was first discovered in the 1970ies due to its capability to induce T cell proliferation and
differentiation (Gillis et al., 1978; Gillis and Smith, 1977; Morgan et al., 1976; Smith, 1988), that is why it was initially called T cell growth factor. IL-2 is a 15kDa cytokine, which can be produced by a variety of cells, among which predominantly by activated CD4 cells (Leonard, 2001;
Setoguchi et al., 2005) and to a lesser extent by CD8 cells (Cheng et al., 2002; Paliard et al., 1988) as well as dendritic cells (Granucci et al., 2001), NKT cells (Yui et al., 2004) and mast cells (Hershko et al., 2011).
Nowadays, it is known that IL-2 can act not only as a T cell growth factor, but it has a large range of functions in the immune system. Besides induction of T cell proliferation, IL-2 also promotes immunoglobulin secretion and proliferation of B cells (Mingari et al., 1984), it induces proliferation of NK cells and enhances their cytolytic activity (Siegel et al., 1987). Strong IL-2 signals are required for the differentiation of both CD4 and CD8 T cells into effector cells. In contrast, weak IL-2 signals lead to the differentiation of CD4 T cells into TFH cells or central memory T cells. IL-2 is required for CD8 T cells to survive and become long-lived memory CD8 T cells (Boyman and Sprent, 2012).
Apart its immunostimulatory functions, IL-2 has an essential role in immune tolerance and homeostasis (Klebb et al., 1996). First, IL-2 is able to promote activation-induced cell death
Introduction
12
(AICD) of autoreactive immune cells (Kneitz et al., 1995; Lenardo et al., 1999). In addition, IL-2 is essential for the development and maintenance of CD4+FoxP3+ regulatory T cells (TREG cells) (Malek and Castro, 2010). This has been demonstrated in experiments, where mice lacking IL-2 developed severe lymphoproliferative and autoimmune disorders (Sadlack et al., 1995; Sadlack et al., 1993; Schorle et al., 1991; Suzuki et al., 1995a). Here, the main reason for autoimmunity associated with IL-2 deficiency was a defect in TREG cells. Regulatory T cells are generally known to inhibit proliferation and differentiation of self-reactive T cells (Sakaguchi, 2004; Shevach, 2009). IL-2 signaling is critically required for the proper functioning of TREG cells, as IL-2
maintains stable expression of their master transcription factor, FoxP3, and therefore, lineage stability and functioning (Fontenot et al., 2005). Thus, in the absence of IL-2, the numbers of TREG cells decline and the numbers of TH17 cells increase, which leads to enhanced susceptibility to autoimmune diseases (D'Cruz and Klein, 2005; Fontenot et al., 2005; Littman and Rudensky, 2010).
Taken together, IL-2 is an important immunomodulatory cytokine, which has a wide spectrum of biological actions: On the one hand, driving T cell proliferation and differentiation, on the other hand, suppressing potentially harmful autoimmune reactions. Immunomodulatory and immunostimulatory functions of IL-2 are summarized in Figure 5.
Figure 5. Functions of IL-2.
A schematic illustration. AICD – activation-induced cell death.
Since IL-2 is a crucial cytokine for the immune system, its signaling and the regulation of its expression represent an important topic. IL-2 expression in T cells is induced after stimulation of both the T cell receptor (TCR) and the co-stimulatory receptor CD28, which leads to the activation of signaling cascades, resulting in the activation and migration of several
transcription factors into the nucleus, where they bind to the IL-2 promotor and induce IL-2 expression. Main transcription factors involved in IL-2 production are NFAT, AP-1, including c-Fos and c-Jun, NF-κB and the Octamer transcription factor 1 (OCT-1) (Bendfeldt et al., 2012).
Introduction
13 In turn, IL-2 expression is inhibited by cAMP responsive element modulator (CREM) (Barton et al., 1996; Juang et al., 2005), Zinc finger E-box (ZEB) (Yasui et al., 1998), T-box transcription factor (T-bet) (Hwang et al., 2005) and by an autoregulatory feedback loop, which depends on the activation of STAT5 (Villarino et al., 2007) and B lymphocyte-induced maturation protein 1 (BLIMP-1) (Gong and Malek, 2007).
Once IL-2 is produced, it acts through the binding to its specific receptor. The IL-2 receptor (IL-2R) consists of three subunits: α- (IL-2Rα, CD25), β- (IL-2Rβ, CD122) and the common receptor γ-chain (γc, CD132). β- and γc-subunits form an intermediate-affinity binding to IL-2, whereas together with the α-subunit (CD25) they form a high-affinity IL-2R complex (CD132, CD122 and CD25) (Cacalano and Johnston, 1999). A very similar structure to IL-2R has the receptor for IL-15, namely they share their β- and γc-chains (Waldmann, 2006). IL-2-IL-2R binding results in signal transduction through the activation of three major pathways: (1) JAK/STAT-, (2) Mitogen-activated protein kinase (MAPK-) and (3) Phospatidylinositol 3 kinase (PI3K-) dependent signaling pathways, which basically mediate proliferation and survival signaling (Benczik and Gaffen, 2004).
Being an important cytokine with pleiotropic functions, IL-2 administration or its blockade has been approved for therapeutic approaches for a range of diseases. However, the modulation of IL-2 response is strongly context-dependent. For example, enhancement of its effector
activities, such as expansion and activation of cytotoxic T cells and NK cells may be beneficial for the elimination of cancer cells (Rosenberg, 2012; Schwartzentruber et al., 2011), whereas blockade of its effector responses (Borie et al., 2003; Changelian et al., 2003; Kremer et al., 2009) or enhancement of the activity of regulatory T cells (Humrich and Riemekasten, 2016) may be beneficial for fighting autoimmunity and inflammation.
1.4. Systemic lupus erythematosus
1.4.1. Definition, etiology and epidemiology of SLE
Systemic lupus erythematosus (SLE) is a chronic autoimmune disease which is characterized by autoantibody production and infiltration of target organs with inflammatory cells (Moulton and Tsokos, 2011). SLE can affect almost every organ system of the body and therefore, it has a very heterogeneous clinical manifestation, which may delay the early diagnosis (Hiepe, 2014). A
Introduction
14
specific cause of SLE is still unknown, however, genetic, environmental and hormonal factors as well as several drugs have been discussed to trigger lupus (Alexander et al., 2015).
The frequency of SLE varies worldwide by race and ethnicity (Danchenko et al., 2006). In
Germany, the prevalence of SLE was estimated in 2002 to be 36.7 per 100,000 with a female to male ratio of 4:1 (Brinks et al., 2014). SLE frequently starts in women of childbearing age
(Aringer and Hiepe, 2011), but it can also affect men (Brinks et al., 2016) and children at the age of up to 19 years (Pineles et al., 2011).
Early diagnosis and advances in general medical care along with a better understanding of the pathogenesis of the disease contributed to an increase of 10-year survival rate from 5% in 1955 to 95% in 2003 (Cervera et al., 2003; Chehab et al., 2011). The main cause of the mortality in early SLE is on the one side the active disease itself with multiple organ damage and on the other side infectious complications, related to immunosuppressive treatment (Cervera et al., 2003). The causes of the late mortality are long-term side effects of corticosteroids and other drugs, including atherosclerosis and hypertension with their consequences as well as direct tissue damage of these drugs (Manzi et al., 1997; Salmon and Roman, 2001).
1.4.2. Cytokines in the pathogenesis of SLE
Various aspects of the immune system are involved in the pathogenesis of SLE, demonstrating the complexity of the disease (Mok and Lau, 2003). In particular, SLE is characterized by increased apoptosis of a variety of cells. In its turn, the clearance of apoptotic cells is impaired and results in the accumulation of cellular debris and increased presentation of autoantigens from these apoptotic cells to T cells (Alexander et al., 2015). Activated autoreactive T cells start to provide activating signals to B cells, which in their turn begin to produce autoantibodies and differentiate into autoantibody-producing memory plasma cells. These autoantibodies are predominantly directed against nuclear structures and RNA-binding proteins. Direct action of these autoantibodies on cells and/or formation of immune complexes results in further tissue damage (Hiepe and Radbruch, 2016; Winter et al., 2015). Figure 6 shows a simplified scheme of SLE pathogenesis.
There is increasing evidence that cytokines play an important role in the pathogenesis of SLE. It is known that activation of dendritic cells by immune complexes results in increased production
Introduction
15 of IFN-α (Lovgren et al., 2004). In its turn, IFN-α was shown to promote apoptosis (Strandberg et al., 2008) and enhance antibody production by B cells (Baccala et al., 2007; Le Bon et al., 2006). IFN-α seems to play an important role in SLE, since its increased serum levels were shown to positively correlate with serological and clinical signs of the disease (Bauer et al., 2006; Dall'era et al., 2005; Ytterberg and Schnitzer, 1982). Moreover, gene expression analyses demonstrated so called IFN-α signature (genetic association with IFN-α-related pathways) in the majority of SLE patients (Baechler et al., 2003; Bezalel et al., 2014; Feng et al., 2006).
Besides IFN-α, production of many other cytokines, such as interleukins, TNF-α and IFN-γ was shown to be altered in SLE (Apostolidis et al., 2011; Lauwerys and Houssiau, 1998; Ohl and Tenbrock, 2011; Yap and Lai, 2010).
Figure 6. SLE pathogenesis.
A simplified visualization. Increased production of IFN-α by antigen presenting cells (APC) initiates a cascade of events that results in the activation of autoreactive B and T cells. Autoreactive B cells produce antibodies, which can form immune complexes with structures released from apoptotic cells.
These immune complexes deposit in target organs, causing tissue damage. On the one hand, T cells provide help to autoreactive B cells to produce autoantibodies; on the other hand, they infiltrate target organs, causing local inflammation. Both processes are mediated by cytokines and chemokines, which may induce apoptosis and necrosis of target tissues, resulting in fibrosis and end organ damage.
Introduction
16
Altered expression of several cytokines has been a subject of intensive research during the last decades. However, the roles of many cytokines are not completely understood yet. Table 1 summarizes known alterations of several important cytokines in SLE.
Table 1. Altered cytokine expression during SLE.
Cytokine Altered expression during SLE
IFN-α - High serum levels in SLE patients correlated with disease activity (Bengtsson et al., 2000).
- Half of SLE patients were characterized by dysregulated gene expression of IFN-α pathway (Baechler et al., 2003).
IFN-γ - Increased expression of IFN-γ correlated with disease activity in NZBxW lupus-prone mice. IFN-γ administration accelerated lupus and its blockade delayed the onset of the disease in these mice (Jacob et al., 1987).
- Early IFN-γ administration in MRL/lpr lupus mice protected from SLE and its late administration accelerated disease activity (Nicoletti et al., 2000).
- In SLE patients both high (Uhm et al., 2003) and low (Min et al., 2001) serum levels of IFN-γ were shown to correlate with disease activity.
IL-1 - Increased IL-1 expression in kidneys of diseased MRL/lpr and NZBxW lupus-prone mice correlated with disease activity. Low does administration of IL-1 accelerated nephritis in these animals (Brennan et al., 1989).
- IL-1 expression was increased in patients with lupus nephritis (Takemura et al., 1994).
- Enhanced production of IL-1 by monocytes correlated with disease activity in SLE patients (Suzuki et al., 1995b).
- Elevated IL-1 levels were characteristic for flares in patients with extra-renal manifestations, but not for kidney involvement in SLE (Sturfelt et al., 1997).
IL-10 - Treatment of NZBxW lupus-prone mice with IL-10 accelerated disease activity and its blockade delayed the onset of nephritis in these mice (Ishida et al., 1994).
- IL-10 deletion in young MRL/lpr lupus mice resulted in exacerbation of the disease, showing its protective role in early disease (Yin et al., 2002).
- In SLE patients, increased IL-10 serum levels correlated with disease activity (Houssiau et al., 1995; Llorente et al., 1995).
IL-17 - Increased IL-17 production in mice and patients with SLE correlated with disease activity (Nalbandian et al., 2009).
IL-2 - IL-2 production by T cells was decreased in mice (Altman et al., 1981) and humans with active SLE (Alcocer-Varela and Alarcón-Segovia, 1982; Linker-Israeli et al., 1983).
- IL-2 administration in mice (Humrich et al., 2010) and humans with SLE seemed to be beneficial for SLE treatment (von Spee-Mayer et al., 2016).
IL-21 - Increased expression of IL-21 correlated with lupus activity in humans and mice with SLE (Bubier et al., 2009; Nakou et al., 2013; Terrier et al., 2012).
IL-6 - IL-6 blockade ameliorated SLE signs in MRL/lpr and NZBxW lupus-prone mice (Finck et al., 1994a; Kiberd, 1993).
- Increased IL-6 serum levels correlated with disease activity in SLE patients (Stuart et al., 1995).
Introduction
17 TNF-α - TNF- expression was decreased in diseased NZBxW lupus-prone mice (Jacob and
McDevitt, 1988).
- Therapeutic administration of TNF- improved survival of NZBxW lupus-prone mice (Gordon et al., 1989).
- Increased TNF- expression correlated with disease activity in MRL/lpr lupus mice (Boswell et al., 1988; Yokoyama et al., 1995).
- Blockade of TNF- in patients with rheumatoid arthritis, ankylosing spondylitis or Crohn’s disease may lead to lupus-like symptoms (Carlson and Rothfield, 2003; De Rycke et al., 2003; Shakoor et al., 2002).
- Increased TNF- levels correlated with disease activity in a small group of SLE patients (Aderka et al., 1993; Aringer et al., 2002; Gabay et al., 1997; Maury and Teppo, 1989).
- In selected SLE patients with nephritis, TNF- blockade might be a useful therapeutic option (Aringer et al., 2004; Hayat et al., 2007).
Whereas the production of many pro-inflammatory cytokines is increased in SLE, the
production of IL-2, a crucial cytokine for the regulation of immune tolerance and homeostasis (de la Rosa et al., 2004), was shown to be decreased. Another remarkable point is the
heterogeneous production of IFN-γ in SLE. As a major pro-inflammatory cytokine of the TH1 cells, IFN-γ might play a certain role in the pathogenesis of SLE; however, this hypothesis has not been proved yet. In order to more precisely investigate IL-2 and IFN-γ alterations in SLE, the features of IL-2 and IFN-γ producing cells were analyzed in this work. Further a short
introduction into the roles of these two cytokines in SLE will be given.
1.4.2.1. The role of IFN-γ in SLE
IFN-γ expression by T cells of NZBxW lupus-prone mice (NZBxW is a spontaneous model of SLE (Perry et al., 2011); see 1.5.) was reported to be increased and correlated with the age of mice and the development of the disease (Enghard et al., 2006). Both early and recent studies showed that the treatment of NZBxW lupus-prone mice with IFN-γ resulted in the acceleration of the development of glomerulonephritis, in contrast, the treatment of these animals with anti-IFN-γ antibodies diminished severity of SLE, demonstrating the importance of IFN-γ in this model of lupus nephritis (Jacob et al., 1987; Schmidt et al., 2015).
Interestingly, the role of IFN-γ was shown to be heterogeneous in another (MRL/lpr) strain of lupus mice. MRL/lpr mice have an autoimmune MRL background and carry the lpr mutation within the Fas gene (Adachi et al., 1993), which results in lymphocyte proliferation and