Supplementary Material
A CTP synthase undergoing stage specific spatial expression is essential for the survival of the intracellular parasite Toxoplasma gondii
Heidy Y. Narvaez-Ortiz1, Andrea J. Lopez1, Nishith Gupta2*, Barbara H. Zimmermann1*
* Correspondence: gupta.nishith@staff.hu-berlin.de, bazimmer@uniandes.edu.co Supplementary Data
Purification of TgCTPS from inclusion bodies
Standard induction was as follows, cells were grown to an OD600 of 0.3 at 37 ºC, cooled to RT, incubated until OD600 of 0.5, and then induced with 1 mM IPTG for 3 h. Cells were harvested by centrifugation (6,000 × g, 20 min, 4 °C) and a pellet from 1 L of bacterial cell culture was resuspended in 20 mL of buffer A (50 mM sodium phosphate buffer pH 7.4, 500 mM NaCl and 10%
glycerol) containing 5 mM imidazole, 1 mM phenylmethanesulfonyl fluoride (PMSF) and 1 mM benzamidine. Lysozyme (1 mg/mL) was added to the cell suspension and it was incubated on ice for 2 h. Cells were disrupted by sonication on ice (30 cycles of 20 sec each, output control setting of 8 and 100% duty cycle) using a 250 Analog Sonifier (Branson). The two protease inhibitors were added to the suspension three times during the sonication process reaching a final concentration of 3 mM each. After sonication, insoluble and soluble fractions were separated by centrifugation (10,000
× g, 1 h, 4 °C). Because most of the TgCTPS full length protein was insoluble under native conditions, the pellet was reserved for recovering protein from IBs. To purify N-terminally truncated TgCTPS under native conditions, the clarified cell lysate was loaded onto 1 mL of a pre-equilibrated Co2+ affinity column. The column was washed with 10 volumes of buffer A containing 35 mM imidazole. TgCTPS was eluted with 1.5 mL of buffer A containing 300 mM imidazole. The protein- containing fractions were concentrated using a centrifugal filter unit (Millipore, 30 kDa or 100 kDa MWCO). The concentration of purified protein was measured by the Bradford assay (BioRad) with bovine serum albumin as the standard.
The pellet obtained after cell disruption was treated with the denaturing agent urea, to recover TgCTPS from IBs. First, the pellet was washed 3x in buffer A containing 0.5% Triton X100. Washed pellet was resuspended in buffer A containing 6 M urea, and incubated on ice for 2 h with gently shaking followed by centrifugation (10,000 × g, 1 h, 4 °C). The supernatant was loaded onto 1 mL of a pre-equilibrated Co2+ affinity column that was maintained under denaturing conditions, i.e. buffers containing 6 M urea. The column was washed with 10 volumes each of buffer B (buffer A, 0.5 mM oxidized glutathione (GSSG), 5 mM reduced glutathione (GSH), 35 mM imidazole) containing descending concentrations of urea from 6 M to 0 M (10 volumes containing 5 M urea, then 10 volumes containing 4 M urea, etc.). The refolded TgCTPS protein was eluted with 1 mL of buffer B containing 400 mM imidazole. A final elution of 1.5 mL with buffer B containing 500 mM imidazole was performed in order to remove all the remaining TgCTPS from the column.
.
1 Supplementary Figures and Table
Supplementary Figure 1. Multiple sequence alignment of CTP synthases from different organisms. Conserved residues in all proteins are shown in bold and indicated by asterisks above the sequences. Residues conserved in ≥85% of CTP synthases are colored by chemical property according to the STRAP server. The highly conserved regions of the synthase domain, which are required for UTP, ATP and CTP binding, are underlined in purple. The linker between the synthase and glutaminase domain is underlined in green. The catalytic triad (Cys-His-Glu) is indicated by ★ below the sequences. The N-terminal extension of TgCTPS is indicated by a pink box. The multiple sequence alignment was performed using the MAFFT algorithm (Katoh et al., 2002). The alignment figure was produced using the STRAP server (Gille et al., 2014). The proteins included in the alignment are, in descending order, as follows: Toxoplasma gondii, Tgon, JN847214.1; Plasmodium falciparum, Pfal, AAC36385.1; Leshmania major, Lmaj, XP_001682814.1; Saccharomyces cerevisiae I, ScerI, CAA37941.1; S. cerevisiae II, ScerII, CAA48277.1; Homo sapiens I, HsapI, NP_001896; H. sapiens II, HsapII, NP_062831; Drosophila melanogaster isoform C, DmegC, NP_730023.1; Escherichia coli, Ecol, ACB03894.1; Thermus thermophilus, Tther, YP_144732.1.
Caulobacter crescentus, Ccre, ENZ83858.1.
Supplementary Figure 2. Scheme illustrating TgCTPS knockout and conditional knockout strategies. (A) 3’UTR destabilization of TgCTPS mRNA. The loxP sites are represented by red triangles. (B) The Cre recombinase-mediated knockout of the TgCTPS gene via double homologous crossover. In the gene swap strategy the TgCTPS endogenous locus was replaced by the cassette labeled Cre-mediated KO construct in the Dku80::DiCre strain. The TgCTPS cDNA was cloned between two loxP sites and followed by yellow fluorescence protein (YFP) and the selection marker HXGPRT. Although, the recombination-specific PCR identified weak amplifications in the pool of transfected parasites, only single crossover events at the 5'- or 3'-end, were observed in individual clones. (C) Conditional knockout of TgCTPS. The inducible promoter construct was transfected in parasites from the Dku80-TaTi strain and selected with FUDR to obtain the transgenic locus TgCTP
pTet containing the endogenous and the ATc inducible copy of TgCTPS. The 5'- and 3'- recombination-specific PCRs identified amplifications in the pool of transfected parasites, but a double crossover was never observed in individual clones.
Supplementary Figure 3. Recombinant expression of TgCTPS. (A) Under standard conditions, a small amount of soluble recombinant protein was observed by SDS-PAGE (left panel), and was confirmed by western blot using anti-His tag antibodies (right panel). Lane 1, pellet obtained after centrifugation of sonicated induced cells; Lane 2, supernatant obtained after centrifugation of sonicated induced cells. STD, 6xHis protein ladder (Qiagen). (B) TgCTPS obtained under standard expression conditions, and concentrated with a centrifugal filter (100 kDa, MWCO, Millipore). The arrow indicates the band corresponding to TgCTPS, which was confirmed by western blot (data not shown). C – F. SDS-PAGE of TgCTPS produced under different conditions. In all cases, only one elution fraction obtained afte9r affinity chromatography using Co+2 resin is shown. (C) Induction of expression of the full length TgCTPS in TB media at low temperature in the presence of low concentrations of IPTG as described previously (Steeves and Bearne, 2011). (D) Full length TgCTPS produced by autoinduction in minimal medium (Studier, 2005). (E) Full length TgCTPS protein recovered from inclusion bodies using urea in the presence of reduced/oxidized glutathione (10 GSH/1 GSSG). (F) Truncated TgCTPS obtained after purification by affinity chromatography using
Co+2 resin. The blue arrows indicate the bands corresponding to TgCTPS, which were confirmed by western blot (data not shown). B-E PageRuler plus prestained protein ladder (ThermoScientific) was used as a standard. F. PageRuler unstained broad range protein ladder (ThermoScientific) was used as the standard.
Supplementary Figure 4. Dose-response inhibition curve of DON for TgCTPS. The rate of CTP formation was measured in the presence of a saturating concentration of L-Gln (4 mM), ATP (1 mM), UTP (1 mM) and GTP (0.4 mM). The curve shown was generated from a nonlinear regression fit of the data to log(inhibitor) vs. response using the GraphPad Prism version 6.0e.
-3 -2 -1 0
0 25 50 75 100
DON μM (Log)
% Tg CTPS activity
Supplementary Figure 5. Ectopic expression of TgCTPS in tachyzoites. Ectopically expressed TgCTPS under the pGRA2 promoter. Immunostaining was performed using mouse anti-c-myc (green) and rabbit anti-TgHsp90 (red) antibodies. Intracellular: HFF cells were infected with transfected parasites and fixed 27 hpi. Extracellular: Fresh extracellular parasites were fixed using 4
% PFA. The TgCTPS punctate distribution is indicated by arrowheads (white). DIC: differential interference contrast. Scale bars: 5 µm.
Supplementary Figure 6. Aberrant forms of intra- and extracellular parasites under DON treatment.
A. The bars indicate the percent of parasites exhibiting an aberrant morphology with increasing amounts of DON, calculated based on the total number of cells for each condition. B. Spherical and shorter parasites were
observed, when fresh extracellular parasites were incubated 4 - 6 h in variable concentrations of DON. Scale bars: 5 µm.
Supplementary Figure 7. Enzymes potentially affected by DON in T. gondii. (A) A table summarizing the glutaminases present in the T. gondii genome which could be inhibited when DON is added to the parasite culture. Three of them belong to nucleotide metabolism (6.3.4.2, CTP synthase; 6.3.5.2, GMP synthase and 6.3.5.5, carbamoyl phosphate synthase). Genes encoding for the putative proteins, PET112-glutaminyl tRNA synthase and glucosamine fructuose-6-phosphate amino transferase, are expressed at low levels in tachyzoites. (B) Scheme illustrating pathways to obtain GMP and UMP in T. gondii. Steps shown by blue arrows indicate reactions of interconversion or
µM DON. The number of parasites per vacuole was counted 27 hpi in each evaluated condition. Data are represented as mean ± SD of three independent experiments.
Supplementary Figure 8. DON inhibitor wash-out experiments on intra- and extracellular T. gondii tachyzoites. (A) Replication rate of parasites cultured in the presence of 20 µM DON for 27 h, followed by the removal of DON and incubation for another 27 h. (B) Plaque assay was performed in the absence of DON (top) and in the presence of 20 µM DON (middle). Plaques were fixed and stained after 8 days. For the wash- out experiment, infected cells were exposed to 20 µM DON for 4 days and then the inhibitor was removed by washing and replaced by D10 media for the next 4 days (bottom). (C) Quantification of the effect of DON on extracellular parasites. The bar graphs indicate the percent of parasites exhibiting a usual morphology compared to the percent of spherical and shorter parasites. All samples were scored after 6 h.
SUPPLEMENTAL TABLE
Primer name Primer sequence (restriction site underlined) Cloning vector
Expression of TgCTP in E. coli TgCTP_s
TgCTP_as
ATTACCATATGAACGCCGCCTCCCGAGCC CCACATATGCTAGGCACTTTCCACCTCTTCGTA GACG
pET-19b (His-tag-TgCTP in BL21 strain; 6xHis-TgCTP)
TgCTP_truncated
TgCTP_as
CTCATCGTCGACCTAGGCACTTTCCACCTCTTC CCACATATGCTAGGCACTTTCCACCTCTTCGTA GACG
pET-15b (His-tag-TgCTP w/o 57aa of its N-terminal in BL21 strain)
Subcellular localization of TgCTP in T. gondii TgCTPS_F1
TgCTPS_R1
CTCATCATGCATAACGCCGCCTCCCGAGCC CTCATCTTAATTAATTAcaggtcctcctcggagatgagct tctgctcGGCACTTTCCACCTCTTCGTAGACGGC
pGRA2-UPKO (For expressing an ectopic copy of TgCTP-c-myc in tachyzoites)
TgCTP-IT-F
TgCTP-IT-myc-R
CTCATCCCACCGGTCACCTGGGCTCTCTCTCGAT CTTTTCTGGT
CTCATCGAATTCcaggtcctcctcggagatgagcttctgctc GGCACTTTCCACCTCTTCG
pTKO-HXGPRT (For expressing TgCTP-c-myc under its own promoter in tachyzoites)
Functional expression in S. cerevisiae TgCTP_F2
TgCTP_R2
CTCATCGCGGCCGCATGAACGCCGCCTCCCGA CTCATCGCGGCCGCCTAGGCACTTTCCACCTCTT CGTAGA
pESC-His or pNEV-N (TgCTP in YBL039c or YJR103w strain)
CGCC
ScCTP2_F
ScCTP2_R
CTCATCGCGGCCGCATGAAATACGTTGTTGTTTC TGGT
CTCATCGCGGCCGCTCATTCATTTTCATTTCCCT CG
pESC-His or pNEV-N (ScCTP2 in YJR103w strain)
TgCTP_His_F
TgCTP_R2
CTCATCGCGGCCGCATGGGCCATCATCATCATC ATC
CTCATCGCGGCCGCCTAGGCACTTTCCACCTCTT CGTAGA
pNEV-N (TgCTP in YJR103w strain)
TgCTP_F2
TgCTP_FLAG-R
CTCATCGCGGCCGCATGAACGCCGCCTCCCGA CTCATCGCGGCCGCGGCACTTTCCACCTCTTCGT AGACG
pESC-His (Expression of TgCTP-flag in YJR103w strain)
Knockout of TgCTP in T. gondii by Cre system TgCTP_5'-
UTR_Cre_F1 TgCTP_5'- UTR_Cre_R1
CTCATCGGGCCCCAAAACCGACCGAATTGATT
CTCATCGGGCCCCCAACAACGTGTGGGCAG
pG140 (Complete
knockout of TgCTP by Cre recombinase in the
Δku80::diCre strain)
TgCTP_3'- UTR_Cre_F1 TgCTP_3'- UTR_Cre_R1 TgCTP_3'- UTR_Cre_R2 TgCTP_3'- UTR_Cre_R3 TgCTP_3'- UTR_Cre_R4
CTCATCGAGCTCCATCCTCCATTTGCCTCTTT
CTCATCGAGCTCGTATTTGCGTTTGATGAAAGA ATACTT
CTCATCGAGCTCTGCAGCTGGCCAAAGTCC
CTCATCGAGCTCTCTCTCATCGCTTGAGTTCTCG
CTCATCGAGCTCTCTCTCATCGCTTGAGTTCTCG
pG140 (Complete
knockout of TgCTP by Cre recombinase in the
Δku80::diCre strain)
TgCTP_3'- UTR_Cre_B_R
CTCATCGAGCTCGAGTTTATCGACGACGAAGAT AACT
TgCTP_ORF_Cre_F1
TgCTP_ORF_Cre_R1
CTCATCCAATTGCGACAAAATGAACGCCGCCTC CCGA
CTCATCTTAATTAATTAcaggtcctcctcggagatgagct tctgctcGGCACTTTCCACCTCTTCGTAGACG
pG140 (Complete
knockout of TgCTP by Cre recombinase in the
Δku80::diCre strain)
TgCTP_5Scr_Cre_F1 YFP_5Scr_Cre_R1
TAACTCTCTGGTTAGTCGCTCTTGT CAGATGAACTTCAGGGTCAGC
Screening of 5’-crossover in transgenic Δku80::diCre strain
HX_3Scr_Cre_F1 TgCTP_3Scr_Cre_ R1 TgCTP-3Scr-Cre-R2 TgCTP-3Scr-Cre-R3 TgCTP-3Scr-Cre-R4 TgCTP-3Scr-Cre-B-R1 TgCTP-3Scr-Cre-B-R2
CTACGACTTCAACGAGATGTTCC CATCAGAAACTCCTTTGGCC GATGGCACAACTTGTTCGC
CATTTCTCGGTCTATATCTGTGCA GAGTTTATCGACGACGAAGATAACT GAAATTCGTTTGGAGTTGGTAGA
GTCTGTGTCTTTGTGGTTCAGC
Screening of 3’-crossover in transgenic Δku80::diCre strain
TgCTP_ISP_Cre_F1 TgCTP_ISP_Cre_R1
GTGTACGTCCTGGAGGACG GCTCTGGGAGGACTTGAGTG
Comparison between gTgCTP and cTgCTP version in transgenic Δku80::diCre strain
Knockdown of TgCTP in T. gondii by 3’-UTR mRNA destabilization TgCTP_LIC_Cre_F
TgCTP_LIC_Cre_R
TACTTCCAATCCAATTTAATGCTCTCTCTCGATC TTTTCTGG
TCCTCCACTTCCAATTTTAGCGGCACTTTCCACC TCTTCG
pG152 (Knockdown of TgCTP in the Δku80::diCre strain)
TgCTP_Scr_Cre 1 F pG152/pG223-ESP- R1
CCATCTGCAAGGTGAGGAG CTGTTATCCTGCAGTTACTTGTCG
pG152 (Knockdown of TgCTP in the Δku80::diCre strain)
Conditional knockout of TgCTP TgCTP-ORF-myc-F1-
UPKOtetsag TgCTPS_R1
CTCATCTCATGAACGCCGCCTCCCGA
CTCATCTTAATTAATTAcaggtcctcctcggagatgagct tctgctcGGCACTTTCCACCTCTTCGTAGACGGC
pNTP3TetO7Sag1
(Conditional knockout of TgCTP in the Δku80-TaTi strain)
TgCTP_5'- UTR_Cre_F1 TgCTP-5UTR-pTet- CAT-R1
CTCATCGGGCCCCAAAACCGACCGAATTGATT
CTCATCGGGCCCCCAACAACGTGTGGGCAG
pTub8CAT-GT1-KO
(Conditional knockout of TgCTP in the Δku80-TaTi strain)
TgCTP-3UTR-pTet- CAT-F1
TgCTP-3UTR-pTet- CAT-R1
CTCATCCTCGAGGGCGCGTTCGAAAAAAGC
CTCATCTCTAGATCTCTCATCGCTTGAGTTCTCG
pTub8CAT-GT1-KO
(Conditional knockout of TgCTP in the Δku80-TaTi strain)
TgCTP_5Scr_Cre_F1
CAT-5Scr-R1
TAACTCTCTGGTTAGTCGCTCTTGT
TGCAGGAGAAAAAAATCACTGGA
Screening of 5’-crossover in transgenic the Δku80- TaTi strain
CAT-3Scr-pTet-F1
TgCTP-3Scr-Cre-B-R2
GTTTTCACCATGGGCAA
GTCTGTGTCTTTGTGGTTCAGC
Screening of 3’-crossover in transgenic the Δku80- TaTi strain
TgCTP-5UTR-pTet- DHFR-F1
TgCTP-5UTR-pTet- DHFR-R1
CTCATCCCACCGGTCACCTGGCAAAACC GACCGAATTGATT
CTCATCACTAGTCCAACAACGTGTGGGCAG
pTKO-DHFR-TS
(Conditional knockout of TgCTP in the Δku80-TaTi strain)
TgCTP-3UTR-pTet- DHFR-F1
TgCTP-3UTR-pTet-
CTCATCGTTAACGGCGCGTTCGAAAAAAGC
CTCATCGGGCCCTCTCTCATCGCTTGAGTTCTCG
pTKO-DHFR-TS
(Conditional knockout of TgCTP in the Δku80-TaTi strain)
DHFR-R1
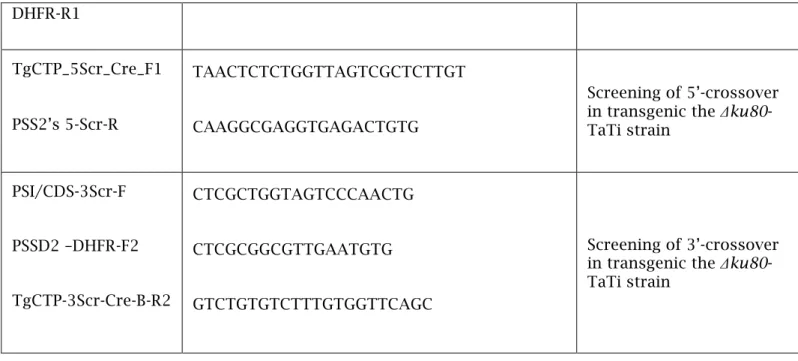
TgCTP_5Scr_Cre_F1
PSS2’s 5-Scr-R
TAACTCTCTGGTTAGTCGCTCTTGT
CAAGGCGAGGTGAGACTGTG
Screening of 5’-crossover in transgenic the Δku80- TaTi strain
PSI/CDS-3Scr-F
PSSD2 –DHFR-F2
TgCTP-3Scr-Cre-B-R2
CTCGCTGGTAGTCCCAACTG
CTCGCGGCGTTGAATGTG
GTCTGTGTCTTTGTGGTTCAGC
Screening of 3’-crossover in transgenic the Δku80- TaTi strain
Table S1. Sequences of oligonucleotides used in this study. All sequences are presented 5’ to 3’.
Underlined sequence indicates a restriction site added to the primer. Sequence for the c-myc tag is shown in lower case. Lyophilized oligonucleotides were dissolved in ddH2O (double-distilled water) at a concentration of 100 µM and stored at −20 ºC. Dilutions of 1:10 were made for working solutions.