rsbl.royalsocietypublishing.org
Research
Cite this article:
Hattich GSI, Listmann L, Raab J, Ozod-Seradj D, Reusch TBH, Matthiessen B. 2017 Inter- and intraspecific phenotypic plasticity of three phytoplankton species in response to ocean acidification.
Biol.Lett.13: 20160774.
http://dx.doi.org/10.1098/rsbl.2016.0774
Received: 30 September 2016 Accepted: 20 December 2016
Subject Areas:
ecology, evolution
Keywords:Emiliania huxleyi,Gephyrocapsa oceanica, Chaetoceros affinis, ocean acidification,
plasticity, reaction norm
Author for correspondence:
Giannina S. I. Hattich e-mail: ghattich@geomar.de
†
Shared first-authorship.
‡
Shared last-authorship.
A contribution to the special feature ‘Ocean acidification’.
Electronic supplementary material is available online at https://dx.doi.org/10.6084/m9.fig- share.c.3667954.
Marine biology
Inter- and intraspecific phenotypic
plasticity of three phytoplankton species in response to ocean acidification
Giannina S. I. Hattich
†, Luisa Listmann
†, Julia Raab, Dorthe Ozod-Seradj, Thorsten B. H. Reusch
‡and Birte Matthiessen
‡GEOMAR, Helmholtz Centre for Ocean Research Kiel, Du¨sternbrooker Weg 20, 24105 Kiel, Germany GSIH, 0000-0003-4660-7759; LL, 0000-0002-8517-8427
Phenotypic plasticity describes the phenotypic adjustment of the same genotype to different environmental conditions and is best described by a reaction norm. We focus on the effect of ocean acidification on inter- and intraspecific reaction norms of three globally important phytoplankton species (Emiliania huxleyi, Gephyrocapsa oceanica and Chaetoceros affinis).
Despite significant differences in growth rates between the species, they all showed a high potential for phenotypic buffering (similar growth rates between ambient and high CO2 conditions). Only three coccolithophore genotypes showed a reduced growth in high CO2. Diverging responses to high CO2of single coccolithophore genotypes compared with the respective mean species responses, however, raise the question of whether an extrapol- ation to the population level is possible from single-genotype experiments.
We therefore compared the mean response of all tested genotypes with a total species response comprising the same genotypes, which was not signifi- cantly different in the coccolithophores. Assessing species reaction norms to different environmental conditions on short time scale in a genotype-mix could thus reduce sampling effort while increasing predictive power.
1. Introduction
The expression of different phenotypes of a genotype in different environments is called phenotypic plasticity. It is described by the shape of the reaction norm of a trait value at different environments. No visible change in a focal trait despite a change in the environment (horizontal reaction norm) is defined as phenotypic buffering [1]. This does not preclude changes in other traits or on the molecular level. How phenotypic plasticity interacts with evolutionary adaptation is contentious [2]; it is discussed to be both a non-mutual alternative to evolutionary adaptation and a strong driver for adaptation. In the plasticity- first scenario, a population/species survives environmental change due to pronounced plasticity until genetic mutations may occur and potentially fix the previously plastic trait such that the fitness under the new conditions increases [3]. Provided that there is standing genetic/genotypic variation, mean popu- lation fitness can also increase at the level of populations, resulting from alteration of gene/genotypic frequencies over time caused by selection.
One prominent environmental change is ocean acidification (OA) [4], describ- ing changes in the carbonate system due to anthropogenic CO2dissolving in the ocean, which potentially affects organisms, species and communities [5]. In marine phytoplankton, different effect sizes and signs in response to OA (i.e. vary- ing reaction norms) have been observed between and within different taxa [6].
&
2017 The Authors. Published by the Royal Society under the terms of the Creative Commons AttributionLicense http://creativecommons.org/licenses/by/4.0/, which permits unrestricted use, provided the original author and source are credited.
on February 28, 2017 http://rsbl.royalsocietypublishing.org/
Downloaded from
A reason for within species differences can be adaptation to different geographical regions [7]. Little is known, however, about inter- and intraspecific variation in reaction norms of populations and communities originating from one geographi- cal region. Additionally, Valladareset al. [8] summarize that current mathematical models predicting alterations in commu- nities due to climate change lack data on intraspecific genetic and phenotypic variation. Largely diverging responses to OA of different Emiliania huxleyi genotypes among studies [9]
raise the question of whether responses derived from one or a few genotypes can be directly extrapolated to the population and community level.
We compare (i) the intra- and interspecific reaction norms of three phytoplankton species in response to two different CO2
conditions and (ii) the total multi-genotype species response to the mean intraspecific CO2-response of the respective species.
The species used include two common bloom forming cocco- lithophores, E. huxleyi and Gephyrocapsa oceanica, and a diatom, Chaetoceros affinis, originating from one region. We expect that (i) the coccolithophores show a zero to negative reac- tion norm as a result of OA [10] compared with a positive slope for the diatom as a result of profitable dissolved inorganic carbon use [11]. Furthermore, (ii) genotypes of a species should differ in their growth response, and (iii) the total species reaction norm is unequal to that of single genotypes but similar to the calculated mean reaction norm of all genotypes together.
2. Material and methods
FromC. affinis,E. huxleyiandG. oceanicanine different genotypes each and one mix of all genotypes with equal initial abundances (electronic supplementary material, S1) were immediately (i.e.
without acclimation) exposed to ambient and high CO2concen- tration in order to obtain a two-point reaction norm within the acclimation phase. All cultures used were field isolates (2014–
2015) originating from one geographical region (Gran Canaria, 278590N 158220W). This design allowed us to compare the within and among species plasticity of one community and the effect of intraspecific interaction on the short-term CO2-response by contrasting the multi-genotype total species (mixculture) to the mean intraspecific plastic (monoculture) response. All treat- ment combinations were threefold replicated resulting in 180 experimental units (0.5 l polycarbonate bottle). Owing to space limitation each species was tested separately (June to July 2016;
electronic supplementary material, figure S1).
The ambient and high CO2-treatment was manipulated by aerating the artificial-seawater (35 salinity; after [12]) for 24 h with CO2-enriched air (400 and 1250 ppm, respectively) prior to the experiment. The dissolved inorganic carbon [13] was 2164.68+27.76 and 2307.94+51.59mmol kg21with a total alka- linity (following [14]) of 2442.04+20.72 and 2456.30+ 20.63mmol kg21for ambient and high CO2, respectively. Nutri- ents were added to the final concentrations of 19.98+ 0.39mmol l21 nitrate, 1.01+0.07mmol l21 phosphate and 4.40+0.24mmol l21 silicate for coccolithophores and 34.16+ 0.30mmol l21 silicate for the diatoms. The excess of silicate added to medium used for diatoms ensured that all species were limited by nitrate in the experiment, and was a prerequisite to compare results among species. Vitamin and trace metals were added inf/8 concentration [15]. The prepared medium was ster- ile filtered (0.2mm pore size) into the experimental units. Each experimental unit was inoculated with an initial total biovolume of 8280mm per millilitre of exponentially growing cells, balan- cing the substantial differences in cell size of the species used.
The experiment was carried out under constant rotation (0.75 min21) at 208C and a 17 L : 7 D cycle reaching a maximum light intensity of 350mmol m22s213 h after dusk and dawn. The development of each culture was followed by daily cell counts for the coccolithophores (Z2TM COULTER COUNTERw) and fluorescence measurements for the diatom (10AU Field and Lab- oratory Fluorometer by Turner Designs). The total sampling volume was below 10%. Cultures were terminated at the third day in stationary phase (experimental duration: 9–16 days).
For statistical analysis, the software R was used [16]. Growth rates were determined for each replicate by fitting an exponential growth model inbuilt in the package ‘growthrates’ [17]. The over- all effect of CO2, species and genotype on growth rate was tested using a nested ANOVA (growthrate CO2* Species * (Geno- type/Species)). Subsequent analysis of intraspecific plasticity and the effect of genotype was tested by separate ANOVAs for each species (growthrate CO2* Genotype) and genotype (growthrateCO2) and visualized as the difference in growth rates between ambient and high CO2 [18]. The difference between mean interspecific plastic effects and the multi-clonal total species response was tested for each species separately (growthrateMono-/Mix-culture). Parametric assumptions were explored graphically.
3. Results
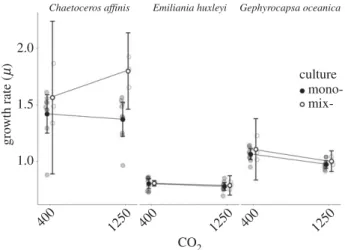
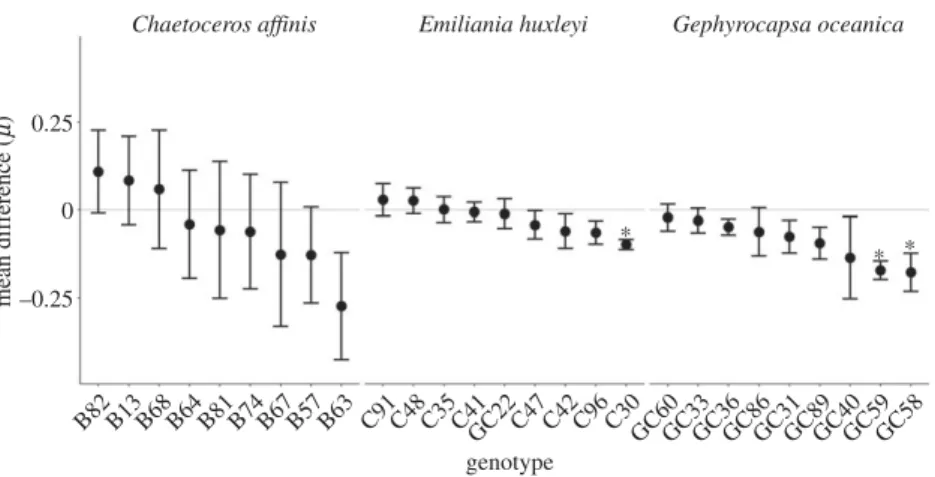
The growth rates (m) of the different species were signifi- cantly different (F2,132¼355.586, p,0.001), withE. huxleyi andG. oceanicashowing a 44% and 28% lowermthanC. affi- nis(figure 1). Across all speciesmwas generally lower in high CO2and significantly depended on genotype (F1,132¼8.433, p¼0.004; F24,132¼6.161, p,0.001; respectively). Analysis on the species level revealed that only the m ofG. oceanica was significantly lower in high CO2 (F1,56¼20.659, p, 0.001). Furthermore, the magnitude of the difference in m between the CO2-treatments was not uniform among all tested genotypes within each species (figure 2). While the mean difference ofC. affinisgenotypes ranged from 0.109 to 20.273 with a substantial standard error, those ofE. huxleyi had a narrow range from 0.029 to20.097, with one genotype (C30) showing a significantly lowermunder high than under ambient CO2 (F1,4¼48.64, p¼0.002). The general negative mean difference in G. oceanica genotypes ranged from 20.17 to 20.21. Two genotypes (GC59 and GC58) were
2.0
Chaetoceros affinis Emiliania huxleyi Gephyrocapsa oceanica
growth rate (m)
1.0
400 1250 1250 1250
culture mono- mix-
400 400
1.5
CO2
Figure 1.
Two-point reaction norm of growth rates in ambient and high CO
2across mean of each genotype grown in monoculture (closed circle,
N¼9 (nine genotypes)) and a mixculture of all genotypes (open circle,
N¼3 (three replicates)) for each species. Mean and 95% CI are shown.
rsbl.r oy alsocietypublishing.org Biol. Lett. 13 : 20160774
2 on February 28, 2017
http://rsbl.royalsocietypublishing.org/
Downloaded from
significantly negatively affected by CO2(F1,4¼10.7,p¼0.031;
F1,4¼42.12, p¼0.003), which drove the overall significant negative effect of CO2 on the m of G. oceanica. Finally, the difference inmbetween mono- and mixcultures was signifi- cantly different only in C. affinis (F1,22¼8.405, p¼0.008) with a highermin the mix- than in the monocultures.
4. Discussion
We assessed the variation of phytoplankton acclimation reac- tion norms in two potential ‘loser’ and one potential ‘winner’
species under OA. Interestingly, all three species mostly buffered the effect of CO2and thus showed a mean reaction norm slope similar or close to zero. However, within species, the response range varied.C. affinisshowed the largest range in growth rates among genotypes tested. E. huxleyi and G. oceanicaare ecologically more alike each other thanC. affi- nis which could explain a more similar negative response among them. Owing to the extensive literature [19] showing negative effects of OA on coccolithophores, we expected to see more genotypes showing a significant negative effect in growth under high CO2, but note that most of those measure- ments were taken after acclimation, while our study was designed to address exactly the acclimation phase. Neverthe- less, in line with the literature, we found thatG. oceanicawas most and significantly negatively affected by high CO2[10].
Overall the weak effect of CO2 could partly be due to the high variability among replicates masking a potential difference in growth rate between the two treatments.
Additionally the experimental level of CO2 in this study may be within the natural range (daily fluctuations, upwelling) species experience and can be phenotypically buffered [20].
The effect of CO2on single genotypes differed compared with the mean species response. E. huxleyi, for example, showed no overall effect of CO2 on growth even though one genotype grew significantly slower under high CO2. We observed the opposite inG. oceanica, with an overall nega- tive effect of high CO2on growth rate even though seven out
of nine genotypes showed no difference. Our findings high- light the importance of testing many genotypes rather than using single genotypes, as has been done in most studies so far [19], to avoid over- or underestimation of a species reaction norm to climate change.
The question remains how to minimize the sampling effort needed to study reaction norms of a representative set of genotypes of a species. We here show that the reaction norm of a culture containing the full set of genotypes compared with the mean of all genotypes cultured singly was similar in both coccolithophores but not in the diatom.
The significant effect of culture condition on the slope inC.
affinis could be driven by the high variability within the three replicates in the mixcultures. Nevertheless, our results suggest that the use of a mixculture of genotypes is sufficient to assess a species reaction norm on short time scales. This largely suggests that the total species reaction norm obtained from the mixcultures reflects the mean species plasticity if, as assumed here, genotype loss due to sorting is likely to be negligible (electronic supplementary material, S2).
Our experiments highlight the importance of investi- gating species reaction norms rather than reaction norms of single genotypes to better predict reactions to short-term environmental change. We suggest that analysing a mix of genotypes is potentially an achievable and feasible way to identify more realistic species reaction norms. Nevertheless, future studies should assess final genotype sorting to fully understand the species reaction norms.
Data accessibility. PANGEA https://doi.pangaea.de/10.1594/
PANGAEA.865212 [21].
Authors’ contributions.The study was designed by G.S.I.H., L.L., T.B.H.R.
and B.M.; laboratory work carried out by G.S.I.H., L.L., J.R. and D.O.- S.; data analysis by G.S.I.H. and L.L. All authors drafted or revised the manuscript, gave final approval and agree to be held accountable for the content.
Competing interests.We have no competing interests.
Funding.G.H. and L.L. are funded by the DFG priority program 1704 Dynatrait: MA5058/2-1, RE5058/2-2.
Acknowledgements. We thank M. Lenz and F. Barboza for statistical advice and B. Gardeler and T. Hansen for assistance.
References
1. Pigliucci M, Mu¨ller GB (eds). 2010Evolution - the extended synthesis. Cambridge, MA: MIT Press.
2. Lande R. 2009 Adaptation to an extraordinary environment by evolution of phenotypic plasticity
and genetic assimilation.J. Evol. Biol.22, 1435 – 1446. (doi:10.1111/j.1420-9101.2009.01754.x) Chaetoceros affinis Emiliania huxleyi Gephyrocapsa oceanica
0.25
mean difference (m)
–0.25
genotype
* *
*
B82 B13B68 B64 B81B74B67B57 B63 C91C48 C35C41GC22C47 C42C96 C30GC60GC33 GC86GC36 GC31GC89GC40GC59GC58 0
Figure 2.
Mean difference and its standard error of growth rates (m) between high and ambient CO
2of each genotype and species. Grey line indicates no difference in growth between CO
2-treatments and asterisks highlight genotypes where growth rate was significantly affected by CO
2.
rsbl.r oy alsocietypublishing.org Biol. Lett. 13 : 20160774
3 on February 28, 2017
http://rsbl.royalsocietypublishing.org/
Downloaded from
3. Levis NA, Pfennig DW. 2016 Evaluating ‘plasticity- first’ evolution in nature: key criteria and empirical approaches.Trends Ecol. Evol.31, 563 – 574. (doi:10.
1016/j.tree.2016.03.012)
4. Caldeira K, Wickett ME. 2003 Anthropogenic carbon and ocean pH.Nat. Commun.425, 2003. (doi:10.
1038/425365a)
5. Doney SC, Fabry VJ, Feely RA, Kleypas JA. 2009 Ocean acidification: the other CO2problem.Annu.
Rev. Mar. Sci.1, 169 – 194. (doi:10.1146/annurev.
marine.010908.163834)
6. Dutkiewicz S, Morris JJ, Follows MJ, Scott J, Levitan O, Dyhrman ST, Berman-Frank I. 2015 Impact of ocean acidification on the structure of future phytoplankton communities.Nat. Clim. Change5, 1002 – 1006. (doi:10.1038/nclimate2722) 7. Kremp A, Godhe A, Egardt J, Dupont S, Suikkanen
S, Casabianca S, Penna A. 2012 Intraspecific variability in the response of bloom-forming marine microalgae to changed climate conditions.Ecol.
Evol.2, 1195 – 1207. (doi:10.1002/ece3.245) 8. Valladares Fet al.2014 The effects of phenotypic
plasticity and local adaptation on forecasts of species range shifts under climate change.Ecol. Lett.
17, 1351 – 1364. (doi:10.1111/ele.12348) 9. Langer G, Nehrke G, Probert I, Ly J, Ziveri P. 2009
Strain-specific responses ofEmiliania huxleyito changing seawater carbonate chemistry.
Biogeosciences6, 4361 – 4383. (doi:10.5194/bgd-6- 4361-2009)
10. Bach LT, Riebesell U, Gutowska MA, Federwisch L, Schulz KG. 2015 A unifying concept of coccolithophore sensitivity to changing carbonate chemistry embedded in an ecological framework.
Prog. Oceanogr.135, 125 – 138. (doi:10.1016/j.
pocean.2015.04.012)
11. Schaum E, Rost B, Millar AJ, Collins S. 2012 Variation in plastic responses of a globally distributed picoplankton species to ocean acidification.Nat. Clim. Chang.3, 298 – 302. (doi:10.
1038/nclimate1774)
12. Kester DR, Duedall IW, Connors DN, Pytkowicz RM.
1967 Preparation of artificial seawater.Limnol.
Oceanogr.12, 176 – 179. (doi:10.4319/lo.1967.
12.1.0176)
13. Hansen T, Gardeler B, Matthiessen B. 2013 Technical note: Precise quantitative measurements of total dissolved inorganic carbon from small amounts of seawater using a gas chromatographic system.
Biogeosciences10, 6601 – 6608. (doi:10.5194/bg- 10-6601-2013)
14. Matthiessen B, Eggers SL, Krug SA. 2012 High nitrate to phosphorus regime attenuates negative effects of risingpCO2on total population carbon accumulation.Biogeosciences95194, 1195 – 1203.
(doi:10.5194/bg-9-1195-2012)
15. Guillard RRL. 1975 Culture of phytoplankton for feeding marine invertebrates. InCulture of marine invertebrate animals, pp. 29 – 60. Boston, MA:
Springer US.
16. R Core Team 2016R: a language and environment for statistical computing. Vienna, Austria: R Foundation for Statistical Computing. See http://
www.R-project.org (accessed 21 June 2016).
17. Petzoldt T. 2016 growthrates’: Estimate growth rates from experimental data. See https://CRAN.R-project.
org/package¼growthrates (accessed 10 March 2016).
18. Borenstein M, Hedges LV, Higgins JPT, Rothstein HR.
2009 Effect sizes based on means.Introd. Meta- Analysis1, 21– 32. (doi:10.1002/9780470743386.ch6) 19. Meyer J, Riebesell U. 2015 Reviews and syntheses:
responses of coccolithophores to ocean acidification:
a meta-analysis.Biogeosciences12, 1671 – 1682.
(doi:10.5194/bg-12-1671-2015)
20. Riebesell U. 2004 Effects of CO2enrichment on marine phytoplankton.J. Oceanogr.60, 719 – 729.
(doi:10.1007/s10872-004-5764-z)
21. Hattich GSI, Listmann L, Raab J, Ozod-Seradj D, Reusch TBH, Matthiessen B. 2017 Experiment on inter- and intra-specific phenotypic plasticity of three phytoplankton species in response to ocean acidification. PANGEA. (doi:pangaea.de/10.1594/
PANGAEA.865212)
rsbl.r oy alsocietypublishing.org Biol. Lett. 13 : 20160774
4 on February 28, 2017
http://rsbl.royalsocietypublishing.org/
Downloaded from