Towards the EMU: A Need for Exchange Rate Flexibility?
Martin Cincibuch, David Vávra
Towards the EMU: A Need for Exchange Rate Flexibility?
Martin Cincibuch, David Vávra July 2000
Institut für Höhere Studien (IHS), Wien Institute for Advanced Studies, Vienna
Contact:
Martin Cincibuch Czech National Bank Na Prikope 28
115 03 Praha 1, Czech Republic (: +420/2/2441-2737 Fax: +420/2/2441-2329 email: Martin.Cincibuch@cnb.cz David Vávra
CERGE-EI POB 882
Politickych veznu 7
111 21 Praha 1, Czech Republic (: +420/2/2400-5111 Fax: +420/2/2422-7143 email: David.Vavra@cnb.cz
Founded in 1963 by two prominent Austrians living in exile – the sociologist Paul F. Lazarsfeld and the economist Oskar Morgenstern – with the financial support from the Ford Foundation, the Austrian Federal Ministry of Education and the City of Vienna, the Institute for Advanced Studies (IHS) is the first institution for postgraduate education and research in economics and the social sciences in Austria. The Transition Economics Series presents research done at the Department of Transition Economics and aims to share “work in progress” in a timely way before formal publication. As usual, authors bear full responsibility for the content of their contributions.
Das Institut für Höhere Studien (IHS) wurde im Jahr 1963 von zwei prominenten Exilösterreichern – dem Soziologen Paul F. Lazarsfeld und dem Ökonomen Oskar Morgenstern – mit Hilfe der Ford- Stiftung, des Österreichischen Bundesministeriums für Unterricht und der Stadt Wien gegründet und ist somit die erste nachuniversitäre Lehr- und Forschungsstätte für die Sozial- und Wirtschafts- wissenschaften in Österreich. Die Reihe Transformationsökonomie bietet Einblick in die Forschungsarbeit der Abteilung für Transformationsökonomie und verfolgt das Ziel, abteilungsinterne Diskussionsbeiträge einer breiteren fachinternen Öffentlichkeit zugänglich zu machen. Die inhaltliche Verantwortung für die veröffentlichten Beiträge liegt bei den Autoren und Autorinnen.
according to the traditional OCA theory. Using quantitative measures, we find the degree of macroeconomic convergence between the Czech and German (EU) economies high enough not to form a major obstacle to a common currency regime. In addition, we look at transitional specificities of the Czech economy. We analyse the real appreciation of the Czech currency and its relationship to competitiveness and find that development of cost factors exercise depreciationary pressures on the exchange rate. Conversely, a fixed regime may alleviate problems of the foreign capital influx and ensuing nominal appreciation – another idiosyncrasy of the Czech economy. However, once labour market rigidities are removed, a fixed regime may become a source of a sustainable competitive advantage, growth, and convergence.
Keywords
Czech Republic, eurisation, optimum currency areas, real exchange rate, competitiveness
JEL Classifications
F15, F33, P22, P29
Comments
The views of the authors are not necessarily those of the institution. We are grateful to Alena Buchtiková, Milan Klima, and Stanislav Polák for invaluable comments and insights. The usual disclaimer applies. David Vávra acknowledges that this research was undertaken with support from the European Union’s Phare ACE Programme 1997. The content of the publication is the sole responsibility of the authors and it in no way represents the views of the Commission or its services.
Introduction 1 Macroeconomic Consequences of Single Currency: Traditional
OCA Factors 2
Non-exchange Rate Channels of Economic Stabilisation... 3
Structural Similarity between the CR and EMU ... 4
Foreign Trade Orientation... 4
Commodity Composition of Foreign Trade ... 5
Correlation of Economic Cycles ... 6
Specific Transitional Features: Structural and Cost Factors of Real Appreciation... 10
Cost Factors of Real Appreciation: Excessive Real Wage Growth ...11
Structural Factors of Real Appreciation ... 18
Specific Transitional Features: Capital Inflow... 20
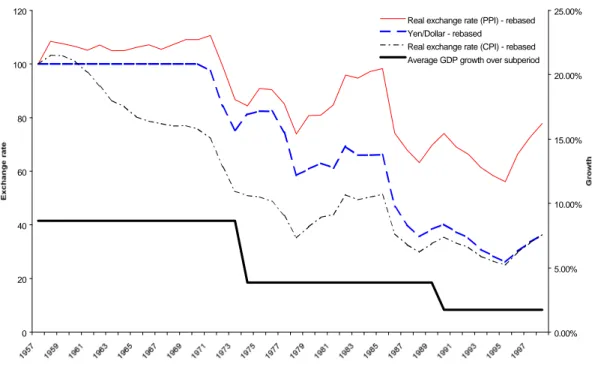
Conclusion 21 Appendix 23 Real Exchange Rate and Growth: Japan and Ireland... 23
Japan... 23
Ireland... 24
References 27
Introduction
The goal of macroeconomic policymaking in the Czech Republic is to smooth the final stages of the process of transition and to successfully integrate the country into the European Union in the shortest possible time. The desire for an early admission to the EU is motivated by the prospects of real convergence that accession is assumed to offer. Because participation in the economic part of the union is not conceivable without also joining the monetary union in the due course, the adoption of the Euro is among the ultimate goals of the current monetary policy. Considering the current floating regime of the Czech crown, legitimate questions arise of the appropriate horizon in which the final peg to the Euro should be undertaken and of the appropriate currency arrangement for the interim period. The appealing issue implied by these questions is whether the choice of a currency regime can facilitate the final stages of transition and promote the process of real convergence to the EU income levels or is irrele- vant to the developments the real economy.
In answering these questions, we first investigate the readiness of the Czech economy to permanently fix the currency to the Euro. We do so by considering, in turn benefits and costs of a single currency regime according to the traditional OCA (optimum currency area) theory.
Though much of the discussion takes place on qualitative grounds, we also provide several quantitative measures enabling us to better evaluate relevance of individual factors and also providing a compact index measure of the readiness of the Czech economy to adopt a com- mon EMU currency. In this manner, we follow the methodology of Bayoumi and Eichengreen (1997) and invoke directly their results for cross-country comparisons. We find the degree of macroeconomic (structural) convergence between the Czech and German (EU) economies high enough not to form a major obstacle to a fixed currency regime between these areas.
Having scrutinised the traditional OCA factors behind a fixed regime, we look at issues spe- cific to the transitional character of the Czech economy in order to investigate whether this specificity does not pose a threat to a fixed currency arrangement. For this purpose we ana- lyse the structure of real appreciation of the Czech crown over the transition period and its relationship to competitiveness. We conclude that a considerable part of the real apprecia- tion may be attributed to cost factors, namely to excessive real wage growth, and not to structural features of transitional process accentuated by other studies (Halpern and Wyplosz, 1997). The hitherto real appreciation reflects deterioration of the competitive posi- tion of Czech producers and exporters. In terms of OCA theory the excessive growth of real wages might be loosely interpreted as a sequence of real asymmetric adverse shocks.
These developments exercise depreciationary pressures on the exchange rate. If continued, such trends could undermine the stability of any fixed regime. Under such circumstances, an early adoption of the adoption of the Euro (unlike more flexible regimes) could become a burden for the economy. On the other hand, a fixed regime may alleviate problems stemming from another idiosyncrasy of the Czech economy, which is the influx of foreign capital and
the ensuing nominal appreciation. Moreover, once labour market rigidities are removed, a fixed exchange rate may become a source of sustainable competitive advantage, growth, and convergence.
In the appendix, we pursue a similar analysis for two successful transitional economies, Japan and Ireland, and find features relevant for our situation.
Macroeconomic Consequences of Single Currency:
Traditional OCA Factors
Adoption of Euro being the ultimate goal of the current monetary policy, we should perhaps first investigate the costs and benefits of such a step in the current state of the Czech econ- omy. This may shape our idea about the appropriate horizon of the single currency implementation and also evaluate desirability of a fixed currency regime as such.
The main benefits of a common currency have long been argued to lie in the reduction of transaction costs and the removal of exchange rate fluctuations adversely affecting income and inflation. The European Commission has estimated that costs related to foreign ex- change account for 0.25–0.5% of GDP.1 For the Czech economy, the former amounts to the reduction of transaction costs when trading with Euroland (60% of our exports, 40% imports).
Further-more, a complete removal of exchange rate uncertainty would reduce related risk premia and thus foster international investment, trade, and consequently, growth. Perhaps they are considerable, the extent of these effects remains unclear (Beachill and Pugh, 1998).
The benefits of eliminating national currencies and therefore promoting costless transactions within a larger area accrue mainly to smaller and more open countries and vice versa. For example, creating a currency union between Belgium and Luxembourg is more desirable than creating a currency union between France and Germany. This aspect is also used in a quantitative analysis.
The costs of adopting the Euro may stem from the loss of the exchange rate as a macroeco- nomic tool sheltering the economy from some types of (external) shocks. The theory consid- ers the exchange rate as an appropriate means to eliminate impacts of economy-specific real shocks, because such shocks require an adjustment of the real exchange rate. Such an alignment can be undertaken by a shift in the nominal rate without additional adjustment costs in terms of output or employment.
1 Nevertheless, Wihlborg (1995) argues that even 0.25% of GDP may be on the high side. He notices that transaction costs are likely to be exaggerated because it is difficult for firms to distinguish currency exchange per se from other costs related to international trade requiring special documentation and additional paper work.
The need to resort to the exchange rate as a means of protection against real asymmetric shocks (and hence also the costs of eurisation) depends on the probability of such events and the absence of alternative channels of adaptation. The likelihood itself can be related to the degree of structural convergence and regional specialisation vis-à-vis the EU. It is self- evident that the more similar economies are, the lower is the probability of an external shock affecting only one of them. The other channels of economic stabilisation include wage and price flexibility, mobility factors of production (especially labour) between the Czech and EMU economies, and, partially, also fiscal redistribution. In other words, the costs of adopt- ing the Euro depend on whether the Czech and EU economies form an "optimum currency area." (Mundell, 1961)
Non-exchange Rate Channels of Economic Stabilisation
Adopting Euro in the presence of asymmetries will shift the burden of adjustment to idiosyn- cratic shocks from exchange rate to other channels. On principle, the adjustments required to stabilise the economy after a real asymmetric shock can happen through changes in prices and wages, or the mobility factors of production. Should these markets be flexible enough, even existing serious asymmetries would not preclude the countries from adopting a single currency. Eventually, the impacts of such shocks can be mitigated through a realloca- tion of resources within schemes of fiscal federalism.
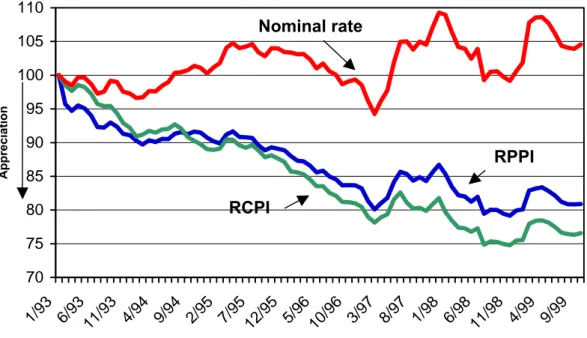
Under fixed exchange rate with prices and wages exhibiting significant nominal rigidities (downward), real asymmetric disturbances might have serious long-term consequences in terms of lower output and employment. Hitherto, the transition experience of the Czech economy provides evidence on such a limited flexibility of nominal variables. Firstly, after the floatation of the currency in May 1997, nominal exchange rate fluctuations were transmitted into the volatility of the real rate (Figure 1), with the lower band of the transmission period commonly estimated six months. Secondly, the end of 1998 demonstrated that the down- ward rigidity of nominal wages highly exceeded that of prices, which in turn led to a marked rise of real wages in the period of productivity decline and rising unemployment.
Regarding the mobility of the labour force between the Czech and EU economies, it is evi- dent that it is currently much lower than within the EMU, which itself is considered less mo- bile. Moreover, it seems that the admission of the Czech Republic (CR) to the EU will be conditioned on legal restrictions for the mobility of labour. Fiscal measures are also sometimes considered to be important stabilising elements of the areas with a single currency because they tend to smooth effects of regional idiosyncratic shocks.2 The extent of
2 The fiscal redistribution may not only be suitable to smooth temporary shocks, but it may also facilitate the adjustment to permanent ones as long as hysterisis effects are present (Krugman, 1990).
fiscal redistribution between the Czech and EU economies will be limited without the actual entry into the union.
All in all, the economy exhibits too little flexibility (in terms of prices and wages) to sustain real asymmetric shocks without substantial losses in output and employment. With labour mobility negligible and fiscal stabilisers non-existent, serious real disturbances would threaten the stability of a fixed exchange rate regime between the CR (Czech Republic) and the EU. Moreover, a common currency could lead to the economic divergence of the country from the rest of the EU. Hence, we need to assess the danger of the Czech economy being hit by real idiosyncratic shocks with respect to Euroland. We will do so by examining the structural similarity between the CR and EU (or Germany), using the classification of factors provided by the OCA theory.
Structural Similarity between the CR and EMU
The similarity of the Czech and EMU economies determining probability of real asymmetric shocks can be assessed by examining the usual OCA areas: foreign trade orientation, com- modity composition of exports and correlation in the business cycles.
Foreign Trade Orientation
Asymmetric orientation of foreign trade is a typical source of real idiosyncratic shocks, be- cause foreign trade acts as a transmitter of disturbances. Ideally, the countries of the cur- rency union would only trade with each other and, with the same intensity, with third coun- tries. To the extent, though, that their trade orientation differs markedly, one may expect them to be hit by different shocks at different times. Within the EMU itself, examples of such asym- metric trade (and economic) orientation include the strong ties of Ireland to Great Britain, Finland to East Asia and to Russia, or Portugal to Brazil.
For the Czech and EMU economies these differences mainly arise from relatively high eco- nomic linkages of the Central and Eastern European region to the Czech economy (Slova- kia, Hungary, Poland and Russia combined accounts for almost 24%3 of our exports) com- pared to its little impact on the EMU (the same countries make only 6% of the EU exports).
Expressed as shares of exports in GDP, this becomes even more apparent, since, unlike the Czech economy, the EMU economy is relatively closed. The ratio of exports to the above CEECs (Central and Eastern European Countries) represented almost 10% of Czech GDP in 1997, but as little as 1.5% of German GDP or 0.9% of that of the whole union.
3 Data from 1997 (Source: CSO).
Under such circumstances, a sudden crisis in the region would represent a much larger shock for the Czech economy than for the EMU. This was, for example, the case in the 1998 Russian collapse, when the subsequent decline in merchandise trade contributed to the eco- nomic decline of the Czech economy while having much less impact on the growth of the EU. Another conceivable scenario might involve a liquidity crisis and financial outflow from emerging markets. The ensuing depreciation of Eastern European currencies would (with the Czech Republic as a part of Euroland) mean an appreciation for our exporters significantly inhibiting their activity while the effects on other EMU countries are likely to remain confined.
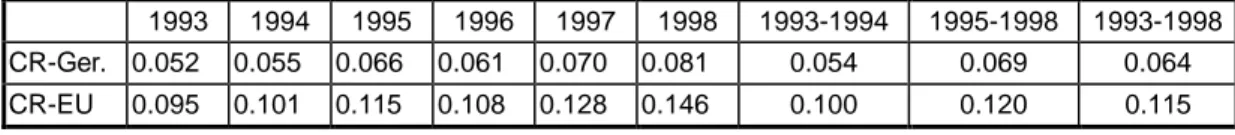
The above examples therefore document the absolute size of the asymmetry of the trade orientation between the Czech and EMU economies, which still appears to be too large to ignore. Despite their size, the existing trade orientation asymmetries tend to decline over time as the Czech economy structurally converges with the EU. This is manifested as the rising share of mutual trade in GDPs. Table 1 provides the development of one such measure (called TRADE), which computes the mean of the ratio of bilateral exports to GDP for the two areas concerned: the Czech Republic and Germany, and the Czech Republic and the whole EU. While the absolute numbers as such have no immediate interpretation (apart from being a means of cross-country comparisons), their movement over time clearly demonstrates a significant convergence with both Germany and the EU. This is a logical outcome of the transition and integration process.
Table 1: Variable TRADE: importance of bilateral trade linkages
1993 1994 1995 1996 1997 1998 1993-1994 1995-1998 1993-1998 CR-Ger. 0.052 0.055 0.066 0.061 0.070 0.081 0.054 0.069 0.064 CR-EU 0.095 0.101 0.115 0.108 0.128 0.146 0.100 0.120 0.115
Source: IFS November 1999.
Commodity Composition of Foreign Trade
The commodity composition of foreign trade is another indicator reflecting the structural simi- larities or differences between the Czech and EMU economies. If the bulk of the existing bilateral trade is realised on the basis of comparative advantages (inter-industry trade), then the tradable sector of the Czech economy is forced to relatively specialise vis-à-vis the EU and becomes more sensitive to various disturbances. If, on the other hand, the majority of bilateral trade is based on intra-industry exchange, then the economies structurally con- verge.
The actual proportion of inter- versus intra-industry trade in the bilateral exchange is difficult to compute. Nonetheless, we may come up with a simpler measure of similarity in the
commodity composition of foreign trade between the Czech and German economies (Bayoumi and Eichengreen, 1997). Evolution of this measure4 is given in Table 2 (variable SIM). Again, the absolute figure is of little interest, but the movement in time points to a very fast convergence process, suggesting the dominance of intra-industry trade. Though the picture may be quite different for the EU (or EMU) as a whole, a similar measure is not read- ily available.
Table 2: Variable SIM: dissimilarity of commodity export structure
1991 1992 1993 1994 1995 1996 1997 1998 1991-1994 1995-1998 1991-1998 SIM 0.24 0.25 0.23 0.22 0.21 0.13 0.12 0.09 0.24 0.14 0.19
Source: IFS November 1999.
Correlation of Economic Cycles
Perhaps the neatest way to assess structural similarity and hence the likelihood of asymmet- ric shocks is to directly examine the fluctuations of business cycles5 between the Czech and EMU economies. Some comparative studies (Boone and Maurel, 1998) indicate a high correlation in the cycles of industrial production with respect to Germany. Moreover, the correlation appears highest among the CEECs included in the sample and the transmission of the German cycle is almost immediate, which is perhaps a consequence of the high share of Germany in the total Czech export. Also, the synchrony seems to increase over time as structural convergence progresses. On the other hand, the correlation with the EU industrial cycle is substantially weaker, suggesting Germany is a more suitable partner for the currency union than the EU as a whole. A similarly high degree of synchrony in business cycles is also manifested in the unemployment statistics.6
A less sophisticated (but perhaps more transparent) measure of the business cycle correla- tion was proposed by Bayoumi and Eichengreen (1997). They proxy the asymmetry by a standard deviation of percentage changes in the relative output of the two countries. Thus, a low value indicates a relative symmetry in business cycles, and vice versa. This measure
4 Total exports for countries are decomposed into merchandise, food and miscellaneous. Summing up the differences of the shares of these categories in the total of the two economies we obtain a measure of similarity of the trade commodity structures. For details see original paper. Computation of a similar measure between the Czech economy and the EU is quite tedious for it requires the commodity composition of the total EU trade, which is not readily available.
5 Whether one can already identify an occurrence of business cycles in the transitional environment remains an open question. What we mean here is a mere correlation in output or employment fluctuations.
6 The higher symmetry of the Czech and German business cycles rather than with the rest of the EU confirms the findings of other authors who claim that a broadly based EMU does not fulfil the criteria of an optimal currency area and is bound to encounter serious long-term problems (de Grauwe, 1996, Bayoumi and Eichengreen, 1993, 1997). On the other hand, these studies usually confirm optimality for the core of the EU, i.e. Germany, Benelux and Austria.
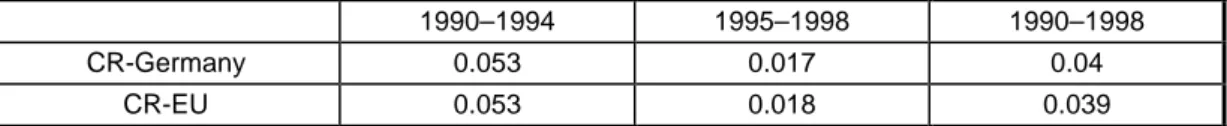
computed from annual data for two periods: 1990–1994 and 1995–1998 with respect to Germany and the EU is shown in Table 3 (variable SDY).
As expected, the asymmetry is quite high for the first period and significantly lower for the second. This indicates a high speed of structural convergence and corresponds to the find- ings of Boone and Maurel. More surprisingly, though, this measure does not reveal any significant difference with respect to the EU: the symmetry is only marginally worse than that of Germany. Nevertheless, we conclude that, while the achieved degree of structural conver- gence is high, Germany seems to be a better partner for the currency union than the EU as a whole.7
Table 3: Variable SDY: standard deviation of relative output disturbances
1990–1994 1995–1998 1990–1998
CR-Germany 0.053 0.017 0.04
CR-EU 0.053 0.018 0.039
Source: IFS November 1999.
All the hitherto discussed variables measure the likelihood of idiosyncratic shocks, which would translate themselves into macroeconomic costs, should the economies be deprived of a flexible exchange rate. A possible proxy for benefits stemming from monetary unification could be a relative country size of the Czech economy and Euroland (Bayoumi and Eichengreen, 1997). Table 4 presents such a variable (called SIZE) computed as an average of the loga- rithm of Czech and German (EU) GDPs. The absolute value of the variable carries little meaning and could be loosely interpreted as a transaction value of national currencies. Its dynamics reveal that, after a rise in the period 1993–1995, they have remained stable over time. A comparison of Germany and EU values demonstrates that the transactional advan- tages of using a single currency are greater for smaller (Germany and CR) than for larger (EU and CR) regions.
Table 4: Variable SIZE: benefits of national currencies
1993 1994 1995 1996 1997 1998 1993-1994 1995-1998 1993-1998 CR-Ger. 5.41 5.46 5.55 5.57 5.53 5.54 5.44 5.55 5.51
CR-EU 5.64 5.69 5.77 5.80 5.76 5.78 5.67 5.78 5.74
Source: IFS November 1999.
7 An important corollary of these findings is that the adoption of Euro by the Czech Republic and other CEECs could complicate the functioning of the EMU as a whole. The inclusion of these countries in the union would enhance the weight of the part tied to Germany and weaken the linkages of other peripheral countries, such as Spain, Portugal, Ireland, or Greece. This might create extra tensions in the system, eventually causing major disruptions in the wake of serious economic troubles.
To sum up, we have reviewed the main characteristics identified by the OCA literature as preconditions for a currency unification of the Czech and EU economies: the importance of transaction costs, trade orientation, the commodity composition of foreign trade and asymmetric disturbances of output. At best, we have come to a mixed conclusion. On the one hand, we have found the asymmetry in trade orientation high enough to warrant caution against asymmetric shocks. On the other, the correlation of business cycles and the similari- ties of export structure did not reveal such shocks and pointed to a remarkable speed of structural convergence. In addition, the potential benefits of removing transaction costs ap- pear to be large for a small country such as the Czech Republic. Yet, one might object to the latter conclusions, because, since we used only a short time series, the real danger of a potential collapse does not come from regular disturbances, which we had a chance to measure.
Nevertheless, we would like to combine the above measures into a single variable that would give us an indicative measure of the readiness of a country to adopt a foreign currency.
Bayoumi and Eichengreen (1997) provide such a variable labeled as an ‘OCA index’. They postulate that the historically observed volatility in bilateral exchange rates should reflect these conditions irrespective of the actual exchange rate regime.8 Then the countries satisfy- ing the OCA criteria should experience a low volatility of bilateral exchange rates and vice versa. Hence, using a large sample of industrial countries, the authors look for a historical relationship between the observed volatility of bilateral exchange rates and the proxies for asymmetric output disturbances (SDY), the similarity of the commodity export structure (SIM), trade orientation (TRADE) and the usefulness of a single currency in transactions (SIZE). They find the impact of all these variables to be significant, with the expected signs.9 In addition, this relationship has proven stable across different periods.
The latter result allows this relation to be used for predictions about the appropriateness of a common currency between any pair of countries. The authors themselves use this relation to examine the readiness of then EMU candidate countries to form a monetary union with Germany and with each other. Their findings went along with the accepted view disentangling the candidate countries into three groups: converged, converging and diverging countries.
Relying on the stability of this relationship, we use it in a similar vein and test the readiness of the Czech economy to form a monetary union with Germany and the EU as a whole. We choose these two relations, because other studies have indicated possible differences be-
8 From this perspective, the choice of the exchange rate regime (at least among developed countries) is in fact endogenous of the factors identified by the OCA theory, possibly with some lags.
9 The actual regression relationship estimated by Bayoumi and Eichengreen is:
Standard deviation of bilateral exchange rate = -0.09+1.46*SDY+0.22*SIM-0.054*TRADE+0.012*SIZE.
When used for predictions, the dependent variable is replaced by the OCA index measuring the inappropriateness of a common currency between the two areas.
tween the two. As in the original study, the outcome of the prediction can be labeled as an 'OCA index', for it predicts the volatility of the bilateral exchange rate in the given period. The lower is the value of the index, the more appropriate is the common currency for a given pair of countries. Obviously, there is no benchmark to discriminate between the two extremes, so the index is only meaningful when compared over time or for a set of countries. Because of data shortage, we decompose the transition era of the Czech economy into two periods 1990–1994 and 1995–1998 and compute the OCA index for each, using the values (or their averages) shown above when discussing individual factors.
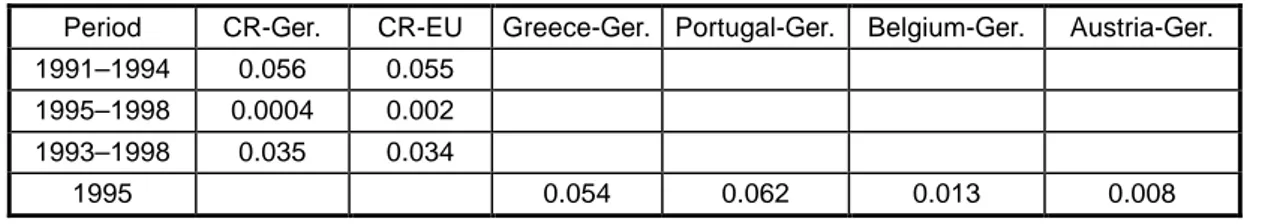
The results are reported in Table 5, together with the original 1995 estimates of Bayoumi and Eichengreen for several countries of interest. As we can observe, the readiness of the Czech economy for a common currency with both Germany and the EU in the first period was quite low, roughly on the level of Greece and Portugal with respect to Germany in 1995. On the other hand, in the second period the Czech economy achieved remarkable convergence, with the value of the index comparable to those of Austria or Belgium, i.e. the core of the EMU, in 1995. The sound drop in the value of the index is mainly due to a high synchrony of the business cycles10 in the second period (see above), but fast convergence was also registered in the commodity composition of exports and trade orientation.
Table 5: OCA index versus Germany and the EU11
Period CR-Ger. CR-EU Greece-Ger. Portugal-Ger. Belgium-Ger. Austria-Ger.
1991–1994 0.056 0.055 1995–1998 0.0004 0.002 1993–1998 0.035 0.034
1995 0.054 0.062 0.013 0.008
Source: Bayoumi and Eichengreen 1997, our computations.
Hence, upon examining the basic forces identified by the OCA theory as determinants of the usefulness of a single currency between the Czech and EMU economies, we may conclude that the economy has achieved a relatively high degree of structural convergence.12 Though some important differences (especially in the trade orientation) remain, the likelihood of real asymmetric disturbances has been substantially reduced and is falling rapidly. In other words, the benefits assumed to accrue from the single currency seem to outweigh the danger of an external asymmetric shock These features favour a fixed exchange rate arrangement between the Czech and EMU economies.
10 The index is very sensitive to the SDY variable, i.e. the standard deviation of relative output disturbances.
11 Because we do not have the variable SIM (similarity in the commodity composition of exports) for the CR and EU, we use that of Germany instead in the OCA index for the EU. Because we assume that the similarity for the EU will be lower in reality, our OCA index for the EU should be considered only as a lower bound for the true one.
12 Bayoumi and Eichengreen report that values of OCA index for US, Japan and Germany vary between 0.09 and 0.15.
After the investigation of the usual sources of real asymmetric disturbances, we attempt to explore the possibility of specific (transitional) features, which would make the economy prone to a particular type of real shocks. On principle, these dangers may lie in the malfunc- tioning of the factor markets for the labour and capital (see de Grauwe, 1996). In particular, we point to the labour market and its relationship to the real exchange rate. We decompose the hitherto real appreciation into structural and cost factors and conclude that from a longer- term perspective cost factors account for a considerable part of the appreciation. We measure the competitiveness effect of this mechanism as an appreciation of the real ex- change rate, deflated by industrial production prices acting as a proxy for tradable goods prices. Further-more, we demonstrate that this appreciation is mainly driven by rising unit labour cost and document its negative impacts on our exporters by showing that the growth of exports in the recent period comes at the cost of falling profit margins.
Specific Transitional Features: Structural and Cost Factors of Real Appreciation
The trend of real appreciation is a characteristic feature of transitional economies. It is well documented in Halpern and Wyplosz (1997). The real exchange rate of the Czech crown with respect to German mark appreciated since the beginning of 1993 by more than 30%. An unambiguously appreciating pattern of the real exchange rate can be observed until the spring of 1997, i.e. throughout the period when the central bank adhered to an almost fixed exchange rate regime. Since then, we notice fluctuations of the real rate, largely mirroring those of the nominal rate. It follows that the nominal rate significantly affects the real rate.13 (See Figure 1, real exchange rate based on CPI – variable RCPI).
There are basically two broad sets of arguments behind the observed real appreciation. One holds that this development is a result of worsening competitiveness and cost pressures, especially on the side of wages (Vavra, 1999). The other highlights the transitional nature of the economy and interprets this trend as a natural or 'equilibrium' behaviour of the economy coming from structural factors, having no adverse effects on the competitive position (Halpern and Wyplosz, 1997, Krajnyak and Zettelmeyer, 1998). While, according to the first view, continuation of the present trend threatens downward nominal exchange rate adjust- ment, the 'structural' view seems to have no such consequences. Below, we consider these structural and cost arguments in turn.
13 In other words, this points to some amount of price rigidity.
Figure 1: Real exchange rates
70 75 80 85 90 95 100 105 110
1/93 6/93 11/93 4/94 9/94 2/95 7/95 12/95 5/96 10/96 3/97 8/97 1/98 6/98 11/98 4/99 9/99
Appreciation
RCPI
RPPI Nominal rate
Cost Factors of Real Appreciation: Excessive Real Wage Growth
To determine shares of structural and cost factors in the real appreciation of the crown, we need to know the evolution of prices of tradable and non-tradable goods at home and in a reference country EU (for example in Germany.14 Such indexes are not readily available, but one can consider the index of industrial producer prices (PPI) to be an indicator of the trad- able goods prices. Consequently, we may construct the index of the real exchange rate based on domestic and foreign PPIs. The time path of this indicator, shown as RPPI in Figure 1, reveals an appreciation of about 20-25% over the sample period. We argue that the trajectory of such a real exchange rate reflects an influence of cost factors and indicates a loss of competitiveness.
Ideally, one would expect RPPI to stay constant over time. There are three assumptions that underlie this statement. Firstly, there is an obvious presumption of a law of one price. If goods and currency markets are integrated, tradable and traded goods should have the same price everywhere. Secondly, we have to assume that both price indexes consist of the same or similar baskets of goods and, thirdly, that price indexes are adjusted for changes in quality.
The observed appreciation of RPPI can be explained by a violation of some of the three assumptions. The possibility that quality improvements account for a major part of apprecia-
14 More precise approach would be to investigate effective exchange rates, but data are not readily available.
tion is excluded by the very construction of indexes. According to the information provided by the Czech Statistical Office, the price index should not change when a price of a piece in- creases due to the change of its quality. Therefore, to the extent that the price indexes refer to the same basket of goods, the appreciation in RPPI is allowed by market segmentation and other barriers to trade.15 In other words, although the goods are tradable in nature, obstacles to international competition and product differentiation allow domestic producers to charge higher prices than their German counterparts.
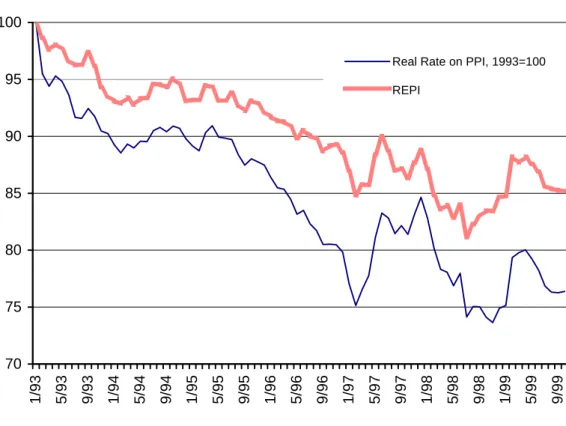
To see how realistic the hypothesis that RPPI is not constant, owing to the existence of differentiated goods and market power is, we have to distinguish between the pricing behav- iours of actual and only potential exporters (included in PPI). For this purpose, we construct another index of the real exchange rate, which controls the difference between domestic and foreign markets and possible distortions stemming from the distinct composition of indexes at home and abroad. An ideal measure in this sense would be an index composed of Czech export prices and foreign producer prices, both categorised according to the type of produc- tion, e.g. by SITC. If the hypothesis performs well, these indexes should be more stable than RPPIs (again classified by SITC). As a proxy for these measures, we construct an overall index (REPI) comprising export prices and foreign producer prices (not classified by SITC).
As can be observed from figure 2, even this approximation reveals more stability than the original RPPI. We can conclude that the domestic market is to some extent sheltered from international competition and that producers can sell at home at higher prices than abroad.
15 In short, the world demand for such goods is not perfectly elastic as would be the case for purely homogenous articles.
Figure 2: Real exporters price index (REPI)
70 75 80 85 90 95 100
1/93 5/93 9/93 1/94 5/94 9/94 1/95 5/95 9/95 1/96 5/96 9/96 1/97 5/97 9/97 1/98 5/98 9/98 1/99 5/99 9/99
Real Rate on PPI, 1993=100 REPI
We would expect the higher degree of market power of domestic sellers relative to exporters (who are price-constrained by international competition) to translate into their better profitability. To obtain more clear-cut evidence, we directly investigate the performance of a sample of Czech exporters.16 The data classified according to the share of exports in sales and presented in table 6 support our view: Measured by the profitability of earnings, the group of companies exporting between 1% and 15% of their sales performs much better than firms exporting above 50% of their sales.
Table 6: Sales profitability of exporters (after interest and tax)
Branch Exporters Exporters classified by shares of exports in sales (in %)
1 % - 15 % 50 % - 100 %
1994 1995 1996 1997 1998 1994 1995 1996 1997 1998 1994 1995 1996 1997 1998 Total 1,72 2,14 -0,01 -0,05 0,15 8,17 6,16 5,41 1,74 2,8 -0,68 0,01 -3,89 -1,37 -1,94 Chemicals 3,76 2,41 1,6 -2,37 0,9 5,27 2,74 0,1 -4,12 2,65 3,32 2,65 1,42 -11,27 -3,21 Manufac-
turing 0,26 0,98 -0,43 -0,44 -0,83 1,38 1,06 -0,52 -2,62 -3,76 -0,62 0,32 -1,76 -1,52 -1,79 Source: Buchtikova (1999).
16 This part heavily draws on the analysis of financial performance of exporters by Alena Buchtíková (1999). Her sample includes more than 300 of the biggest Czech exporting companies, accounting for more than one third of the total 1998 exports.
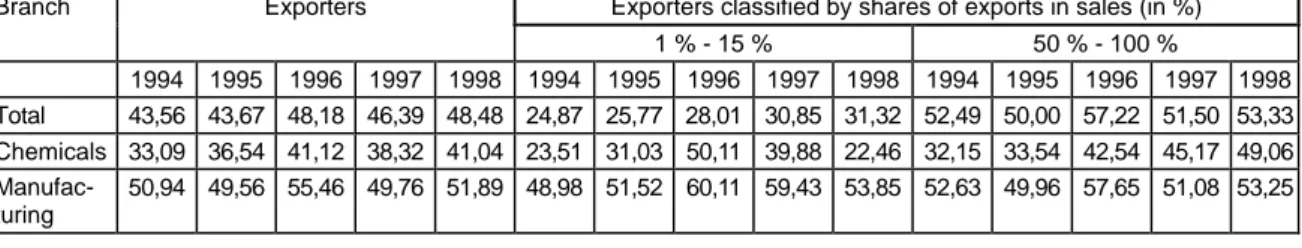
Having demonstrated that the domestic market is sheltered and generates higher profits for domestic-oriented firms, we turn to their dynamic features. Time series of sales profitability for firms exporting between 1% and 15% of sales point to a steep decline in this indicator between 1994 and 1998. In a quest for causes of this fall we observe that the labour share of value added in these companies substantially increased over the same period (Table 7).
Hence an obvious interpretation is that domestically oriented firms did not use their market power to increase profitability because they were constrained by rising labour costs. We provide further evidence in this direction below.
We may therefore associate the appreciation of RPPI with an accumulated potential of profit- ability loss, which would materialise when markets integrate and competition increases. If obstacles against international competition are removed and wages do not drop, firms would find themselves in a complicated position.
Table 7: Share of labour in value added of exporters
Branch Exporters Exporters classified by shares of exports in sales (in %)
1 % - 15 % 50 % - 100 %
1994 1995 1996 1997 1998 1994 1995 1996 1997 1998 1994 1995 1996 1997 1998 Total 43,56 43,67 48,18 46,39 48,48 24,87 25,77 28,01 30,85 31,32 52,49 50,00 57,22 51,50 53,33 Chemicals 33,09 36,54 41,12 38,32 41,04 23,51 31,03 50,11 39,88 22,46 32,15 33,54 42,54 45,17 49,06 Manufac-
turing
50,94 49,56 55,46 49,76 51,89 48,98 51,52 60,11 59,43 53,85 52,63 49,96 57,65 51,08 53,25 Source: Buchtikova (1999).
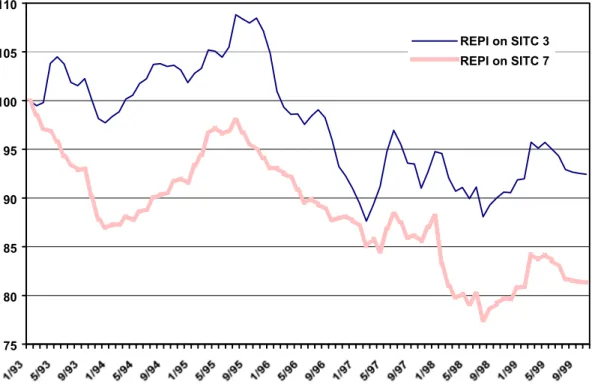
A very similar analysis comparing export market oriented and domestic market oriented firms may be done across sectors. Firstly, note that index REPI still reveals a significant real appreciation and thus deviates from the purchasing power parity. In line with our earlier discussion, this may be attributed to an inelastic world demand for differentiated products. As a further test of our hypothesis, we compare in Figure 3 indexes REPI for two SITC sectors.
We chose to compare a commodity group SITC 3 (mineral fuels, lubricants and related materials), with the group SITC 7 (manufacturing), because of an apparent difference in the homogeneity of their products. Indeed, manufacturing deals with more differentiable goods than a commodity industry whose products are relatively homogenous and whose world demand is very elastic and less influenced by marketing efforts. In the figure, REPI 7 appreciates more than REPI 3. Moreover, the extent of the observed appreciation in the commodity group index is much less pronounced and the process seems to be reverting without an apparent trend. This supports our statement that, in the absence of market segmentation and barriers to trade, the RPPI would perhaps fluctuate around a constant.
Figure 3: Real exporters price index (REPI) on different commodity groups
75 80 85 90 95 100 105 110
REPI on SITC 3 REPI on SITC 7
Analogously to the case of more and less exporting firms, we expect manufacturing export- ers to be better off than producers in the SITC commodity group 3 belonging to a broader class of chemicals. Again, the data confirm this expectation. As shown in Table 6, measured by the profitability of sales, the situation of chemical producers17 exporting more than 50%
has worsened relative to the situation of manufacturers with the same share of exports.
Again, the development of labour shares goes well with the argument: unlike manufacturers, commodity producers suffered more from a rise in the labour share of value added.
Now we want to explore how an increasing total volume of exports fits into our dire picture.
Indeed, statements about problems with competitiveness seem to be conflicting with the fact of growing exports whose volumes are shown in Table 8. The simultaneous increase of “real”
export prices (REPI) together with the volume of exports might have been caused by two factors. The world demand for our products exogenously increases because of the improved overall economic situation or because domestic firms are able to market their products more effectively. This might for instance mean that firms abandon their introductory pricing or that they find market niches to exercise their market power.
17 Chemicals comprise very homogenous products (oil, petrol) but also differentiated goods (pharmaceuticals) where we would expect better profitability. However, a share of the latter is not large enough to prevent us from bracketing chemicals with non-differentiated goods.
Table 8: Growth of exports (prev. year = 100)
1995 1996 1997 1998 1999
117.7 107.3 110.8 118.0 103.1
This surely is a very positive conclusion; however, a question of its sustainability must be raised. Table 7 documents the rise in labour share of value added in the sample of exporting companies and the fact that this share is higher for firms exporting more. Further more, the evolution of profitability of the same companies provided in Table 6 demonstrates that rela- tive profits (especially of more exporting companies) decline over time. Natural interpretation is that the higher labour share cuts the operation surplus of exporters and leaves less room for profits. Growth of exports at zero or negative profit margins is unsustainable in the long run, because it precludes further expansion and capital intensive innovation necessary for long-term success.18 Moreover, building brands and other forms of marketing are costly activities whose financing is undermined by the profitability decline. To put it plainly: while product differentiation has its limits, trade union demands may continue forever.
The low return on capital also shifts the interest of investors away from exporters towards more domestically orientated producers, whose capacity to transfer high wage costs into prices is higher owing to lower competition. This sheltering from international competition may in many cases be only temporary, though, for the progress in integration assumes reduction of various obstacles against trade.19 Many producers of now non-traded, but potentially tradable goods will then find themselves uncompetitive.
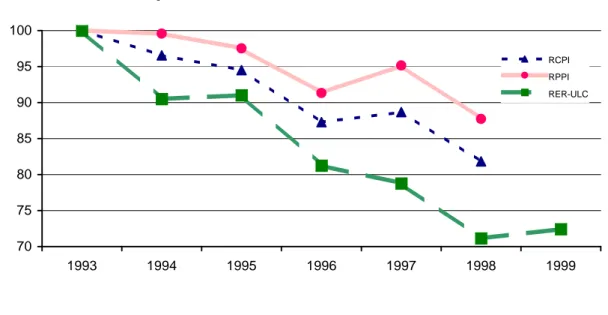
Having identified the rising labour share as a cause of the worsened profit performance of tradable goods producers, we explore the mechanics of this increase. Specifically, if the fall in profit margins indeed suggests problems with competitiveness, we should find the domes- tic labour to be increasingly expensive relative to its international competition. For that purpose, we constructed the index of relative unit labour costs in manufacturing in a common currency with respect to Germany.20 We present it in Figure 4 (as RER-ULC) together with the real exchange rates on CPI and PPI.
18 Buchtíková (1999) demonstrates a dynamic impact of this fall in profitability: investment growth slows and no retained earnings are accumulated in exporting companies to sustain further expansion.
19 E.g. consider internalisation of tenders for public works after entering the EU.
20 Absolute level of this indicator means how much costlier (in terms of wage costs) it is to produce a unit of manufacturing good in Germany relatively to the Czech Republic. As such it could also be interpreted as a real exchange rate based on unit labour cost, hence the acronym RER-ULC.
Figure 4: Real exchange rate on nominal unit labour costs in manufacturing vis-à - vis Germany
70 75 80 85 90 95 100
1993 1994 1995 1996 1997 1998 1999
RCPI RPPI RER-ULC
Source: OECD.
The domestic unit labour costs have been substantially rising over time and their contribution to the appreciation of the indexes RPPI and RCPI is apparent. Figure 5 documents that this marked rise in the unit labour costs comes from a high-wage inflation, exceeding productivity improvements.
Figure 5: Real wages and productivity in manufacturing
100 110 120 130 140 150 160
1993 1994 1995 1996 1997 1998 1999
Real producer wage Productivity
Real consumer wage
Source: OECD, CSO.
The inflation in wages has caused the real production wage to depart from the development of productivity, leading to a rise in the real unit labour cost (or labour share of value added) documented above. We have therefore enough evidence for our claim that the observed real appreciation from a large extent reflects a worsened competitive position that is driven by an excessive wage growth.
The figure also suggests the movements in the real consumption wages as the force pushing the real production wages up. A high inflation among non-tradable goods made workers de- mand high nominal wages to compensate for the loss of purchasing power. Implicit assump- tion here is that real wages are determined in a wage bargaining mechanism. Indeed, the institutional setting (OECD, 1998) is that of a multilevel nation-wide wage bargaining be- tween labour unions and employers with more or less active government. Such a setting enables the real wages to be monopolistically set above a market clearing level in a neoclassical sense, pointing to a real rigidity21 in the Czech labour market. In terms of the OCA theory, this rigidity may be interpreted as a sequence of real adverse asymmetric shocks (which require an adjustment in the nominal exchange rate) because of its negative long-term effects on output and employment. The deteriorating competitiveness truly exer- cises depreciating pressure on the exchange rate both through deterioration of the current account and the outflow of capital from non-profitable domestic producers.
Structural Factors of Real Appreciation
The preceding analysis implies that an appreciating trajectory of RPPI reveals unbalanced and, from a longer perspective, dangerous tendencies. Conversely, the difference between RPPI and RCPI (real exchange rate based on CPI) in Figure 1 may be attributed to structural factors of transformation. These structural factors push up inflation in non-tradable items and hence increase the CPI inflation above that of tradable goods (proxied by PPI inflation).
Examples of such transition specific factors include a gradual removal of price barriers on socially sensitive goods and services or initially low initial price level previously sustained through a relative isolation of the economy.
The economic rationale behind the structural factors recognises that aggregate inflation is composed of two parts: first, tradable goods inflation which is more or less determined by foreign inflation and changes in the exchange rate, and second, movements in the relative price of non-tradable to tradable goods. Structural reasons of a real appreciation can be tied to determinants of the relative price of non-tradable goods. Assuming labour as the only factor of production and wage homogeneity between the two sectors, it can be shown under
21 The excessively high real wage in the presence of rising unemployment is a sign of real wage rigidity. This form of rigidity is different from the nominal (downward) rigidity discussed in the section of non-currency adjustment channels, although both point to a low flexibility in the labour market in general. Though it may lead to depreciation, this will not help remove the underlying cause and provide only a temporary relief.
a wide range of possible settings (see for instance Obstfeld and Rogoff, 1996 ch. 4) that this relative price is determined by relative marginal productivity of labour in the two sectors.22 Within this framework, a country will experience a higher growth in relative price of non-trad- ables if its labour productivity differential between tradable and non-tradable goods rises faster than in a reference country.23
From Figure 1 we observe that these structural factors have indeed caused a real apprecia- tion; however, to a much lower extent than the cost factors (incorporated in RPPI). We may conclude that a considerable role in the hitherto real appreciation can be attributed to the cost factors worsening the competitive position of the Czech economy.
Nevertheless, several other authors identify the process of real appreciation commonly ob- served among transition countries as an equilibrium or structural phenomenon stemming from initially undervalued wages, which gradually return to their ‘equilibrium’ levels (see for instance Halpern and Wyplosz, 1997 or Krajnyák and Zettelmeyer, 1998). These studies attempt to estimate the ‘equilibrium’ dollar wages using large panels of countries, using productivity, schooling, and other characteristics of physical and human capital as explana- tory variables. They found that actual dollar wages in transition countries were below esti- mated equilibrium levels. For the Czech republic, Krajnyák and Zettelmeyer report the actual 1995 dollar wage to be at 54-66pct of the "equilibrium" one, depending on specification.
Moreover, they argue to have more likely erred underestimating this ‘equilibrium’ dollar wage.
We may only respond to these arguments by noting that if wages have truly been so much below the equilibrium levels then we are left to explain where the large competitive advan- tage, rendered by the low wage costs, has evaporated. We do not know of such a story, which obviously does not mean it does not exist. However, as the authors note, the esti- mated equilibrium wages represent an estimate of what the country could “afford” based on several above listed regressors whose specification assumes a transition country to be identical to a representative developed country in all other respects. Yet, authors note that inclusion of direct measures of other, e.g. institutional, factors did not substantially affect their estimates. Unfortunately, they do not provide a list of the measures used to capture such factors as property rights, the legal framework or political uncertainty. We deem such vari- ables extremely difficult to construct, but we believe they make crucial difference for a transi- tion country. Although, at the first sight, the Czech institutional environment seems compati- ble to a market economy, many authors have already noted substantial deficiencies. For
22 In another words, demand plays no role in relative price determination.
23 This mechanism, commonly known as the Ballassa-Samuelson effect, can be intuitively understood in the following way. Rising labour productivity in tradables provides room for nominal wage increases which spill-over to non-tradable sector. Since productivity gains in the non-tradable sector are traditionally lower, the higher wages will feed into higher relative prices of non-tradables. Because growth in prices of tradables is tied to foreign inflation through price taking behaviour (and assuming fixed exchange rate), the country will also experience higher inflation than a reference economy.
example, the way voucher privatisation was pursued and legal system transformed had far reaching consequences for the ownership structure, corporate governance, and manage- ment. (Stiglitz, 1998, Weiss and Nikitin, 1998, Ellerman, 1998)
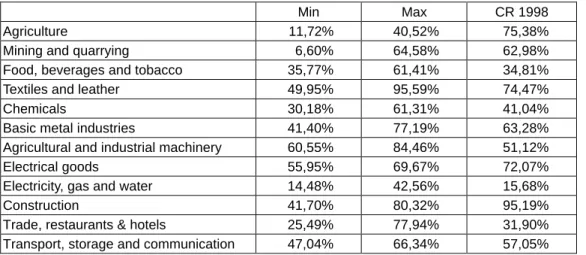
Moreover, an exceptionally low pre-transition level of wage costs did not guarantee the domestic goods to be easily marketable in international markets because of various other non-price factors. Holding these factors constant, changes in the relative costs are more important than their absolute level. And the analysis above has demonstrated a rise in these relative labour costs, alongside a fall in profit margins to near zero, fall in investment activity and retained earnings. This in our view represents a serious deterioration in the competitive position of Czech producers and cannot be treated as an equilibrium structural feature of a transition economy. Nevertheless, to give justice to the line of argument of the other studies, we report in Table 9 a range of labour shares of value added in various industrial sectors of OECD countries and the Czech economy in 1998. Though on average the Czech share falls at the lower end of this range, it is not significantly different and in many sectors it is actually well within the range or even close to its upper end. In our opinion, this gives a qualification to the conclusions that Czech wages (and labour costs) are well below their equilibrium levels.
Table 9: Labour shares of value added in manufacturing internationally.
Min Max CR 1998
Agriculture 11,72% 40,52% 75,38%
Mining and quarrying 6,60% 64,58% 62,98%
Food, beverages and tobacco 35,77% 61,41% 34,81%
Textiles and leather 49,95% 95,59% 74,47%
Chemicals 30,18% 61,31% 41,04%
Basic metal industries 41,40% 77,19% 63,28%
Agricultural and industrial machinery 60,55% 84,46% 51,12%
Electrical goods 55,95% 69,67% 72,07%
Electricity, gas and water 14,48% 42,56% 15,68%
Construction 41,70% 80,32% 95,19%
Trade, restaurants & hotels 25,49% 77,94% 31,90%
Transport, storage and communication 47,04% 66,34% 57,05%
Source: OECD, International Sectoral Database. Minimum and maximum values are of 15 OECD countries.
Specific Transitional Features: Capital Inflow
We have noted previously that the wage-driven deterioration in the competitiveness exer- cises a depreciating pressure on the exchange rate both by the deterioration of the current account and the outflow of capital from non-profitable domestic producers. The fact that this pressure is not always accommodated by exchange rate depreciation is attributable to the long-term inflow of foreign capital.