IHS Economics Series Working Paper 227
October 2008
The Enhanced Use of Wood- biomass: Macroeconomic, Sectoral
and Environmental Impacts
Todor Balabanov
Wolfgang Schwarzbauer
Impressum Author(s):
Todor Balabanov, Wolfgang Schwarzbauer Title:
The Enhanced Use of Wood-biomass: Macroeconomic, Sectoral and Environmental Impacts
ISSN: Unspecified
2008 Institut für Höhere Studien - Institute for Advanced Studies (IHS) Josefstädter Straße 39, A-1080 Wien
E-Mail: o ce@ihs.ac.at ffi Web: ww w .ihs.ac. a t
All IHS Working Papers are available online: http://irihs. ihs. ac.at/view/ihs_series/
This paper is available for download without charge at:
https://irihs.ihs.ac.at/id/eprint/1865/
The Enhanced Use of Wood-biomass
Macroeconomic, Sectoral and Environmental Impacts
Todor Balabanov, Wolfgang Schwarzbauer
227
Reihe Ökonomie
Economics Series
227 Reihe Ökonomie Economics Series
The Enhanced Use of Wood-biomass
Macroeconomic, Sectoral and Environmental Impacts
Todor Balabanov, Wolfgang Schwarzbauer October 2008
Institut für Höhere Studien (IHS), Wien
Institute for Advanced Studies, Vienna
Contact:
Todor Balabanov
Department of Economics and Finance Institute for Advanced Studies Stumpergasse 56
1060 Vienna, Austria : +43/1/599 91-243
email: todor.balabanov@ihs.ac.at
Wolfgang Schwarzbauer
Department of Economics and Finance Institute for Advanced Studies Stumpergasse 56
1060 Vienna, Austria : +43/1/599 91-112
email: wolfgang.schwarzbauer@ihs.ac.at
Founded in 1963 by two prominent Austrians living in exile – the sociologist Paul F. Lazarsfeld and the economist Oskar Morgenstern – with the financial support from the Ford Foundation, the Austrian Federal Ministry of Education and the City of Vienna, the Institute for Advanced Studies (IHS) is the first institution for postgraduate education and research in economics and the social sciences in Austria.
The
Economics Series presents research done at the Department of Economics and Finance andaims to share “work in progress” in a timely way before formal publication. As usual, authors bear full responsibility for the content of their contributions.
Das Institut für Höhere Studien (IHS) wurde im Jahr 1963 von zwei prominenten Exilösterreichern –
dem Soziologen Paul F. Lazarsfeld und dem Ökonomen Oskar Morgenstern – mit Hilfe der Ford-
Stiftung, des Österreichischen Bundesministeriums für Unterricht und der Stadt Wien gegründet und ist
somit die erste nachuniversitäre Lehr- und Forschungsstätte für die Sozial- und Wirtschafts-
wissenschaften in Österreich. Die Reihe Ökonomie bietet Einblick in die Forschungsarbeit der
Abteilung für Ökonomie und Finanzwirtschaft und verfolgt das Ziel, abteilungsinterne
Diskussionsbeiträge einer breiteren fachinternen Öffentlichkeit zugänglich zu machen. Die inhaltliche
Verantwortung für die veröffentlichten Beiträge liegt bei den Autoren und Autorinnen.
Abstract
The main objective of this paper is to identify fuel substitution potential by estimating potential price induced energy substitution and by considering available technological options. We consider the impacts of CO
2taxation on reduction of emissions until 2020, assuming CO
2neutrality of burning fuel wood. We finally address the macroeconomic, environmental and sectoral impacts of enhanced usages of fuel wood for energy. The main assumptions are a 1.5 times increase of fuel wood use by 2020 and achieving a share of renewables of 29.83 %. The main outcome for this scenario is that the Austrian economy could benefit from the double dividend of sustained economic growth and fulfilment of EU targets on renewables and CO
2reduction. The prospects for the energy intensive industries deteriorate – most of them would have to reconsider their technological options and face adverse conditions for their production sites.
Keywords
Sustainable development, aggregate supply and demand analysis, demand and supply of renewable resources and conservation
JEL Classification
Q01, Q11, Q21
Comments
This research was supported by the Jubilaeumsfonds of the Austrian National Bank Grant no. 12497.
Contents
1. Introduction and research objectives 1 2. Macroeconomic and forest sector-specific quantitative
models 3 3. Scenario building 4
3.1. Price sensitivity and Resource limitations ... 4
3.2. Technology ... 5
3.3. From the energy use trends to the energy balance for 2020 ... 5
3.4. Externalities ... 7
4. Macroeconomic, sectoral and environmental impacts of the fuelwood-for-energy scenario 8 4.1. Macroeconomic performance ... 8
4.2. Sectoral growth ... 9
4.3. Household’s expenses ... 9
4.4. Energy... 10
4.5. Environment ... 11
5. Summary and Conclusion 13
References: 14
Appendix 15
1
1. Introduction
From the experience of the last decades it became clear that national energy systems, including the Aus- trian, are highly interdependent, in that a variety of energy forms can be employed to satisfy many end uses. Secondly, alternative production modes compete for many of the same resources. Thirdly physical and technological limitations can restrict the supply or potential uses of energy. Fourthly environment ef- fects or other externalities can alter the permissible production and use patterns, and that eventually new technologies can rapidly transform the options available.
The development of a national energy policy must therefore include a description and assessment of these and other complexities. The evaluation of alternatives must be done within the framework of a flexi- ble system, able to include the diverse approaches that are necessary to describe and quantify the many components of the energy system.
To perform this comprehensive analysis, we combine two models, a quantitative forest-sector specific model (FOHOW) and a computable general equilibrium macroeconomic model (ATCEM-E3). Therefore we address the complex system interaction between macroeconomics, the main economic sectors, in- cluding the forest sector, and the environment (for more details see Balabanov, Revesz, 2007 and Bala- banov et al., 2008).
The aim of this study is a quantification of demand, supply, trade and prices of wood products (including wood for energy
1- further denoted as fuel wood) and their macroeconomic and sectoral impacts.
The price system is the primary mechanism for developing an efficient allocation of any economic good, including energy. Changes in prices affect the demand and supply for energy and the resulting structure of the energy use. As of mid September 2008, there was almost four times difference between the prices of fuel oil and of the wood briquettes, and the electricity tariffs are rending electrical heating 2.5 times more expensive than that using fuel oil.
Resource limitations can inhibit the increase in the potential fuelwood-for-energy supply. Storage and transportation capacities, shortages due to the not commercially active owners of the forest plots, or other limitations are a few candidates from the lengthy list of potential bottlenecks that must be addressed. To that end Forest Sector Simulation Model (FOHOW), as described in Balabanov et al. (2008), has taken care of detailed modelling of the prospects of the forest sector.
Environmental impacts are a prime example of side effects of energy production and consumption, and in our analysis we consider two particular externalities. Firstly burning fuel wood is a CO
2-neutral energy option, which might, however, adversely influence wood-processing industries. Secondly CO
2taxation and its elevation is a prime topic in environmental policies all across the world.
The conversion technologies exhibit great variation within the energy systems - conversion efficiencies, fuel requirements, product qualities and costs are useful parameters for describing current or proposed technologies. Latest developments in fuel wood based combined heat and electricity production facilities,
1
Wood-for-energy, or fuelwood, is a connotation for natural and processed wood burnables, e.g., wood briquettes,
wood pellets, cut wood, chopped wood, chopped wood, etc.
2
in reduced pellets prices and improved pellets burners, slumping prices for the conventional fuel- wood/brown coal burning furnaces, etc., are factors that we have duly recognized and are included in the evaluations of the technological potential.
Inter-fuel substitution and the competition between fuels are closely related to the issue of price sensitiv- ity. In evaluating the fuel substitution potential we consider the potential price induced by energy substitu- tion options.
Basically, the 1,200,000 Austrian households, which are using either fuel oil or electricity for heating, can determine the fuel switching potential that is estimated at 100 PJ/year.
The energy balance for 2020 is based on analysis of the trends in energy use, judgments on energy effi- ciency improvements and the potential for inter-fuel substitution.
A primary externality of the energy system is the interaction with the rest of the economy. The ATCEM-E3 model (see Balabanov, Revesz, 2007) provides a basis for evaluating economic impacts of the chosen fuel-wood-for-energy policies, both at macroeconomic and at the sectoral level – indicating the effects of the economic environment on energy decisions.
Our primary research objective is to evaluate the economic impact of fuel-wood-for-energy and CO
2taxa- tion policies at the macroeconomic and the sectoral level. We address the system interaction between macroeconomics, the main economic sectors, and the environment by quantifying the demand, supply, trade and prices of wood products and their macroeconomic and sectoral impacts. We secondly identify fuel substitution potential by estimating potential price induced energy substitution options and by considering the technological potential of combined heat and electricity production, improved pellets burners, but also the slumping prices for the conventional fuel wood/brown coal burning furnaces and pellets, etc. We consider the effects of a possible elevation of CO
2taxation in the light of the EU-target to reduce CO
2emissions by 20 % until 2020.
This paper is organised as follows: Section 2 briefly discusses the combination of the two models. The
following section develops the three scenarios. Section 4 discusses the simulation results and section 5
summarizes and concludes.
3
2. Macroeconomic and forest sector-specific quantitative models
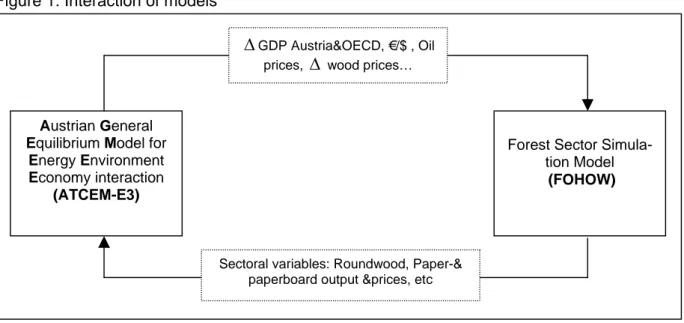
Our modelling framework combines two different models, a quantitative forest-sector specific and a quan- titative macroeconomic model. Therefore we address the complex system interaction between macro- economics, the forest sector and the environment. The main aim of the combination is the quantification of demand, supply, trade and prices of wood products (including wood for energy) and their macroeco- nomic impacts. The interaction of the models is shown in figure 1:
Figure 1: Interaction of models
Source: IHS.
As can be seen from the figure, the output generated by FOHOW is used to determine forest sector spe- cific variables. In a second step these variables are fed into ATCEM-E3, which generates macroeconomic and sectoral effects. These effects could then be used as an input for the FOHOW and so on.
We use these two models to analyse long-term socio-economic and environmental development resulting from the 3 scenarios considered to allow the relative competitiveness of the forest sector to be analysed in the local context as well as to account for the effects of globalisation.
Within ATCEM-E3 forestry is associated with a set of energy policy variables and both relate to the econ- omy that is represented by the social accounting matrix (for details see Balabanov, Revesz, 2007).
Austrian General Equilibrium Model for
Energy Environment Economy interaction
(ATCEM-E3)
Forest Sector Simula- tion Model (FOHOW)
Δ GDP Austria&OECD, €/$ , Oil prices, Δ wood prices…
Sectoral variables: Roundwood, Paper-&
paperboard output &prices, etc
4
3. Scenario building
3.1. Price sensitivity and resource limitations
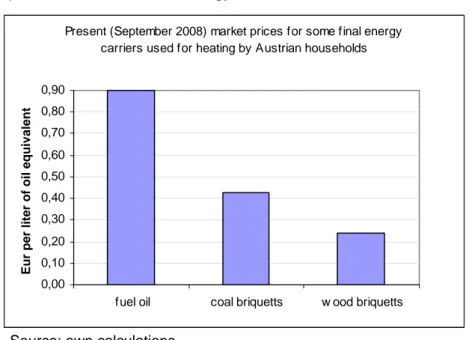
The price system is the primary mechanism for developing an efficient allocation of any economic good, including energy. Changes in prices affect the demand and supply for energy and the resulting structure of the energy use.
Figure 2 shows that the differential between the prices of fuel oil and of the wood briquettes is almost four times and the electricity tariffs are rending electrical heating up to 2.5 times more expensive than fuel oil.
This significant price differential should be broadly advertised, so that the households react by fuel switch- ing from oil/electricity to fuel wood in heating their residences.
According to Statistik Austria (2007) more than 955,000 Austrian flats/residences are being heated by natural gas, around 876,300 are being heated by oil, 590,000 households use Biomass and around 254,500 use electricity. Thus 1,150,000 Households are heated by oil and electricity, so that the potential of switching to fuel wood can be estimated to be around 100 PJ.
Figure 2: Market prices for selected final energy carriers.
Present (September 2008) market prices for some final energy carriers used for heating by Austrian households
0,00 0,10 0,20 0,30 0,40 0,50 0,60 0,70 0,80 0,90
fuel oil coal briquetts w ood briquetts
Eur per liter of oil equivalent
Source: own calculations.
Resource limitations can inhibit the increase in potential supply of fuel-wood-for-energy. Shortages due to the not commercially active owners of the forest plots, or other limitations, are examples from the lengthy list of potential bottlenecks, that must be addressed.
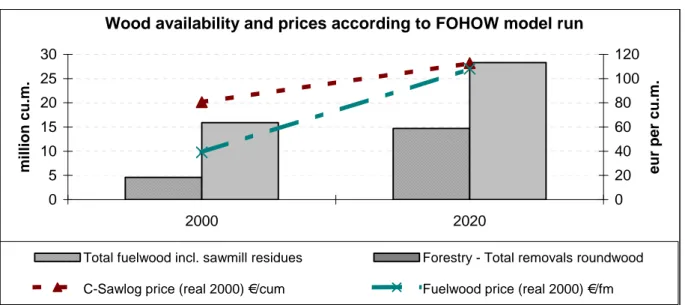
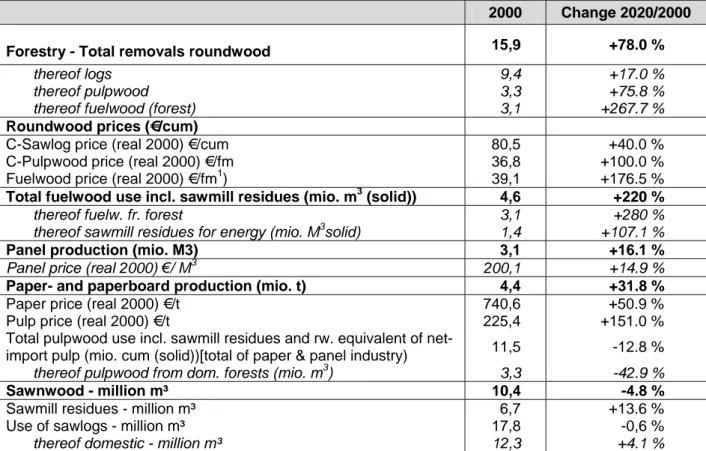
The output of the forest sector simulation model (FOHOW) is indicating substantial changes in the output,
demand and prices for Forestry raw materials and sectoral products between 2000 and 2020. For exam-
ple while the total removal of fuel wood is increasing by factor of 3 the real prices of it are increasing by
only 176.5 %, indicating that relative fuel wood prices are actually declining. Another interesting result is
that the paper- and paperboard production will decline relatively, i.e., increasing by 31.8 % - below the
growth rate of the GDP (48.7 %). (compare Table 2 in the appendix)
5
Figure shows that by 2020 there will be up to 25 million m
3(193 PJ ) indigenous roundwood available at the market with relative modest prices increases. The figures for fuelwood for 2020 are 15 million m
3or 116 PJ.
Figure 3: Wood availability and prices according to the FOHOW model run
Wood availability and prices according to FOHOW model run
0 5 10 15 20 25 30
2000 2020
million cu.m.
0 20 40 60 80 100 120
eur per cu.m.
Total fuelwood incl. sawmill residues Forestry - Total removals roundwood
C-Sawlog price (real 2000) €/cum Fuelwood price (real 2000) €/fm Source: FOHOW simulation.
3.2. Technology
Conversion technologies within the energy systems vary to great extent and conversion efficiencies; fuel requirements, product qualities and costs are useful parameters for describing current or proposed tech- nologies.
Latest developments in fuel wood based combined heat and electricity production facilities for town heat- ing, improved pellets burners, broad choice of conventional fuelwood/brown coal furnaces, etc., are fac- tors that we have duly recognized are included in the evaluations of the technological potential.
3.3. From the energy use trends to the energy balance for 2020
The data for the benchmark year 2000 were taken directly from Energiebilanzen Österreich (2007). The energy balance for 2020 is based on analysis of the trends in energy use, judgments on energy efficiency improvements and the potential for inter-fuel substitution.
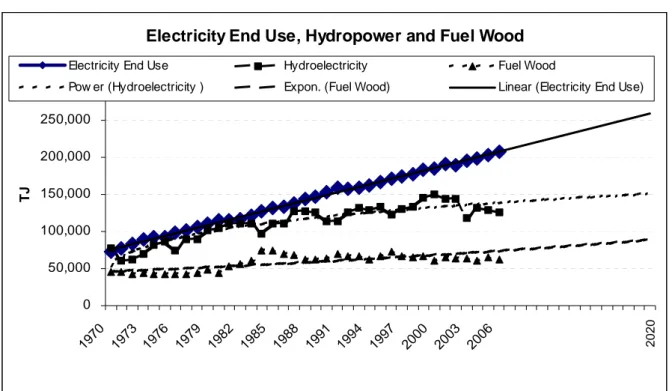
To earn some understanding for the future in figure 4 some energy trend lines are shown, indicating that if the linear growth in end use electricity continues, the electricity consumption would be reaching 260.000 PJ in 2020. Provided a stable water flow and assuming an upgrade of the old hydro turbines and an in- crease of their performance by 2020 (Ref. 2), the production of hydroelectricity stabilises at 150.000 PJ.
If only traditional technologies would be used, the fuel wood consumption for 2020 would stabilise at
around 90.000 PJ/year. In case of subsidised introduction of innovative technologies, e.g., combined heat
and power production, pellet ovens, combination of fuel wood and thermal isolation, etc., the energy pro-
duction from fuel wood may reach 135.000 PJ by 2020.
6
Figure 4: Electricity End Use, Hydropower Production and Fuel Wood use in Austria
Electricity End Use, Hydropower and Fuel Wood
0 50,000 100,000 150,000 200,000 250,000 300,000
1970 1973 1976 1979 1982 1985 1988 1991 1994 1997 2000 2003 2006
TJ
Electricity End Use Hydroelectricity Fuel Wood
Pow er (Hydroelectricity ) Expon. (Fuel Wood) Linear (Electricity End Use)
2020
Source: Statistik Austria (2007a).
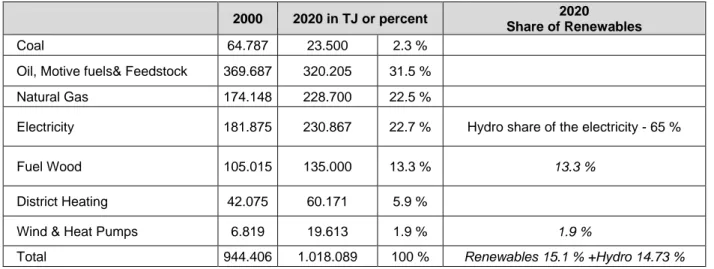
As seen from table 1, we assume a (strong) reduction of almost 40 PJ for the uses of coal and around 50 PJ for fuel oil and motive fuels until 2020. This reduction of 90 PJ of coal- and oil-based energy produc- tion is replaced to a 100 % by fuel wood as a source of energy. All together in 2020 the domestic energy production will be around 230.867 PJ whereas energy demand will be above that figure, so that the re- maining 30.000 PJ will have to be imported. In this study we do not explicitly model the generation of for- eign energy.
For the general case of the fuel-wood-for-energy scenario, we assume a crude oil price of US$ 150/bbl by the year 2020 - high enough to create comparative advantage to the domestically produced fuel wood, so that an increase from the historical trend of 90 TJ (Fig. 3) to the assumed 135 PJ would be economically attractive. To that end the fuelwood-for-energy scenario can also be called Price-Induced substitution of oil for Fuelwood Scenario – (PIFWS) as it is expected to take place without significant regulatory pushes but rather than through increased fuel oil prices helped by subsidised wood using technologies, e.g., pel- let stoves.
In this scenario the share of renewables in the total final energy consumption, e.g., fuelwood, solar, wind,
etc. by 2020 is expected to reach 15.1 % thus remaining slightly below that of the EU regulations. If we
add the 14.73 % of domestic hydropower, the share of renewables will be 29.8 %.
7
Table 1: Final energy Use (in TJ) for the Fuelwood-for-energy scenario (PIFWS)
2000 2020 in TJ or percent 2020
Share of Renewables
Coal 64.787 23.500 2.3 %
Oil, Motive fuels& Feedstock 369.687 320.205 31.5 %
Natural Gas 174.148 228.700 22.5 %
Electricity 181.875 230.867 22.7 % Hydro share of the electricity - 65 %
Fuel Wood 105.015 135.000 13.3 %
13.3 %District Heating 42.075 60.171 5.9 %
Wind & Heat Pumps 6.819 19.613 1.9 %
1.9 %Total 944.406 1.018.089 100 %
Renewables 15.1 % +Hydro 14.73 %Source: Statistik Austria (2007a); Own assumptions
3.4. Externalities
We are assuming that in 2020 CO
2certificates will be traded within the spread of their marginal abate- ment costs (MAC) estimated by the EU´s “Impact Assessment of the EU's objectives on climate change and renewable energy for 2020” (EC, 2008). This study estimates the MAC for Austria to lie between € 40 and € 90/t CO
2.
To explore the full effects of the CO
2trade for our scenarios we have chosen thee taxation levels -
namely, PIFWS0 or no taxation (€ 0/t CO
2), € 60/t CO
2(PIFWS60) and € 80/t CO
2(PIFWS80).
8
4. Macroeconomic, sectoral and environmental impacts of the fuelwood-for-energy scenario
All graphs below are compared to the GDP growth rate of in every scenario. This growth rate assumes an index value of 1 in each scenario. The only exception refers to the figures for GDP, which is compared with a GDP growth rate of 2 percent p.a., corresponding to an overall increase of 48.59 %. The three scenarios are the Fuel-wood-for-energy scenario without taxation, the Fuel-wood-for-energy scenario with medium taxation (60€/t CO
2) and the Fuel-wood-for-energy scenario with high taxation (80€/t CO
2).
4.1. Macroeconomic performance
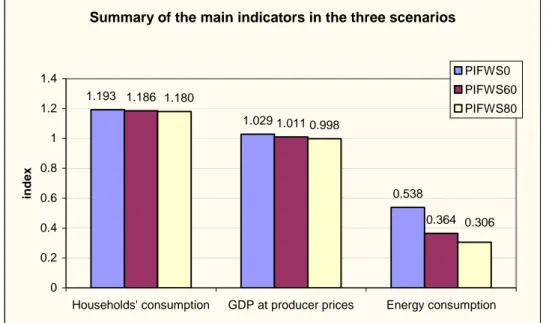
Figure 5 shows that enhancing the use of fuel wood, as well as taxing CO
2emissions at a higher rate will not alter the level of GDP and household consumption tremendously. Private consumption expenditures will grow at a faster rate than GDP (+18 and +19.3 percentage points) in the respective scenarios. If the usage of biomass is enhanced without taxation, Austrian GDP would grow 2.9 percentage points faster than in the benchmark case, in the medium taxation case, GDP growth would still be 1.1 percentage points higher (over the twenty years). In the high taxation case, Austrian GDP will be slightly but only marginally smaller.
Figure 5. Changes in households´ consumption, GDP at producers’ prices and of the energy consumption
Summary of the main indicators in the three scenarios
1.029
0.538 1.186
1.011
0.364 0.998
1.193
0.306 1.180
0 0.2 0.4 0.6 0.8 1 1.2 1.4
Households' consumption GDP at producer prices Energy consumption
index
PIFWS0 PIFWS60 PIFWS80
Source: ATCEM-E3 simulation results.
Energy consumption of the Austrian economy will grow at half the rate of GDP, indicating a deceleration
in energy consumption. Energy consumption is, however, strongly sensitive to the level of taxation. In the
high taxation scenario, the energy consumption growth rate of the Austrian economy is less than a third of
the corresponding overall economic growth rate. This can be interpreted as a tax-enforced increases in
energy efficiency per unit of GDP.
9 4.2. Sectoral growth
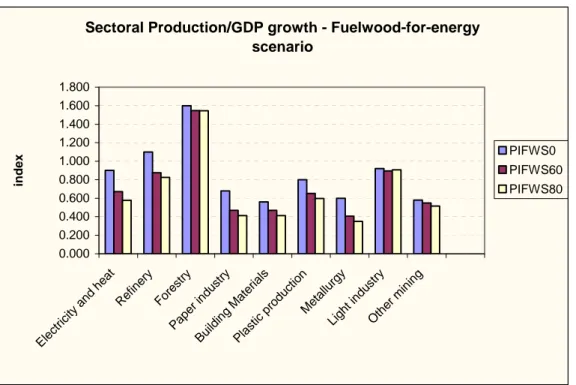
Figure 6 compares the growth rates of selected industries with that of GDP in the three scenarios. The clear winner in all scenarios would be the forestry sector with a growth rate of 50 percentage points above the growth of GDP. On the other hand we observe energy intensive sectors suffer, especially when CO
2taxation is additionally considered. We observe that an enhancement of fuel wood use, to generate en- ergy, will adversely affect contesting uses such as in the paper industry, where wood is a production in- put. A less adverse effect could be observed for the so-called light industries, which would not be se- verely affected, not even when accounting for increased taxation.
As wood is used more intensively for energy generation, this will have a positive impact on refinery, as the price for its input might be lowered due to less demand for its raw materials. This small bonus van- ishes, however, as soon as CO
2emissions are taxed.
Figure 6: Changes in the main production indicators
Sectoral Production/GDP growth - Fuelwood-for-energy scenario
0.000 0.200 0.400 0.600 0.800 1.000 1.200 1.400 1.600 1.800
Electr icity a
nd heat Refinery
Forestr y
Paper indu stry
Building Ma terial
s
Plasti c p
rod ucti
on Meta
llurgy Light i
ndustr y
Oth er mining
index
PIFWS0 PIFWS60 PIFWS80
Source: ATCEM-E3 simulation results.
4.3. Household’s expenses
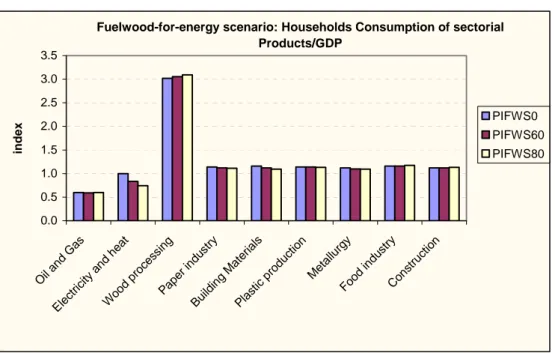
The growth in the household expenditure (Fig 7), with exceptions for oil & gas and electricity & heat, is
generally above GDP growth. Due to the enforced use of fuelwood, the corresponding expenses are
three to 4.5 times higher than the GDP growth rate.
10 Figure 7: Changes in the Households´ consumption
Fuelwood-for-energy scenario: Households Consumption of sectorial Products/GDP
0.0 0.5 1.0 1.5 2.0 2.5 3.0 3.5
Oil an d Gas
Electricit y and
heat
Wood proc
essing Paper indu
stry
Buildin g Materials
Plastic pro duc
tion Me
tallurgy Food indu
stry Cons
truc tion
index
PIFWS0 PIFWS60 PIFWS80
Source: ATCEM-E3 simulation results.
Households will reorient their expenses to wood products and reduce their spending for oil, gas products but also for electricity and conventional heat. The other expenses correlate to a high extent with GDP growth.
4.4. Energy
Energy demand for all sectors are highly sensitive to the level of CO
2taxation, but this is especially rele- vant to the energy intensive industries, i.e., Oil & Gas, Electricity & Heat, Refinery, Forestry, Pulp & Paper Industry, Engineering, Building Materials, Plastics production and Metallurgy, Other Mining and Construc- tion.
There are three aspects to sectoral energy demand. Firstly, the enforced economy-wide use of fuel-wood for energy generation reduces the availability and therefore increases the price of important inputs for certain industries, which can be seen in the case of paper industries, building materials and construction.
This should induce at first an increase in energy efficiency. Secondly, the taxation of CO
2emissions tre- mendously increases the pressure for further improvement in the energy efficiency of all industries, espe- cially in the case of energy intensive industries. Eventually, in analysing the effect of the three scenarios on energy demand figure 6 should be kept in mind, that certain industries, among them the energy inten- sive branches, will relocate their production facilities outside Austria, which further decreases the demand for energy.
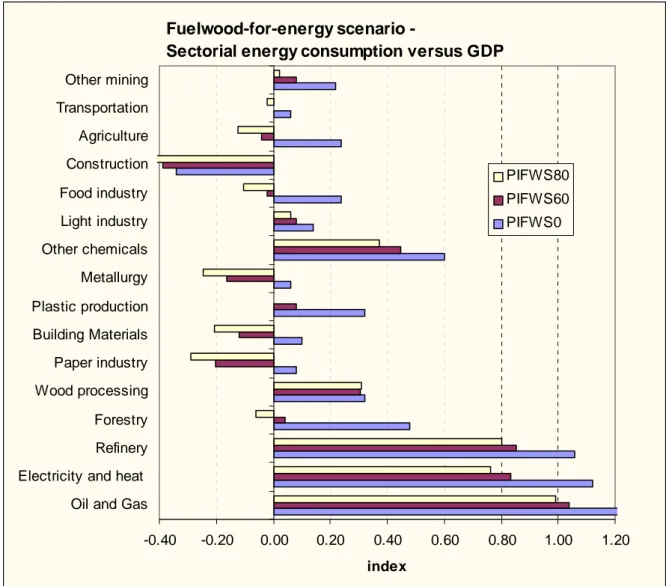
Figure 8 displays the extremely high sensitivity of the energy consumption of all sectors from CO
2taxation
levels where a reduction of 10 to 15 % in the PFIWS80 scenario relative to the PFIWS0 scenario for al-
most all industries can be observed.
11
Figure 8: Changes in the Sectorial Energy consumption
Fuelwood-for-energy scenario -
Sectorial energy consumption versus GDP
-0.40 -0.20 0.00 0.20 0.40 0.60 0.80 1.00 1.20
Oil and Gas Electricity and heat Refinery Forestry Wood processing Paper industry Building Materials Plastic production Metallurgy Other chemicals Light industry Food industry Construction Agriculture Transportation Other mining
index
PIFWS80 PIFWS60 PIFWS0
Source: ATCEM-E3 simulation results.
4.5. Environment
As a result of the reduced energy consumption growth, emissions increase much less than GDP, but with considerable variation across pollutants and between the household and production sphere (see Figure 9 for details). The higher CO
2tax rate causes significant decreases in CO
2emission in industries.
As most households can switch relatively easy to fuel wood products
2as their main source of energy, the emission levels of this sector will decline significantly even without taxation. As a result we observe only marginal decreases in emission levels across the three scenarios. Compared to the household sector, industries are much more sensitive to the level of CO
2taxation. For the case of zero taxation (PFIWS0) we observe a reduction of emission of 50 percent, but when a tax is introduced, the emission levels drop below that of the household sector. Again part of this has to be attributed to the relocation of production facilities outside Austria.
2