Research Collection
Journal Article
Biomass transport for energy: Cost, energy and CO2
performance of forest wood and manure transport chains in Switzerland
Author(s):
Schnorf, Vivienne; Trutnevyte, Evelina; Bowman, Gillianne; Burg, Vanessa Publication Date:
2021-04-15 Permanent Link:
https://doi.org/10.3929/ethz-b-000469139
Originally published in:
Journal of Cleaner Production 293, http://doi.org/10.1016/j.jclepro.2021.125971
Rights / License:
Creative Commons Attribution 4.0 International
This page was generated automatically upon download from the ETH Zurich Research Collection. For more information please consult the Terms of use.
ETH Library
Biomass transport for energy: Cost, energy and CO 2 performance of forest wood and manure transport chains in Switzerland
Vivienne Schnorf
a,b,*, Evelina Trutnevyte
b, Gillianne Bowman
a, Vanessa Burg
a,caSwiss Federal Research Institute for Forest, Snow and Landscape Research WSL, Research Group Sustainable Forestry, Zürcherstrasse 111, CH-8903, Birmensdorf, Switzerland
bUniversity of Geneva, Renewable Energy Systems, Institute for Environmental Sciences (ISE), Section of Earth and Environmental Sciences, Boulevard Carl- Vogt 66, CH-1211, Geneva, Switzerland
cSwiss Federal Institute of Technology Zürich (ETH Zurich), Institute of Environmental Engineering, John-von-Neumann-Weg 9, CH-8093, Zürich, Switzerland
a r t i c l e i n f o
Article history:
Received 25 August 2020 Received in revised form 26 November 2020 Accepted 11 January 2021 Available online 23 January 2021 Handling editorYutao Wang
Keywords:
Biomass Transport Bioenergy Costs Energy input CO2emissions
a b s t r a c t
Biomass transport represents a significant share of thefinal price of biomass for energy, and transport itself requires fuel, whose combustion adds to greenhouse gas emissions. We conducted a techno- economic analysis of biomass transport for the main forest wood products in Switzerland (firewood and woodchips), as well as for solid and liquid manure. First, we identified the most common transport chains from the supplier to thefinal consumer in Switzerland, by conducting expert interviews that followed a mental models approach. Then, we quantified the cost, energy and environmental perfor- mance of 12 identified transport chains for these types of biomass, using performance ratios. The results show that transport of forest wood is more performant than transport of manure, except when under- ground pipes are used for liquid manure. In the case of Switzerland, the main barrier to biomass transport is cost rather than energy or emissions performance. Energy required to deliver biomass to final consumers represents between 0.4% and 1.8% of the primary energy contained in the forest wood, and less than 5% in the case of manure. Some forest wood chains attain the maximum break-even transport distances after 36 km only, whereas others could reach over 400 km. Using agricultural transport for slurry should not exceed 3 km from the viewpoint of cost, but could be extended to over 145 km in the case of energy or CO2emissions.
©2021 The Author(s). Published by Elsevier Ltd. This is an open access article under the CC BY license (http://creativecommons.org/licenses/by/4.0/).
1. Introduction
Due to their impact on climate change, greenhouse gas (GHG) emissions need to be cut by transforming the global energy system (Rogelj et al., 2018). In 2009, to comply with the United National Framework Convention on Climate Change (UNFCCC) and the Kyoto protocol, the European Union has started its energy transition and, in 2018, it adopted the most ambitious goal so far of carbon neutrality by 2050, including GHG emissions resulting from land- use change (European Commission, 2018; Loonela et al., 2020).
When used sustainably, energy from biomass is carbon neutral and can provide a storable energy solution to phase out fossil fuels
(Hiloidhari et al., 2019;Sulaiman et al., 2020). By the end of 2017, modern biomass (excluding traditional use, such as charcoal for cooking) represented close to half of all renewable energy and 5% of totalfinal energy consumption globally (REN21, 2019). With many possible applications, the International Renewable Energy Agency shows that biomass could provide two thirds of the heat and fuel supply by 2050 (IRENA, 2018). The possibility of using biomass for electricity generation, heat and transport led biomass to be considered an important resource for the Swiss energy transition.
With the so-called Energy Strategy 2050 (SFOE, 2018), Switzerland established a framework to increase the use of renewable energy to replace soon to be retired nuclear power and, being a federation, delegated the details of its implementation to the cantons (i.e.
Swiss states). In 2019, like the European Union, Switzerland also set the goal of carbon neutrality by 2050 (The Federal Council, 2019), making it even more pertinent to develop renewable energy, including biomass.
*Corresponding author. Swiss Federal Research Institute for Forest, Snow and Landscape Research WSL, Research Group Sustainable Forestry, Zürcherstrasse 111, CH-8903, Birmensdorf, Switzerland.
E-mail addresses:vivienne.schnorf@wsl.ch,schnorf.v@gmail.com(V. Schnorf).
Contents lists available atScienceDirect
Journal of Cleaner Production
j o u rn a l h o m e p a g e : w w w . e l s e v i e r . c o m / l o c a t e / j c l e p r o
https://doi.org/10.1016/j.jclepro.2021.125971
0959-6526/©2021 The Author(s). Published by Elsevier Ltd. This is an open access article under the CC BY license (http://creativecommons.org/licenses/by/4.0/).
With an additional 44 PJ that could be sustainably exploited in Switzerland per year, the contribution of biomass resources could be doubled by 2050 as compared to 2020, herewith representing 4%
of the country’s gross energy consumption (Burg et al., 2018a).
Currently representing only 0.2% of the gross energy consumption, manure shows the most significant additional available potential of Swiss biomass (Burg et al., 2019), since only 6% of its sustainable potential (27 PJ per year) is currently being exploited. In Swiss agricultural facilities, animal manure is mainly treated with maximal 20% co-substrates (e.g. catering waste, vegetable and fruit residues) in agricultural anaerobic digestion plants, while industrial anaerobic digestion plants process most remaining organic waste (Schleiss, 2019). Further treatment alternatives, such as direct combustion or pyrolysis of manure (Lazaroui et al., 2020) are not yet developed. Manure is generated in a decentralized manner, which is a challenge for its collection and transport. Nonetheless, the agricultural know-how is already present and biogas develop- ment could create job opportunities (Kis et al., 2018;Mohr et al., 2019). In addition to energy generation, methane (CH4) and nitrous oxide (N2O) emissions occurring during decomposition are currently representing 19% of the total GHG emission from the agricultural sector in Switzerland and could be significantly reduced by the process of anaerobic fermentation (Burg et al., 2018b). The use of forest wood offers the second-largest addi- tional sustainable energy potential in Switzerland (Burg et al., 2019), where firewood and woodchips are the most common types of feedstock. When considering a moderate stock reduction and assuming common silvicultural management strategies, forest wood surpluses could provide additional 9 PJ per year (Thees et al., 2020). When using forest wood for energy, a potential added value is created because forest wood is usually harvested for material purposes and its energetic use can be considered as a valuable by- product. The large availability and suitable properties offirewood and woodchips led to a rising number of woodchips-based heating and large wood-based Combined Heat and Power (CHP) plants, but at the expense of firewood-based heating (Stettler and Betbeze, 2019). Growing energy crops or energy wood is not practiced in Switzerland.
When envisioning to fully use the remaining potential of forest wood and manure for energy, one frequently addressed question concerns the uncertain impact of transporting biomass. The com- plex logistics associated with the transport of forest wood and manure induce economic (Bergstr€om and Fulvio, 2014;Gold and Seuring, 2011; Mele et al., 2011), energetic (Berglund and B€orjesson, 2006;Capponi et al., 2012;Mele et al., 2011) and envi- ronmental implications that can represent a barrier to the devel- opment of the biomass sector (Chum et al., 2011;De Meyer et al., 2014;Mele et al., 2011). Characteristics inherent to biomass, such as its variable bulk density and calorific value, result in different
needs for transport space per unit of energy and have a direct negative impact on the processing efficiency of the energy source logistics chain (Allen et al., 1998;Rentizelas et al., 2009;Wolfsmayr and Rauch, 2014). Transport planning optimization is a key issue in the upstream logistics chain (Bravo et al., 2012;Rentizelas et al., 2009). It begins with the loading of the feedstock on the vehicle and ends with the unloading at the storage or consumer’s location (Rentizelas and Tatsiopoulos, 2010). Empty runs represent a further important step of the process (Wolfsmayr and Rauch, 2014), as well as the return of fermented digestate tofields in the case of manure.
Distances, directly affecting travel time, are a major factor in costs, energy input for transport, and CO2emissions (Gold and Seuring, 2011). The chosen transport mode is another contributor to the performance, as it determines the hauled capacity, and therefore the energy content and potential income per load (Hamelinck et al., 2005;Laitila et al., 2016). The importance of all these factors causes the potential transport chains to be numerous and hard to docu- ment, frequently leading to data unavailability. Even though transport is expected to significantly affect the economic, energetic and environmental performance of biomass (Gautschi et al., 2017;
Hamelinck et al., 2005;Laitila et al., 2016), the specific transport chains of forest wood and manure in Switzerland have not yet been analysed. If a biogas plant is considered as“agricultural”and re- ceives governmental subventions in Switzerland, the maximum transport distance between the feedstock production and energy conversion site must not exceed 15 km (Foen and Foag, 2016). It is, however, uncertain whether this maximum distance is in line with the praxis and similar guidelines do not exist for forest wood.
Estimating the maximum transport distances with each mode of transport before becoming economically unviable and energetically questionable would reveal absolute limits and encourage best practice. Maximum distances have been investigated in other countries (Gonzales et al., 2013; Hamelinck et al., 2005; P€oschl et al., 2010), but break-even distances have never been calculated and compared with regard to costs, energy input and CO2emissions simultaneously. Finally, we shed light on the regional disparities of transport performance, allowing to put the analysed feedstock within the geographic and administrative boundaries of its current use.
The overall aim of our study is to provide a novel mixed- methods approach to quantify the cost, energy and GHG emis- sions performance of the key biomass transport chains in Switzerland, focusing on forest wood and manure. This information would not only help to plan the sustainable biomass use in Switzerland and elsewhere, but it would also provide the missing piece in studies on integrating biomass in the whole energy system (Rentizelas et al., 2019;Sasse and Trutnevyte, 2019). More specif- ically, this study pilots a new methodology and applies it with four objectives:
Abbreviations
AD Anaerobic digestion bcm Bulk cubic meter
C Chips
CHP Combined heat and power
DM Dry matter
F Farmer
FW Firewood
GHG Greenhouse gases LM Liquid manure
MCF Methane conversion factor
oDM Organic dry matter
P Professional
RC Economic performance (cost) indicator RCO2 Environmental performance (CO2) indicator RE Energy performance indicator
SM Solid manure
SSWB Small-scale wood buyer
Stere One cubic meter of piledfirewood, equivalent to approximately 0.71 solid m3of wood
tDM Tonne of feedstock dry matter tFM Tonne of feedstock fresh matter WSS Winter safe storage
1) To identify the most important transport chains of forest wood and manure for energy in terms of frequency and amount of resources transported in Switzerland, given the lack of existing data;
2) To calculate the cost, energy inputs and CO2 emissions from forest wood and manure transport for energy;
3) To determine threshold transport distances for the analysed feedstocks with regard to costs, energy, and CO2 emissions performance;
4) To upscale these results at the national level and show the regional performance disparities of the Swiss cantons regarding the transport of forest wood and manure.
2. Material and methods
The methodology applied includes four steps (Fig. 1). First, we used a mental models approach to conduct interviews with experts in order to document the major transport chains of forest wood and animal manure in Switzerland, together with their key character- istics and frequencies (Section 2.1). Second, we quantified these major transport chains in terms of costs and energy use, and this information was then used to quantify the direct CO2emissions. We used these results to estimate the threshold transport distances of the analysed feedstock (Section2.2). Finally, the results were scaled up to Switzerland as a whole, including a regional disaggregation that allows to approximate the current situation in each Swiss canton (Section2.3).
2.1. Mental models interviews
In order to understand the most important transport chains for forest wood and manure we used the mental models approach.
Mental models illustrate the way people perceive external reality by using various associations to deduce conclusions (Morgan et al., 2002). These types of interviews are useful when structured data on a topic is scarce and when the overall understanding of the system may differ with various perspectives of interviewees, as it is the case for biomass transport chains (Jones et al., 2011). The in- terviews further aim at grasping the interviewee’s perception of systems without imposing the interviewer’s beliefs and capture the plurality of their views (Elsawah et al., 2015; Jones et al., 2011;
Morgan et al., 2002). Until now, the mental models approach has been mostly applied for interviewing lay people (Volken et al., 2019; Wong-Parodi et al., 2016), but it particularly suits the
purpose of our interviews of Swiss biomass experts because of their diversity: from farmers to staff in public institutions. Preliminary discussions with sector’s key experts were conducted to determine the interview candidates for the forest wood and manure sectors.
The candidates were chosen according to their expertise and role in the sector. Moreover, they are active in different cantons in the whole of Switzerland. The candidates were contacted per e-mail and all respondents were men. We selected a panel of seven can- didates on the topic of forest wood, composed of different types of exploitations (private and public) as well as institutions. We pro- ceeded similarly for animal manure, where four experts were chosen, including private transport enterprises, institutions and researchers. The interviews took place during the summer of 2019 and were audio-recorded for analysis.
An interview protocol was prepared and pre-tested for each feedstock type (supplementary material Section A). The 1-h in- terviews were semi-structured and composed of two main parts.
Thefirst part consisted of a set of open questions aiming to un- derstand the factors influencing transport decisions. The answers were transcribed in influence diagrams, serving as visual repre- sentations of each expert’s mental model. In the second part, the interviewees were asked to sketch the most important transport chains. This direct elicitation obliged the interviewees to focus on some details that could easily be omitted if the information on the chains was elicited solely orally and this provided immediate means of verification. Thefirst parts of the interviews were tran- scribed and the summarized versions of the sketches were digita- lized. The experts’answers were compared and transport chains that were mentioned at least twice or were of primary importance for at least one of the interviewees were kept for the rest of the analysis. The experts’answers included information on the types of vehicles, the haulage capacity, thefinal delivery products and vol- umes, the expected travel distances on trips and empty runs, the service provider and the estimated frequency of occurrence.
2.2. Data description and economic, energy and environmental analysis
The elicited factors that directly influence costs, energy inputs and CO2 emissions, confirmed the findings from the previous literature: feedstock type and consequently its mass, transport mode and volume, and distance (Laitila et al., 2016;Rentizelas et al., 2009;Searcy et al., 2007). These factors were then used for the calculations. The analysis included all empty runs and, in the case of manure, the additional transport of digestate to the field,
Fig. 1.Method and objectives of the study.
considering mass reduction (supplementary material Section C).
The analysis was performed on the initial full load truck or until the initial transported dry matter (DM) is distributed. This is particu- larly important for manure, as the DM content of inflows into biogas plants differs from the DM content of digestate outflows.
Costs were determined by the time necessary for each step of the transport process. Based on the data from literature (Kuptz et al., 2015; Lemm et al., 2018; Meier et al., 2017), the input data regarding transport time to deliver the biomass from the stand to the terminal were confirmed byfield trips (Table 1). Machinery costs are taken from governmental publication (EAER, 2018) and include the machine’s hourlyfixed (investment cost, depreciation, interests and taxes) and variable (fuel and auxiliary materials) costs. Performed yearly, this publication considers individual operation hours, an interest rate of 1.5%, and reflects the values used in the sector in 2018 (Table 2). All values used for the costs of agricultural machineries and trucks, as well as for salaries were confirmed by sectorial experts.
Total distances were estimated by the interviewed experts, whereby the mentioned minimal and maximal values were used. In addition, a record of manure exchange flows between farms or third parties, initially collected to regulate the nutrient flows (FOAG, 2018), allowed to complement information from the in- terviews. We performed an origin-destination-cost matrix using the Network Analyst extension on ArcGIS 10.6 to calculate the distances between manure suppliers and receivers, along the roads accessible to trucks and tractors (supplementary material Section B.5). We differentiated forest, urban and national roads. The dis- tances on forest roads and urban roads were assumed to be 3 km or 50% maximum of the trip with the remaining distance being trav- elled on national roads. Driving time, which impacts costs, and fuel consumption, which determines the energy inputs and CO2emis- sions, were estimated according to the road types, driving velocities and distances (Table 2). Hence, CO2 emissions from transports, derived directly from the vehicle fuel consumption, reflect only the direct emissions while using the machines. According to the na- tional vehiclefleet, all heavy freight vehicles use diesel, and most passenger cars run on petrol (FSO, 2019). Furthermore, the fuel consumption during the loading and unloading processes was assumed to be 75% of the optimal fuel consumption while driving for trucks and 100% for tractors. To complement the environmental analysis of agricultural feedstock, we further considered the addi- tional benefits of anaerobic manure digestion by taking into ac- count the avoided emissions from traditional manure management
(MM) practices. The CH4 and N2O emitted while storing manure during 30 days, which is the common practice when the feedstock is not brought to a biogas plant, is replaced by a reduced storage duration of 12 days (IPCC, 2019).
To determine the efficiency of the transport, we used the following performance indicators:
Economic indicator:The ratio of the income provided by the biomass resource to the cost inherent to the transport that was used for the economic analysis. This indicator depicts the cost- efficiency of the transport process. Most earlier literature has compared the cost of transport to the final cost of production (Gonzales et al., 2013). Considering today’s income from sales of biomass allows to estimate the economic profitability of the pro- cess when other production costs are unknown. The economic in- dicator was calculated as follows:
RC¼ Ib
ClðtÞþCuðtÞþCpðtÞþCtðtÞ; (1)
in whichRCis the economic performance indicator; Ibis the income from the transported biomass in Swiss francs (CHF) per tonne of DM (tDM);Cl,ethe costs of loading the feedstock (CHF/tDM);Cu,e the costs of unloading it (CHF/tDM); Cp,e the preparation costs (CHF/tDM);Ct,ethe driving costs (CHF/tDM).
Energy indicator: We used the ratio of the primary energy content of the resource to the direct energy used for transport as an indicator for the energy analysis, defined as follows:
RE¼ PE
ElþEuþEpþEt; (2)
in which the energy performance indicatorREis obtained with the primary energy (PE) of biomass (in MJ/tDM);El, represents the en- ergy used by machinery and vehicles to load the feedstock (MJ/
tDM);Eu,ethe energy required for unloading it;Epethe energy used during preparation time (MJ/tDM), representing the time necessary for the woodchips transporter to be in the right position next to the chipper;Etethe energy of fuel consumption to drive the feedstock tofinal consumers (MJ/tDM).
Environmental indicator:We compared the CO2emissions of a reference case, in which the potentialfinal bioenergy produced would be provided by traditional (fossil) energy sources to the emissions of the case of energetic use of biomass resources (Capponi et al., 2012). We assumed that the generated heat would
Table 1
Vehicle load volume, preparation, loading and unloading times. The two values represent two loading processes for indirect transport chains (H€oldrich et al., 2006;Kuptz et al., 2015;Lemm et al., 2018).
Chain type Name of transport chain Volume (m3)b Preparation/waiting time (min) Loading (min) Unloading (min)
Firewood FW-PH 9-15/2.13 e 10.8a/1.5 10.8/12.8
FW-PL 14.2/2.13 e 17.0/1.5 17.0/1.3
FW-F 2.13 e 38.3 38.3
FW-SSWB 2.13 e 38.3 38.3
Woodchips C-F 8.9 4 15.8c 5
C-PL 14.2 9 18.8c 9
C-PH 22e32 15 31.8c,d 24.1
Liquid manure LMeF 10 e 5.3 5.3
LMeP 27 e 11 11
LMeI NA e e e
Solid manure SMeF 25 e 22.8 5
SMeP 22 e 5 5
aValue for broadleaves wood. The permissible payloads and bulk volumes of trucks can reduce the transported volume of the different wood types.
bFor wood, the volumes are expressed in cubic meter of wood. The actual volume of the woodchips trailer is 25 m3, 40 m3for the woodchips container truck and 90 m3for the semi-trailer.
c We assumed the professionals to use a Jenz Hem chipper (max. output of 155 bcm/h) and farmers to use the Musmax Wood terminator (max. output of 115 bcm/h).
dValue for broadleaves wood.
substitute an average fossil fuel-based district heating and that generated electricity would reduce the need for non-renewable power imports (Table 3). In the reference case of manure, the feedstock was assumed not to be brought to a biogas plant, resulting in additional CH4 emissions from MM. However, the considerable CH4losses occurring during the anaerobic digestion of manure (2%) and digestate storage (3%) were taken into consider- ation (FOEN, 2019). The CO2ratio was calculated as follows:
RCO2¼ AGelþAGthþ AGmm
GlþGuþGpþGtþ GmmþGsþGf; (3)
where RCO2 is the CO2 performance ratio; AGel are the avoided emissions from imported electricity in kg eq-CO2/tDM;AGth, rep- resents the avoided emissions from the fossil fuel share of the Swiss district heating (eq-kg CO2/tDM.);Gl, Gu, GpandGtare the emissions generated from loading, unloading, preparing and transporting the feedstock (kg CO2/tDM). Concerning only the manure part,AGmmare the emissions (CH4and N2O) from traditional MM practices (kg eq- CO2/tDM.); Gmm are emissions from MM when the feedstock is brought to a biogas plant (which are lower than AGmmdue to e.g.
shorter storage time (IPCC, 2019)) (kg eq-CO2/tDM.);Gfare the losses from the renewable energy source conversion (kg eq-CO2/tDM.);Gs
the emissions from digestate storage (kg eq-CO2/tDM.).
Input values for the income, energy content and emissions are shown inTable 3. When analysing forest wood, we differentiated between broadleaves (beech, maple, or ash) and coniferous wood (spruce, larch, orfir), that are the most representative species of Swiss landscapes. They differ in mass, affecting the carried volume and energy content. Woodchips are brought to plants without drying process, and therefore have a water content of 50%, while firewood was assumed to be collected having a water content of 35%. Primary andfinal energy content of manures was estimated on the provided manure exchange dataset, whereby different types and categories of feedstock, their respective DM and organic dry matter (oDM) were considered (supplementary material Table B1).
Thefinal energy output was estimated using CH4yield values from the literature (KTBL, 2013), as they consider the CH4 reduction occurring directly after excretion (Burg et al., 2018b) as well as the biogas plant’s efficiency. CH4 and N2O emissions from MM were estimated using the methods described in the 2006 IPCC Guidelines (IPCC, 2019). We considered the suggested maximum CH4
producing capacity as well as system-specific CH4conversion fac- tors (MCFs) for the cool climate of Switzerland and N2O emissions factors (supplementary material Table B1). The conversion Table 2
Costs and salaries, vehicle’s permissible load, driving velocity and fuel consumption.
Used in Permissible load [t] Costsa,b[CHF/h] Driving velocityc[km/h] Fuel consumptionc[l/km]
Salaries
Enterprise FW-PH, FW-PL, e 75.00 e e
Agriculture FW-F, LM-F, SM-F e 30.00 e e
SSWBe FW-SSWB 0.00
Machinery e e
Roundwood Truck FW-PH, C-WSS 12 168.54/134.83 15/35/75 0.52/0.35/0.30
Container Truck 26t C-PL, SM-P 22 173/138.40 15/35/75 0.52/0.35/0.30
Semi-trailer Truck 40t C-PH, LM-P 27 181.67/145.33 15/35/75 0.61/0.40/0.35
Tractor (90e104 kV) FW-PL, FW-F, C-F, LM-F, SM-F e 55.00 15/25/35 1.20/0.48/0.24
Trailer FW-PL, FW-F, C-F, SM-F 20 50.00 e e
Slurry tank LM-F 10 56.00 e e
Front loader FW-PH, FW-PL, SM-F e 12.50 e e
Piston pump LM-I 45 m3/h 13.25 e 20 kV
Piped LM-I e 0.47 CHF/m3 e e
Car (petrol) [CHF/km] FW-PH, FW-SSWB e 1.05 35/45/75 0.07/0.06/0.05
aCosts of trucks are retrieved from professional’s price list and include the driver’s cost (10% profit margin).
bCosts while driving and loading/unloading. The charges are higher when driving because of the heavy vehicle tax applying per km.
c Driving velocity and fuel consumption on forest, urban and national roads. The hourly fuel consumption was derived from optimal consumption rate (KFZ-Anzeiger, 2010;
PTV Planung Transport Verkehr AG, 2009;Rexeis and Hausberger, 2011).
dThe cost of piston pipes was calculated using a cost of 25 CHF/m for the pipe and 25 CHF/m for digging the trench. Information obtained by a Swiss slurry pipe construction firm and confirmed by a biogas plant manager.
Table 3
Input values for calculations: income, plant efficiencies, energy content, fuels and avoided emissions. The income offirewood is per stere, which corresponds to 0.71 solid cubic meter (m3). The income from woodchips and manure are per kWh of energy produced, and therefore depend on the energy content and the efficiency of the plant.
Value Unit
Income
Firewood, 0.33 m (stere)a 143/167 CHF
Firewood price, 1 m (stere)a 50/66 CHF
Woodchips per kWh of energy produceda 0.054 CHF/kWh
Biogas electricity to gridb 0.410 CHF/kWh
Biogas plant heatc 0.054 CHF/kWh
Plant efficiency
Efficiency offirewood (hw)d 63 %
Efficiency of woodchips (hw)d 87 %
Electrical efficiency of biogas plant (hel)e 39 % Thermal efficiency of biogas plant (hth)e 17 %
Energy content Unit
Mass of coniferous woodf 0.379 t/m3
Energy density of coniferous woodf 5200 kWh/t
Mass of broadleaf woodf 0.558 t/m3
Energy density of broadleaf woodf 5000 kWh/t
Diesel energy content 10 kWh/L
Petrol energy content 9.2 kWh/L
CO2emissions from fuelsg
Petrol 2320 g CO2/L
Diesel 2620 g CO2/L
Avoided emissions from energyh
Fossil share of Swiss district heating mix 208.1 g eq-CO2/kWh
Imported electricity 345.0 g eq-CO2/kWh
aPrice of one stere of coniferous and broadleavesfirewood and per kWh of energy produced for woodchips (WaldSchweiz, 2017).
b We assumed the heat sold by biogas plants to be at the same price as the income provided by woodchips.
c Corresponds to the feed-in tariffs payed-out to biogas plants in 2017 (SFOE, 2017).
d With an electrical efficiency of 7% for chips (Stettler and Betbeze, 2019).
eValues are measured by the association of agricultural biogas plants (Bolli and Anspach, 2015).
f (Hahn et al., 2014).
g CO2emitted when burning 1 L of fuel.
h(Alig et al., 2017;Messmer and Frischknecht, 2016).
efficiencies of the plants reflect current efficiencies in the Swiss market (Bolli and Anspach, 2015;Stettler and Betbeze, 2019).
The above-mentioned indicators further permitted to estimate the maximum transport distance of the different feedstocks without consideration of the remaining production costs, energy input or emissions. These values give an indication of how far a transporter could go before the haulage becomes unprofitable, and more generally, before the transport inputs exceed the potential advantages of using the biomass resource. Calculating with increasing distances allows comparing the different transport chains on equal basis. The break-even point is reached when the value of the specific ratiosRC,REand RCO2is below one.
2.3. National upscaling
To upscale the results of forest wood on the cantonal level of Switzerland, we used the forestry statistics, recording quantities of firewood and woodchips harvested (in m3), combined with a GIS analysis (ArcGIS 10.6) using maps of the forest mix (FSO, 2013) and digital height models. We estimated both the share of each wood type and the amount of wood necessitating intermediate winter safe storage (WSS) (supplementary material Section C). The esti- mated frequencies of occurrence of each transport chain were averaged and rescaled to 100% by category (firewood and chips).
Costs, energy inputs, and CO2emissions were calculated according to this assumed frequency for each chain, once with the shortest distance mentioned by experts and also with the longest to provide a performance range. The wood harvest quantities provided the potential income, primary energy and avoided CO2 emissions (throughfinal energy conversion) to obtain the ratios.
In the case of manure, the influence diagram led to the defini- tion of criteria that allowed to identify the transport used for each entry of the manure exchange dataset. All experts agreed that agricultural transport does not exceed 10 km. As the load volumes of agricultural trailers and professional truck containers were similar, agricultural solid manure transport was, therefore, defined by road distances below 10 km, the remaining solids being attrib- uted to professionals (SM-P). Information on existing underground pipes was gathered directly from the biogas plants. Plants pos- sessing such infrastructure were identified and used when the distance (direct line) was below 5 km. We defined agricultural slurry transport by distance below 10 km and load volumes up to 25 m3and attributed all remaining liquid transport to professional tank trailers. We calculated the costs, energy inputs and CO2 emissions of transport per tonne DM on the inflow and outflow (digestate) dataset. All values from inflows and outflows (digestate) were summarized per biogas plant leading to the RC, RE, and RCO2 ratios of the cantons.
3. Results
3.1. Major biomass chains in Switzerland, elicited in mental models interviews
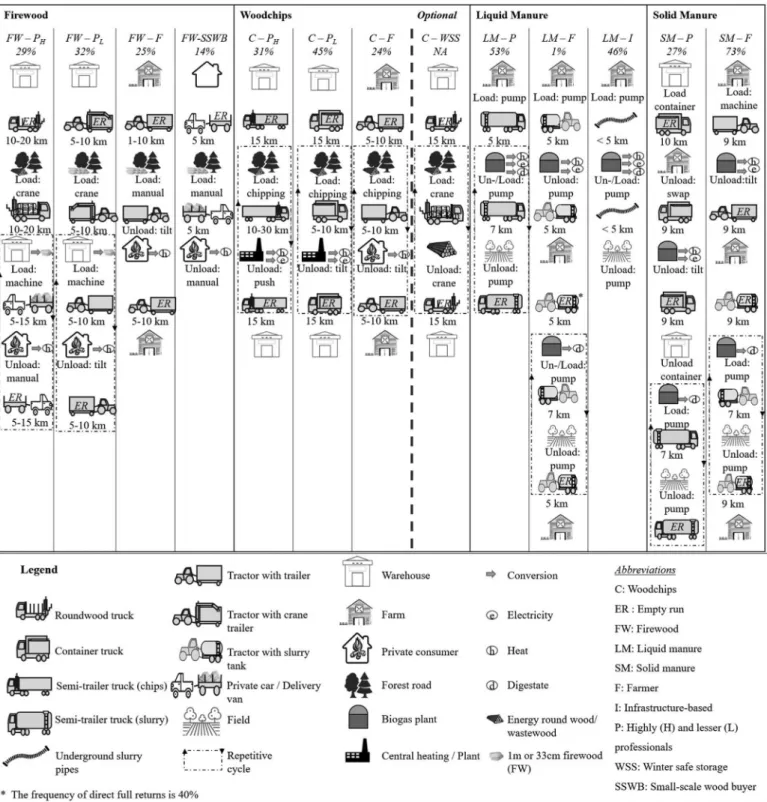
A total of 12 representative transport chains were identified from the expert interviews, of which seven refer to forest wood and five to manure (Fig. 2). If not specified differently, the delivered volume is determined by the vehicle load volume (Table 2) and permissible payload (Table 3). The percentages depicted inFig. 2 represent the frequency of occurrence of the feedstock type transport chain.
3.1.1. Forest wood transport chains
The elicited transport chains differentiate between firewood and woodchips. The final delivery volume for the three first
firewood chain is 3 steres per year (coinciding with the average firewood consumption per installation (Stettler and Betbeze, 2019)), and 1 stere for the small-scale wood buyer (FW-SSWB).
The water content is of 35%. In thefirewood chains that was most frequently described (FW-PH), the roundwood isfirst brought to the enterprise’s warehouse in large quantities for further trans- formation into 0.33 m logs and delivery to thefinal customer. The secondfirewood chain (FW-PL) differs from the previous one, in that the chosen transport mode is the tractor, and the feedstock is prepared in 1 m bundles at the forest road, maintaining thefirst load volume to constant 20 steres (14.2 m3). In the agricultural chain (FW-F), the wood is processed in 0.33 m logs and loaded manually in the trailer directly at the forest road before delivery to the end-consumer by a tractor. Finally, individuals can prepare wood logs themselves manually and transport their wood with private cars and trailers.
The threefirst woodchips chains (C-F, C-PL, C-PH) describe the delivery of fresh chips (50% water content) to customers at different transport distances and using distinctive vehicles. Due to their large volume, the permissible load weight of trucks is rarely attained with 40 m3 containers, leading professionals to invest in semi- trailer trucks. The haulage trucks drive empty to the forest loca- tion, get prepared next to the chipper for loading and drive back and forth from the forest location to the customer in a repetitive cycle. The container truck and the tractor unload their carriage by tilting the container, while the semi-trailers use a walkingfloor that pushes the chips in the end-location bunker. The last woodchips chain (C-WSS) is additional to the one mentioned above as it takes place in mountainous areas to secure sufficient provision during the winter when demand is highest and timber is hardly accessible.
It consists of transporting the energy roundwood to an accessible storage location, from where the three other chains take place.
According to the interviewees, 10% of the future woodchips below 600 m altitude in Switzerland should be carried to such storage places to provide sufficient supply, 25% between 600 and 800 m, and 50% above 800 m altitude.
3.1.2. Animal manure transport chains
Animal manure can be both liquid (LM) or solid (SM) and, therefore, its transport requires different types of trailers. Farmers (LM-F) bring slurry to biogas plants with tractor and tank trailers and return with empty vehicles 60% of the time, meaning that a second empty run is required before bringing digestate tofields (Hersener and Briner, 2019). This high share of empty returns is due to several reasons:first,field fertilization mainly occurs in spring and summer and rarely coincides with the highest manure pro- duction taking place in winter as animals spend more time out- doors during summer. Second, a significant motivator to deliver manure to biogas plants is the lack of storage space. Professional slurry transport (LM-P) is the most direct chain, as it avoids all empty runs by optimizing the route and have a load capacity of 27 m3. Finally, where the infrastructure allows it, slurry can be pumped directly to the fermenter of the plant by means of un- derground pipelines and piston pumps (LM-I). The length of these pipes is approximately usually1.5e4.5 km, with the longest being 8.5 km.
The digestate outflow service provider coincides with the manure provider, hence, SM carried to the plant by professionals will return tofield with the professional liquid means of transport.
Agricultural SM transport (SM-F) is done with tractors and trailers and always include an empty run, as convertible trailers for liquid digestate transport are not common. Consequently, an additional empty run between the farm and biogas plant is needed before bringing the slurry to thefields with the 10 m3tank trailers. To transport SM, professionals (SM-P) commonly use a container truck
(22 m3), which they exchange with a full container of manure before bringing and unloading it to the plant. The OD cost matrix analysis undertaken on the farms and plants of the dataset revealed that slurry is on average carried for distances of 5.2 km, SM for 9.3 km, and digestate for 7 km.
3.2. Economic evaluation and maximum transport distance
Overall, the costs of the different transport chains vary widely for the 12 analysed chains. Costs range from 24 CHF/tDMfor slurry transport by underground pipe (LM-I) to a maximum of 340 CHF/
Fig. 2.Forest wood and manure transport chains and expected distances, resulting from the mental models interviews. The percentage below the chain name is the expected frequency, estimated for forest wood and calculated on the dataset for manure. C-WSS represents an optional process taking place in mountainous regions in addition to one of the remaining woodchips transport chains.
tDMfor coniferousfirewood transported by farmers (FW-F) (Fig. 3).
Professional service providers perform better than agricultural ones, because the latter have lower volumes transported, more frequent empty runs, and lower velocities of tractors as compared to trucks. The share of loading and unloading in thefinal cost of transporting the resource is significant, as it represents between 14% and 56% for wood, and up to 65% in the case of manure.
Unsurprisingly, distances have a significant impact on thefinal transport costs. The distance range estimated by the experts for
forest wood chains leads to an increase of cost of 20e70% of the final transport cost. With costs ranging between 27 and 232 CHF/
tDM,firewood transport (broadleaves) is on average costlier than woodchips transport (23e39 CHF/tDM), even in the case of small- scale wood buyers (FW-SSWB), who would be expected to be more performant due to lower mechanization and employment cost. This highlights the importance of the delivered volume, as the low costs of FW-SSWB are cancelled out by the fact that only 1 stere is carried out at the time. Similarly, agriculturalfirewood chains Fig. 3.Costs in CHF/tDM, energy input in MJ/tDMand CO2emissions in kg eq-CO2/tDMof the different chains. Forest wood chains were calculated for broadleaves wood.
(FW-F) is more direct, but delivering 3 steres at once neutralizes the impact of the reduced number of trips. For both firewood and woodchips, loading and unloading represents on average between 22% and 32% of thefinal transport cost for long and short distances, respectively. Overall, results show that woodchips transport with any type of vehicle is less expensive than firewood, however, additional 22 CHF/tDMmust be expected when the energy wood is stored on accessible locations for winter before being chipped (WSS), reducing the final performance of woodchips transport chains by up to 33%. Transport costs per tonne of dry coniferous wood are 23%e47% higher than broadleaves due to its lower mass.
The economic performance ratio RC of broadleaves wood transport ranges between 1.9 : 1 and 11.6 : 1 (Table 4). With the longest distance estimates of the experts, the final income of transporting broadleaves wood using FW-F is only 1.9 times higher than the cost of its transport, which leaves very little margin for the remaining production cost. In fact, the total income following this transport chain is depleted after only 47 km, whereas it reaches as far as 110 km for the higher professionalised FW-PH(Table 6). In comparison, broadleaves woodchips return 5.2 to 8.6 times the cost of their transport and could be transported profitably up to 477 km.
The cost of transporting manure varies between 24 CHF/tDMfor professional solid manure transport (SM-P) and 244 CHF/tDMfor agricultural slurry transport. As for forest wood, loading and unloading manure is nearly as expensive as transport itself (Fig. 3).
In fact, pumping 27 m3 of slurry in a tank lasts nearly 11 min, whereas driving 5 km requires only 7 min by truck. Furthermore, digestate loading represents 30% (underground pipes LM-I) to 75%
(agricultural solid SM-F) of the total transport cost. These costs are more important for SM than for LM, as the analysis is conducted until the delivery of the total dry mass, and therefore additional digestate transport occurs for solid manure, also increasing the impact of loading and unloading. Furthermore, since the same service provider is expected for manure and digestate transport, the more important load volume of an agricultural SM load (20 m3) must be compensated by more frequent slurry tank (10 m3) runs.
With assumed income of 0.41 CHF/kWh for electricity and of 0.054 CHF/kWh for heat, the average income per dry tonne of solid manure is 327 CHF/tDMin our dataset. This led to an economic ratio RCof 6.1 : 1 for SM-P and 2.7 : 1 for SM-F, suggesting that profes- sional SM transport is more than twice as performant than agri- cultural transport (Table 6). Due to lower CH4 yields, slurry generates on average 210 CHF/tDM. Following this the only not performant chain is agricultural slurry transport (0.9 : 1). In order not to exceed potential income from energy, LM-F including digestate transport should not exceed 3 km. However, not consid- ering bringing fermentation slurry tofields would adjust the eco- nomic ratio RCto 1.5 : 1 and increase transport distance to 10 km.
The threshold transport distance of SM-P was 326 km, which was more than twice the distance of SM-F (137 km) (Table 6). Finally, underground pipes had a high RCof 8.7 : 1, which underlines the
importance of using infrastructure-based transport modes, where possible.
3.3. Energy evaluation and maximum transport distances
The energetic performance indicator REdepicts the relation of the primary energy contained in the feedstock to the direct energy required for its transport. Situated between 23 : 1 and 364 : 1, the RE
of transporting manure or forest wood, were much higher than RC. This leads to the result that the energy input of transporting manure and forest wood are less important than their costs and that they represent less than 5% of the primary energy contained in the resource.
Following the different transport chains, the energy input per tDMof broadleaves wood was of the magnitude of ten, the lowest being for C-PL(45e52 MJ/tDM), and the highest for FW-F (222e511 MJ/tDM) (Fig. 3). Resulting ratios REwere between 33 : 1 and 180 : 1 for consumer good firewood (apart from individual small-scale buyers) and between 134 : 1 and 365 : 1 for woodchips (Table 6).
As for costs, intermediate WSS nearly doubled transport’s direct energy inputs and significantly reduced REby on average 45%.
The best energy performance of manure transport was obtained by underground slurry pipes, as only the electricity for loading and unloading through pumping was considered. The used piston pump transported 45 m3of slurry per hour to the fermenter for a capacity of 20 kW, which led to 50 MJ/tDMrequired and a REof 319 : 1. Considering the low quantities of DM transported, agricultural slurry transport required the highest amount of energy (744 MJ/
tDM). The energy used by loading and unloading slurry on agri- cultural tank trailers was more important than transport itself, as we assumed stationary fuel consumption of the tractors to be 100%
of the average hourly fuel consumption (12 l/h). However, due to the important content of primary energy, its ratio REof 22 : 1 was still significantly above one and remained on this level up to a distance of 361 km (Table 6). The higher average dry matter con- tained in solid manure (32%) allowed to push the limit to 3900 km.
3.4. Environmental evaluation and maximum transport distances
As only direct emissions from fuel combustion were considered, energy input and CO2emissions of forest wood followed the same trend. However, emissions from MM and CH4 production at the biogas plant were taken into account when assessing manure transport emissions, drastically impacting the results of the agri- cultural feedstock. For all transport chains, the environmental performance ratio RCO2 was lower than the energy performance ratio, since the avoided emissions depend on the feedstock con- version efficiency.
The lower conversion efficiency of firewood, as compared to woodchips, also increased the gap between the environmental ratio RCO2of the two resources. In fact, except for the private small-
Table 4
Economic, energy and environmental performance ratios of the different forest wood transport chains with longest and shortest distances mentioned by the experts.
Economic performance indicator (RC) Energy performance indicator (RE) Environmental performance indicator (RCO2)
Name of transport chain Broadleaves wood Coniferous wood Broadleaves wood Coniferous wood Broadleaves wood Coniferous wood
FW-PH 4.3e7.2 6.3e3.7 112e180 131e82 53e90 39e65
FW-PL 3.1e5.1 4.3e2.7 50e80 57e35 21e36 15e26
FW-F 1.9e3 2.5e1.6 33e75 53e23 16e38 12e27
FW-SSWB 11.6 9.3 319 226 166 118
C-PL 7.2e8.6 6.1e5.1 256e348 247e182 186e253 133e180
C-PH 6.3e8.4 6.9e5.3 160e279 240e144 117e203 104e174
C-F 5.2e7.4 5.3e3.7 129e192 137e91 93e140 64e99
scale wood buyers (FW-SSWB), broadleaves firewood transport chains emitted between 7 kg CO2/tDM for the highly pro- fessionalised chain FW-PH and 37 kg CO2/tDM for FW-F, and consequently had RCO2between 90 : 1 and 16 : 1 (Table 5). In turn, emissions of chips transport range between 3 kg CO2/tDM(C-PL) and 14 kg CO2/tDM(CeF), which resulted in RCO2of 253 : 1 to 93 : 1.
Winter safe storage added 4.9 kg CO2/tDM(broadleaves) and 6.1 kg CO2/tDM(coniferous) to the initial emissions and reduced their RCO2 by 23%.
Transport emissions of animal manure were negligible as compared to CH4emissions before, during, and after its fermen- tation. Based on the dataset, liquid manure is estimated to emit 510 kg eq-CO2/tDM and solid manure 103 kg eq-CO2/tDM with traditional MM practices. Bringing the animal excretions to biogas plants and reducing manure storage time to 12 days would reduce MM emissions of slurry to 126 kg eq-CO2/tDMand the ones of SM to zero. However, solid manure produces more CH4, which led to losses during production (2%) and digestate storage (3%), exceeding traditional MM (163 kg eq-CO2/tDM). With consideration of the avoided emissions from electricity and heat substitution, the ratio RCO2for agricultural and professional SM transport was of 2.3 : 1 and 2.4 : 1 (Table 5). Accordingly, higher avoided MM emissions and lower methane outputs led to a better performance of slurry on distance estimates from the dataset.
Maximum transport distances due to CO2 emissions were be- tween the cost-restricted and the energy-restricted ones (Table 6).
With increasing distance to thefinal consumer, professionalfire- wood transport chain (FW-PL) of broadleaves wood should not exceed 275 km and only 194 km for coniferous wood. This resulted in the least performant wood transport chain, and coming right after the slurry transport with a tractor. In comparison, woodchips could be transported over a distance of 5000 km if purely envi- ronmental aspects would be considered.
3.5. Cantonal upscaling of the results
According to the answers provided by the experts, the largest amount of firewood wood is transported by professionals with tractors and trailers (FW-PL), while woodchips are carried to con- sumers by container trucks (C-PL) (Fig. 2). Similarly, the criteria elicited during the interviews were used to identify the transport chains utilized for each entry of the manure dataset. They revealed that liquid feedstock transport occurred mostly by means of pro- fessional transporters (LM-P) and solid manure with agricultural ones (SM-F) Applying the estimated frequencies on each canton, our upscaling analysis showed that economic, energy and envi- ronmental performance of forest wood and manure did not follow the same trends across the country (Figs. 4 and 5). For instance, most of the cantons with high economic performance ratio for energy wood seems to be concentrated in the North and the West of Switzerland, whereas manure transport performs averagely in these regions. Following our results, forest wood chains always perform better in terms of energy input and CO2emissions than manure chains. However, the results are less clear when it comes to costs, as the frequent use of underground pipes in some cantons
(e.g. Zurich, Zug) leads to a better economic performance of manure transport compared to forest wood on maximum distance (supplementary material Tables C1 and D1).
When considering different wood types and altitudes, an eco- nomic performance ratio RC ranging from minimum 4.6 : 1 to maximum 8.7 : 1 can be expected across cantons, leaving between 82% and 89% of the margin for additional production costs and profits. Since woodchips perform generally better, higher cost ra- tios could be expected for chips-producing cantons. But since the ratios behave according to the wood types, wood products and altitudes, it appears that in some cases, high levels of woodchips transport could lead to lower efficiencies. In the canton of Obwal- den, woodchips represent 85% of the total energy wood production, 46% of which potentially requiring intermediate WSS, leading to the lowest income-cost ratio of 4.6 : 1 to 5.9 : 1. On the contrary, the mountainous canton of Appenzell Innerrhoden attained a relatively high RCof 5.3 : 1 to 7.8 : 1 due to the large amount offirewood production. However, this same canton scores lowest from the energetic and environmental perspective, as firewood requires more energy and it is consumed in installations with lower efficiencies.
The frequent use of underground pipes to transport slurry leads the Swiss economic performance ratio RCof manure to be higher than expected from antecedent results (Section 3.2) with the lowest cantonal ratio being 3.1 : 1 and the highest one 7.9 : 1. Unlike forest wood, where costs are the main barrier, the environmental performance ratio of manure is lower than the cost ratio across all regions (Fig. 5). In some regions, the environmental performance even contradicts the economic one. This is due to the fact that the methane yield is more important for solid manure, leading to more leakages during biogas production. Solid manure also provides less manure management emissions reduction due to lower MCF (Supplementary Material Table A1). Therefore, cantons with higher amounts of solid manure will have a lower environmental ratio, but they also generate more returns and have higher economic ratio.
For instance, the region of Ticino in the South has a ratio RCof 6.3 : 1, but its RCO2is of 1.5 : 1 only.
4. Discussion
The main scientific challenge of assessing biomass transport chains is the large range of possibilities to transport biomass as well as the wide variety of feedstock (Hamelinck et al., 2005;Ko et al., 2018;Thees et al., 2020). As there was no comparable study avail- able in Switzerland that considers the transport of woody and non- woody biomass from an economic, energetic and environmental viewpoint, we wanted to gain a deeper understanding of this issue by identifying the most widely used transport chains used for biomass. Due to the lack of existing data, we used a mental models approach to capture the plurality of expert knowledge on this topic.
A total of 12 plus one additional transport chains, which were most frequently mentioned during the interviews, were then analysed quantitatively further. All identified transport chains occur within the country, as international transport chains are restricted by higher costs than neighboring countries (Gautschi and Hagenbuch,
Table 5
Economic, energy and environmental performance ratios of the different manure transport chains.
Name of transport chain Economic performance indicator (RC) Energy performance indicator (RE) Environmental performance indicator (RCO2)
LM-P 2.61 39 2.8
LM-F 0.87 22 2.6
LM-I 8.9 319 3.1
SM-P 6.1 71 2.4
SM-F 2.65 42 2.3
2017) and existing regulations (Foen and Foag, 2016). All inter- viewed experts recognized the importance of the transport dis- tances, the haulage capacity and the type and bulk density of the feedstock (Allen et al., 1998; Gonzales et al., 2013; Laitila et al., 2016). In our analysis, liquid manure by underground pipelines was the only transport chain not relying on road infrastructure, although due to topographic and environmental reasons (e.g. water protection areas), their wider use is limited. Therefore, optimizing biomass transport eventually implies a better planning of plant locations, road infrastructure adapted to heavyweight transport
vehicles in order to increase haulage capacity, and eventually a transition to low- or zero-carbon transport fuels.
Our results show that road transport itself is not the only source of impacts from transporting biomass, as loading and unloading represent a significant part of thefinal costs, energy and emissions too. Woodchips transport, relying on different logistics processes, is particularly sensitive to coordination, which is a fact known and highlighted by the interviewed experts. Overall, except for agri- cultural transport of liquid manure, transport always represents at least a third of the potential income that the resource could Table 6
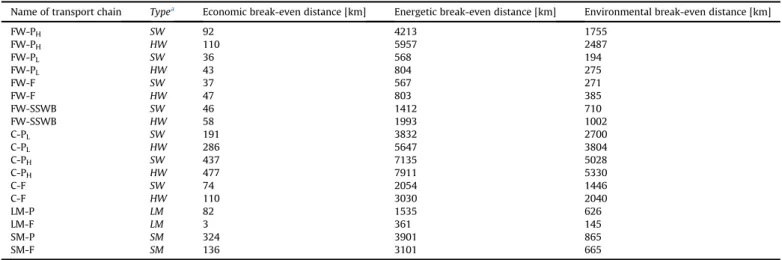
Maximum transport distances according to costs, energy and CO2-emissions performance of biomass transport.
Name of transport chain Typea Economic break-even distance [km] Energetic break-even distance [km] Environmental break-even distance [km]
FW-PH SW 92 4213 1755
FW-PH HW 110 5957 2487
FW-PL SW 36 568 194
FW-PL HW 43 804 275
FW-F SW 37 567 271
FW-F HW 47 803 385
FW-SSWB SW 46 1412 710
FW-SSWB HW 58 1993 1002
C-PL SW 191 3832 2700
C-PL HW 286 5647 3804
C-PH SW 437 7135 5028
C-PH HW 477 7911 5330
C-F SW 74 2054 1446
C-F HW 110 3030 2040
LM-P LM 82 1535 626
LM-F LM 3 361 145
SM-P SM 324 3901 865
SM-F SM 136 3101 665
aSW¼Coniferous wood HW¼Broadleaves wood.
Fig. 4.Economic and energy performance ratios in the Swiss cantons.
provide, leaving a modest margin for the other processes. The economic performance of transport in mountainous areas, requiring intermediate storage, is questionable. Representing less than 5% of the primary energy content for all analysed types of biomass, the energy embodied by the road transport is always negligible and cannot be used as an argument against the use of the resource. The environmental cost of manure, as it is represented in our calculations, is more ambiguous. Here, we point out that the assumed emissions during biogas production (2%) and digestate storage (3%), currently representing a share that is much more important than transport itself, are very conservative. Acknowl- edging the importance of these leakages, in some countries recent plants have more restrictive guidelines, where measurements are frequently effectuated. Such additional information could be used in future analysis to gain precision on effective carbon compensa- tions. However, even with the potentially overestimated CH4losses at the plant, our results suggest that the environmental benefit of manure is two to three times higher than its transport and emis- sions, and therefore underline the importance of encouraging this sector.
In line with previous literature (Gonzales et al., 2013;Hamelinck et al., 2005;Ruiz et al., 2013), our study confirms that the most important barrier to biomass transport is its costs and not its en- ergy and environmental performance. Maximum transport dis- tances vary widely and highly depend on the transport chains. With regard to costs, they range from 477 km for woodchips to 36 km for firewood; 324 km for solid manure to 3 km for agricultural slurry transport. Since this chain is barely used (1% of the total slurry on our dataset), more restrictive distance limitations than the currently used threshold of 15 km do not seem necessary.
Maximum transport distances are extended to at least 360 km according to energy and 145 km to environmental impact. The energy break-even distance of forest wood being close to 8000 km indicates that, looking only at transport, exporting energy wood to neighboring countries, which may sometimes be necessary due to market conditions, must not be seen as energetically or environ- mentally inefficient. However, it should be noted that no other processes of the supply chain were included in the calculation and the threshold distance for the full supply chain might be much shorter. Information on threshold transport distances can be used for optimal plant location and feasibility studies, as they provide the radius of efficient biomass supply.
Swiss regions, with their topographical and geographical vari- ations perform differently. The energy and environmental ratio of
forest wood depend on the same variables, and therefore follow the same trends. The lowest performance score takes place in moun- tainous regions and the best in the less hilly ones. However, the latter cantons are already quite urbanized and an increased harvest would need to be carefully thought through. However, the exploratory nature of this study implied a limited number of in- terviewees and did not allow to specify the importance of each forest wood transport chain in different cantons. Large-scale sur- veys to forestry enterprises could be used to gain a deeper under- standing of these differences. By avoiding the emission of 213 kg eq-CO2saved per tonne of dry matter of liquid manure, greenhouse gas emissions savings of using this agricultural waste are important and should further be encouraged. As costs are the main barrier to its transport, incentives addressing carbon compensations could be provided to exploit the currently underused potential of manure (Burg et al., 2018b;Thees et al., 2017). In the future, this study could be complemented by an uncertainty analysis that would consider the changing availability of the feedstock due to societal factors (e.g. less cattle due to vegetarian diets) or climatic factors (e.g.
slower wood growth) (Speirs et al., 2015). The creation of different scenarios should also examine the possibility of expanded imple- mentation of recent technologies, such as forest wood pelletizing and enhanced manure separation, which would lead to transport chains that are currently neglected.
The transport and environmental impacts of ashes from wood combustion were not considered, whereas manure transport also considered digestate transport. This is due to the fact that ashes represent an insignificant share of all transports (Misra et al., 1993) and thatfilter technologies on recent wood installations capture significant amounts of particle emissions. We decided to include the transport of digestate in calculations in our system boundaries in order to provide a methodology that could be replicable in different countries and with different types of installations. In this study, only agricultural biogas plants were analysed. In Switzerland, the current law ensures that these installations must be situated in a close neighborhood of farms, leading to minimal additional transport. However, the larger is the installation, the larger is its service area to collect feedstock and the further are the fields to spread the digestate. In this case, the transport of fermentation substrate becomes an unavoidable part of the process and should not be ignored. Finally, our study considers only direct energy inputs and greenhouse gas emissions and does not follow a life cycle perspective. In order to have a better understanding of biomass transport for energy, these findings could be Fig. 5.Environmental performance ratios in the Swiss cantons. Due to additional emissions from manure management, methane production and digestate storage, the values for manure are much lower than for forest wood and necessitate different scales of analysis.