ATLAS-CONF-2020-050 15September2020
ATLAS Note
ATLAS-CONF-2020-050
15th September 2020
Measurements of b -jet moments sensitive to
b-quark fragmentation in t t ¯ events at the LHC with the ATLAS detector
The ATLAS Collaboration
The measurement of several observables sensitive to the fragmentation ofb-quarks with 36 fb−1 of
√s = 13 TeV LHC data are presented. Jets containingb-hadrons are obtained from a sample of dileptonict¯t events, and the associated set of charged-particle tracks is separated into those from the primary ppinteraction vertex and those from the displaced b-decay secondary vertex. This division is used to construct high-resolution observables which characterize the longitudinal and transverse momentum distributions of theb-hadron within theb-jet. The measurements have been corrected for detector effects and provide a test of heavy-quark-fragmentation modelling at the LHC with color-connection via the top-quark decay to the proton beam remnants. The unfolded distributions are compared to the predictions of modern Monte Carlo parton-shower generators, and these predictions are found to be largely in agreement with the observed data. These measurements complement similar measurements frome+e−collider experiments in which theb-quarks originate from a color-singletZ/γ∗.
© 2020 CERN for the benefit of the ATLAS Collaboration.
Reproduction of this article or parts of it is allowed as specified in the CC-BY-4.0 license.
1 Introduction
The dominant paradigm for calculations of collider physics observables makes use of quantum chromody- namics (QCD) factorization to separate the perturbative hard-scattering process from non-perturbative initial- and final-state effects. Historically, these effects were separated into three disjoint parts: a non-perturbative structure function representing the extraction of incoming parton configurations from the colliding hadrons, a perturbative hard process, and a non-perturbative fragmentation function mapping the outgoing hard-process partons to final-state hadrons and jets. Much of early QCD physics was conducted within this paradigm [1,2].
This picture has been continually refined in the quest for increased precision and exclusive, realistic, Monte Carlo (MC) event modelling. In particular both the initial and final states are now typically enhanced by perturbative analytic resummation or Markovian parton shower algorithms, which go beyond fixed-order in the QCD coupling to account for the enhanced effects of multiple QCD parton emissions in singular regions of emission phase-space [3]. These can be considered enhancements of the hard process, which were previously absorbed – at a cost of fiducial kinematic accuracy – into the parton density and fragmentation functions. The remaining elements of these, describing the partonic content of the proton (above the factorization scale µF) from which the perturbative scattering is initiated, and the formation of hadrons below the hadronization scale∼ΛQCD, are the parton density functions (PDFs) and fragmentation functions respectively. Both are considered universal over hard-scattering processes (by virtue of the QCD factorization theorem) and are currently obtained by fitting non-perturbative low-scale functions to experimental data – in the case of the PDFs via perturbative evolution to the hard-scattering scales.
The fragmentation of bottom quarks is particularly interesting for several reasons. Firstly,b-quarks play an important in Large Hadron Collider (LHC) analyses, from top-quark and Higgs-boson measurements to new particle searches. This makes it essential that the evolution and hadronization of heavy quarks is well-understood. As a heavy quark whose mass plays a role in automatically regularizing the soft divergence in QCD splitting functions, theb-quarks’ behavior is also a fundamental test of perturbative QCD and the parton-shower formalism [3–7]. Finally, displaced weak-decay vertices make possible an unambiguous experimental connection between observed hadrons and their ancestor parton. Current MC event generator models [8,9] and tunes [10–12] are based onb-fragmentation observables measured at e+e−colliders like LEP [13–15] and SLC [16], which are experimentally and theoretically straightforward to interpret, due to the lack of QCD initial-state radiation and underlying event. However, the combination of perturbative and non-perturbative effects in fragmentation means that the more complex color flow in hadron-collider processes will affect observables related to fragmentation [17,18], so its measurement at the LHC nicely complements those previously carried out at lepton colliders.
In this analysis, a measurement of observables sensitive to the fragmentation ofb-quarks at the LHC is presented, usingt¯t events observed by the ATLAS detector in the 2015 and 2016 data-taking runs.
This choice of process type allows studyingb-jet fragmentation observables in which the b-quarks are color-connected to the initial state. The more complex QCD environment of a hadron collider may also affect fragmentation, via effects like QCD initial-state radiation, multiple partonic interactions, and color reconnection.
The observables used in this paper characterize the evolution of theb-quark momentum into the lower momentum of the weakly decayingb-hadron. This is achieved by comparing the momenta of reconstructed b-hadrons to their containingb-jets and to the event-wide momentum scale set by other top-quark decay
into a color-neutral jet – observables inspired by the simple picture can be well-defined, and receive finite and calculable corrections from the initiator’s color connections. In thee+e− experiments where such observables were previously measured, the partonic scatterings take place in the laboratory frame and hence there is no question as to the energy of the resultingb-quarks in a 2-jete+e−→bb¯ process: each must have the same energy as the incoming electron or positron beam (after correction for initial-state radiation). The fragmentation can hence be probed via the simple functionxB = EB/Ebeam– the energy of theb-hadron divided by that of the beam.
Due to the nature of hadronic initial states, the partonic center-of-mass or energy scale is not well-known for any particular collision event. For this reason, observables are defined based entirely on final-state particles rather than the beam energy.
To reconstruct weakly-decaying b-hadrons, inner-detector tracks are used to build secondary vertices displaced from the hard-scatter collision. The constituents of these secondary vertices correspond to the stable, chargedb-hadron descendants. Theb-hadron’s charged momentum is then calculated as the vectorial sum of all such descendants. Theb-hadron charged momentum is compared to various quantities that provide an energy scale for the surrounding environment.
One obvious choice is to compare theb-hadron to the surrounding jet of particles, constructed via standard clustering techniques. This is natural since the asymptotic aim of all jet algorithms is to cluster flows of energy corresponding to well-separated initial partons in a theoretically safe way: a jet containing a b-hadron is a reasonably well-defined proxy for its initiatingb-quark. Observables based on the ratio of b-hadron andb-jet momenta are by their nature sensitive to the small-angle gluon emissions from the b-quark before hadronization. Two such observables are measured: (1) the ratio of theb-hadron and jet charged momenta transverse to the incoming proton beams (zT,b) and (2) the fraction of the jet charged momentum carried by theb-hadron decay products along the direction of the jet charged momentum (zL,b).
Since theb-hadrons are reconstructed and identified through secondary vertices built from charged-particle tracks, the jet momentum is built from reconstructable charged constituents, putting theb-hadron and the jet on the same footing. The analysis object-selection methodology is therefore focused on the identification of charged particles from primary and secondary vertices.
A comparison between theb-hadron charged momentum and thet¯tsystem is also made. This measurement is performed ineµbbevents, and while the primary role of the electron and muon is to select a pure sample oftt¯events, the lepton momenta are somewhat correlated to the momenta of the top-quarks from which they were produced. Although the leptons are far from a perfect proxy for the top-quarks, their momenta can be determined more precisely than the b-hadron and therefore allow for a characterization of the b-hadrons in the context of the top-quark decays. As such, the observableρis defined as the ratio between the transverse momentum of theb-hadron and the average transverse momentum of the two leptons in the event, where “transverse” is with respect to the colliding proton beams. As opposed tozT,bandzL,b,ρis sensitive to radiation emitted in the top-quark decay, regardless of whether it was contained in theb-jet.
In addition to the above observables that focus on theb-hadron momentum in some context, the number of stable, charged decay products of theb-hadron (nchb) is measured. This observable is sensitive to the b-hadron species production and decay fractions.
For independence from detector biases, and for maximum impact on development of both analytic and MC generatorb-quark fragmentation modelling, the results have been corrected to a fiducial acceptance definition at stable particle level. The unfolded data are then compared to predictions from leading MC models and tunes, which are largely based one+e− xBdistributions.
The organization of this paper is as follows: Section2 gives an overview of the ATLAS detector, and Section3outlines the collision data and MC simulation used in this measurement. Section4describes the object and event selection used in the experimental analysis as well as the fiducial definition to which the observed data are unfolded. The unfolding procedure and systematic uncertainties are presented in Sections5and6, respectively. Finally, the unfolded data are shown in Section7and compared to a number of modern MC generators tuned toe+e−collider data.
2 ATLAS detector
The ATLAS detector [19–21] is a multi-purpose particle detector with a forward/backward-symmetric cylindrical geometry. The detector has a nearly 4πcoverage in solid angle1 and consists of an inner tracking detector, electromagnetic and hadronic calorimeters, and a muon spectrometer. The inner detector is surrounded by a superconducting solenoid providing a 2T magnetic field and covers a pseudorapidity range of|η| < 2.5. The inner detector is composed of silicon pixel and microstrip detectors as well as a transition radiation tracker. The lead/liquid-argon (LAr) electromagnetic sampling calorimeters with high granularity measure electromagnetic energies for the pseudorapidity region of|η| < 3.2. Hadron energies are measured by a hadronic, iron/scintillator tile calorimeter with|η| < 1.7. The forward and endcap regions with 1.5 < |η| < 4.9 are instrumented with LAr calorimeters for both electromagnetic and hadronic measurements. Surrounding the calorimeters, the muon spectrometer consists of three large superconducting toroids with eight coils each. The muon spectrometer has a system of precision tracking chambers covering|η| < 2.7 and fast trigger chambers covering |η| < 2.4. A two-level trigger system is used to select events from collisions [22]. The first-level trigger (L1) is implemented in hardware and utilizes partial detector information to reduce the accepted event rate to 100 kHz from the 40 MHz interaction frequency. The high level trigger (HLT) is software-based and accepts events at a rate of 1 kHz.
3 Data sample and simulation
The measurements in this analysis are based on data collected by the ATLAS detector in 2015 and 2016 at a center-of-mass energy of
√s =13 TeV. The recorded data correspond to an integrated luminosity of approximately 36.1 fb−1. Collision events were only analyzed if all sub-detectors were fully operational and beam conditions were stable when they were recorded.
This analysis requires at least one lepton to be identified in the trigger system for each candidate event.
Depending on the data-taking period, different thresholds were used for electrons and muons. For 2015 data, electrons with pT thresholds of 24 GeV, 60 GeV and 120 GeV and muons with pT thresholds of 20 GeV and 50 GeV were used. For 2016 data, thepTthresholds were increased to 26 GeV, 60 GeV and 140 GeV for electrons and 26 GeV and 50 GeV for muons. The triggers with the lowest pT thresholds include isolation requirements while the triggers with higher thresholds are used to increase the acceptance at higher transverse momentum.
1ATLAS uses a right-handed coordinate system with its origin at the nominal interaction point (IP) in the center of the detector and thez-axis along the beam pipe. Thex-axis points from the IP to the center of the LHC ring, and they-axis points
(r, φ) φ
Several simulated samples have been used to approximate the Standard Model prediction for this measurement, particularly for use in obtaining the corrections for detector biasing effects discussed in Section5. Thet¯tsignal process was simulated at next-to-leading order (NLO) in perturbative QCD using the Powheg v2 [23,24] event generator with the NNPDF3.0 PDF sets [25]. Parton-level configurations obtained with Powheg were processed with the Pythia8.186 generator to model the parton shower (PS) and hadronization, using the A14 set of tuned parameters [12] and the NNPDF2.3 PDF set. The top-quark mass was set to 172.5 GeV in all simulated samples. Thehdampparameter, which controls the transverse momentum of the first additional gluon emission beyond the Born configuration, was set equal to 1.5 times the mass of the top quark. The main effect of this choice is to regulate the high-pTemission against which thet¯tsystem recoils. The factorization and renormalization scales were set to
q m2
top+p2
T, wheremtop is the top-quark mass andpTthe transverse momentum of the top quark. In the A14 Pythia8 tune,αFSRS is nominally set to 0.127, and the Lund-Bowler fragmentation model is used withrB =0.855 [8].
Thett¯cross-section was normalized toσtt¯=832+46−51pb, calculated at next-to-next-to-leading order (NNLO) with next-to-next-to-leading logarithmic soft gluon terms [26–30] using the Top++ 2.0 program [31].
The PDF- and αS-induced uncertainties in this cross-section were calculated using the PDF4LHC prescription [32] with the MSTW2008 68% CL NNLO PDF [33,34], CT10 NNLO PDF [35,36] and NNPDF2.3 5f FFN PDF [37] and were added in quadrature with the uncertainties obtained from the independent variation of the factorization and renormalization scales.
In order to evaluate the signal modelling uncertainties, alternativett¯samples were produced. To evaluate the impact of initial state radiation (ISR), two additional Powheg +Pythia 8 samples were generated. In one sample the factorization and renormalization scales in the matrix-element were scaled down by a factor of two, while at the same time settinghdamp =3mtop and using the Var3c Up variation of the A14 tune.
The other sample was produced with factorization and renormalization scales increased by a factor of two, while keepinghdampto the nominal value of 1.5mtopand using the Var3c Down variation. To account for final-state radiation (FSR) uncertainties, two Powheg +Pythia 8 samples with the Var2 Up and Down variations of the A14 tune were used. A sample with Powheg interfaced to Herwig 7.04 [38,39] with the H7UE tune [39] and the MMHT2014lo68cl [40] PDF set was used to probe the impact of a different parton shower and hadronization model.
The single-top-quark production in thetWchannel was simulated using the Powheg (v1) event generator with the CT10 [41] PDF sets. It was interfaced with the Pythia6.428 generator [42] to model the parton shower PS and hadronization, using the Perugia2012 set of tuned parameters [43] and the CTEQ6L1 PDF sets [44]. The total cross-section for thetW production was calculated at NLO with NNLL soft-gluon corrections [45]. The interference between thet¯tand thetWproduction leads to overlap between the two generated samples. This overlap is removed from thetWsample using the diagram-removal scheme [46].
An alternativetWsample was produced using the diagram-subtraction scheme.
TheZ/γ∗+jets process was simulated using Sherpa2.2.1 with the NNPDF3.0 PDF sets [47]. The matrix- elements were calculated using Comix [48] and OpenLoops [49], for up to two parton at NLO and up to four partons at leading-order (LO) in the QCD coupling. The ME+PS@NLO prescription [50] was used to merge the matrix-element and the parton shower. The total cross-section is normalized to the NNLO calculation [51]. The electroweak diboson processes were simulated using Sherpa2.1.1 using the CT10 PDF sets. The matrix-elements were calculated using Comix and OpenLoops. The matrix-elements for theWW andW Z processes were calculated with zero additional partons at NLO. For theZ Z process, up to one additional parton was calculated at NLO. The matrix-element calculations for all three diboson processes (WW,W Z, andZ Z) were performed for up to three additional partons at LO.
All nominal simulated samples were processed through a simulation of the ATLAS detector [52]
implemented using the Geant 4 [53] framework. A “fast simulation”, using parameterized showers in the calorimeter interaction modelling [54], was used for thet¯tmodelling systematic-variation samples.
Additional inclusiveppinteraction events generated using Pythia8.186 [55] were overlayed on all simulated signal and background events to simulate the effect of multipleppinteractions in each bunch crossing (pile-up). For all samples except the ones generated with Sherpa, the decays ofb- andc-hadrons were modelled using the EvtGen (v1.6.0) program [56].
The same reconstruction algorithms and analysis procedures were applied to both data and MC simulation, allowing for a direct comparison between reconstruction-level quantities and extraction of detector-effect corrections.
4 Analysis
To obtain a high-purity sample of reconstructedb-jets, this analysis uses dileptontt¯events, which provide a high cross-section source ofb-jets with relatively few expected contaminating light jets. Theeµchannel is used exclusively, as it has particularly small contributions from non-t¯tprocesses. Events with an electron, a muon, and exactly two reconstructed jets are selected.
Biases in reconstruction-level observables introduced by the detector and reconstruction algorithms are corrected to a fiducial particle-level event and object selection, designed to match closely the procedure followed for data events. Systematic uncertainties due to possible discrepancies between the observed and predicted data are taken into account by introducing variations on the prediction of background processes and on the response matrices for thet¯tsignal; the considered sources of systematic uncertainty are laid out in Section6. These are propagated through the Fully Bayesian Unfolding (FBU) [57] procedure into the final unfolded distributions, as described in Sections5and6.
4.1 Object definitions and selection
Leptons: To reduce background processes with non-prompt leptons, tight identification criteria for the reconstructed electrons and medium criteria for the muons are imposed [58–60]. Electrons are additionally required to fall into the fiducial area of the electromagnetic calorimeter (|η| <2.47, excluding 1.37< |η| < 1.52), and muons must be central (|η| <2.5). At least one selected lepton has to be matched to a lepton that fired one of the triggers discussed in Chapter3. Both electrons and muons must have pT> 25 GeV to avoid large trigger-efficiency uncertainties for leptons with lowpT, and be isolated from significant energy deposits in the calorimeters and from high-momentum tracks. For 2016 data at least one lepton with pT > 27 GeV is required to account for the higher trigger threshold. Differences in reconstruction and identification efficiencies between data and simulated events are accounted for by application of scaling factors derived inZ →``events, and the lepton energies are calibrated by comparing data to simulation [59,61].
The fiducial lepton definition requirements arepT >25 GeV and|η| <2.5, and the leptons must not have final-state hadron ancestors (i.e. they are “prompt”). Photon dressing is applied to the leptons using a
∆R<0.1 cone around the bare lepton direction.
Jets andb-tagging Detector-level jets are built from topological clusters of energy deposits in calorimeter cells calibrated to the electromagnetic interaction scale, using the anti-kt algorithm withR=0.4 [62]. The resulting jets’ transverse momenta are further corrected to the corresponding particle-level jetpTusing simulation andin-situmethods [63]. After these calibrations, jets withpT < 30 GeV or|η| > 2.5 are removed. A multivariate discriminant method (JVT) [64] is used to remove jets withpT <60 GeV and
|η| < 2.4 that have large estimated energy fractions from pile-up collision vertices; above thispTscale, this requirement is unnecessary. Simulated jets are corrected for JVT efficiency differences with respect to the collision data. In order to avoid double-counting of energy deposits from leptons in calorimeter jets, jets that are reconstructed very near to selected leptons (∆Ry(jet,lepton)<0.2,∆Ry =p
(∆y2+∆φ2)) are removed. Similarly, leptons that are reconstructed within the range 0.2<∆R(jet,lepton) <0.4 are likely to come from heavy-hadron decays and are not considered prompt-lepton candidates.
Jets that are likely to contain ab-hadron are tagged using a multivariate discrimination algorithm (MV2c10) based on inputs from charged-track impact parameter and secondary vertex reconstruction with respect to the hard-scatter primary interaction vertex (PV) [65]. The hard-scatter PV is chosen to be the one with at least two associated tracks and the highestÍ
p2
T, where the sum extends over all tracks withpT > 400 MeV matched to the vertex. The tagger performance was optimized usingb-,c-, and light-flavor jets intt¯events to maintain a high tagging efficiency forb-jets while maximally rejecting lighter-flavor jets. A working point with 70%b-jet tagging efficiency and an approximate light-jet (charm-jet) rejection factor of 400 (10) is used in this analysis.
At particle level, jets are clustered from all final-state particles within the calorimeter acceptance|η| <4.9, except neutrinos and prompt electrons and muons. Like detector-level jets, they are built using the anti-kt algorithm withR=0.4. Fiducial jets are required to havepT > 30 GeV and|η| <2.5. Weakly-decaying b-hadrons withpT >5 GeV are associated to jets by finding the closest jet within∆R< 0.3 to eachb-hadron.
The jets are then labelled as havingb-quark flavor if they have exactly one associated weakly-decaying b-hadron. Jets with two associated b-hadrons are explicitly excluded since they have very different features;
the rate of these jets is very small.
Charged-particle tracks and vertexing: Reconstructed tracks are required to havepT > 500 MeV and fall into the fiducial volume of the inner tracker,|η|< 2.5. The measured observables require identification of the charged decay products of b-hadron candidates, which are reconstructed from inner-detector tracks associated to calorimeter jets by identifying displaced secondary vertices. The detector-level track association to jets uses a∆Rcone whose radius shrinks with increasing jetpTfrom 0.42 for 30 GeV jets to an asymptotic minimum of 0.24:
∆Rmax=0.24+e−(1.22+(1.64×10⁻³)pT/GeV). (1) This association was optimized to maximize discrimination between jets containingb-hadrons from those that do not. Secondary vertex (SV) construction from these loose tracks is performed with the Single Secondary Vertex Finder (SSVF) algorithm, accounting for track momenta and impact parameters [66];
secondary vertices are required to have at least three associated tracks.
The jet charged momentum is constructed using PV tracks in addition to those from theb-hadron candidate secondary vertex. PV tracks are associated to calorimeter jets via ghost-association [67]; in this procedure, tracks are used as infinitesimal-energy (“ghost”) inputs to jet reconstruction, and each track is considered
associated to the jet of which its ghost is a constituent. The total jet charged momentum is built from the union of PV and SV tracks.
4.2 Fiducial event selection and observables
For the fiducial event selection, particle-levelt¯tevents must contain exactly one prompt electron and one prompt muon, each with|η| <2.5 andpT> 25 GeV after photon dressing. The leptons must be oppositely- charged. In addition, exactly twob-labelled jets with|η| <2.1,pT >30 GeV, and∆R(jet,jet)> 0.5 are required. If a particle-leveltt¯event passes the above selection, both jets are considered as possible fiducial probe-jets. The particle-level requirements for these objects are described in more detail in Section4.1.
Fiducial observables reflect their detector-level counterparts as nearly as possible to reduce dependence on the simulation during unfolding. They are calculated using stable, charged particles withpT > 500 MeV, which are called “fiducial charged particles”. Particles are considered stable if they have a mean lifetimeτ >30 ps. Each fiducial probe-jet must contain exactly one weakly-decayingb-hadron with at least three fiducial charged particle decay products. The charged momentum of theb-hadron,p®bch, is the momentum sum of all fiducial charged daughters, and theb-jet charged component,p®ch
jet, is built from all fiducial charged particles that either are jet constituents or areb-hadron daughters. The dressed leptons in the event are used to defineρ.
To summarize, the four observables measured are zch
T,b = pchT,b pch
T,jet
zch
L,b = p®bch· ®pch
jet
|pch
jet|2 ρ= 2pch
T,b
pe
T+pµ
T
nchb =number of fiducialb-hadron children.
4.3 Detector event and probe-jet selection
In the detector-level selection, at least one lepton is required to be identified in the trigger system for each candidate event, using a logical or of the most inclusive electron and muon triggers. Scale factors are applied to the simulation in order to correct for known differences in trigger efficiencies between the simulation and collision data [22], with residual uncertainties accounted for as described in Section6.3.
In order to reject backgrounds with fewer than two prompt leptons (e.g. multijet andW+jets events), exactly two reconstructed leptons with opposite charge are required. Contributions from backgrounds withZ-bosons are suppressed by requiring one lepton to be an electron and one a muon. Exactly two reconstructed jets are required to rejectt¯tevents with light-flavor jets from initial- or final-state radiation.
These two jets must be separated by∆R>0.5 to avoidb-hadron decay products being associated to a jet that does not contain the initialb-hadron.
A tag-and-probe technique is employed to obtain an unbiased measurement of the selected jets. If the leading jet in the event isb-tagged and the subleading jet has a reconstructed secondary vertex with at least three associated tracks, then it is considered a “probe-jet”. This process is then repeated with the roles of the leading and subleading jets reversed, and the fragmentation observables for all probe-jets are measured.
using this procedure it is possible for both jets, only one jet, or even neither jet to be measured. After an event preselection requiring exactly two jets and at least oneb-tagged jet, both jets are valid probe-jets in about 25% oft¯tevents, and only one jet is a valid probe-jet about 17% of the time.
4.4 Sources of background
Several sources of background jets are expected in 13 TeVppcollisions. A “background probe-jet” here is defined as a jet which passes the detector-level requirements but fails the fiducial definition outlined in Sections4.1and4.2. Such jets can originate fromtt¯→eµevents in which oneb-jet from a top-quark decay falls out of the detector acceptance but another jet (often from initial- or final-state radiation) is reconstructed as a valid detector-level probe. They can also arise fromtt e¯ µevents that fail the fiducial event definition but pass the detector-level cuts.
Non-t¯tprocesses with at least one prompt electron, at least one prompt muon, and jets are another source of background probe-jets and are estimated from the MC simulation. In this analysis, thetW, Drell-Yan, and diboson production processes were identified as non-tt¯backgrounds with prompt leptons.
Finally, backgrounds with fewer than two prompt leptons (dominated bytt¯and single-top-quark production) are expected to account for less than 1% of selected events and are estimated from the MC simulation.
4.5 Comparison between prediction and observed data
Table1shows the numbers of selected events and probe-jets after the requirements from Section4.1in both the MC prediction and the observed collision data, including all uncertainties described in Section6.
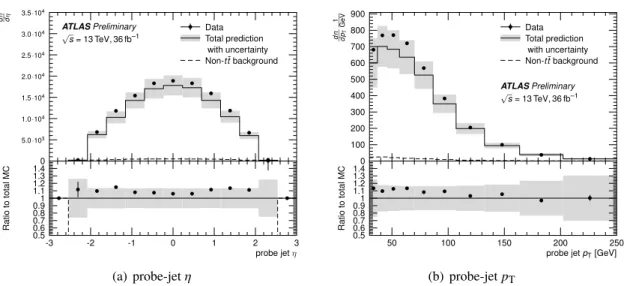
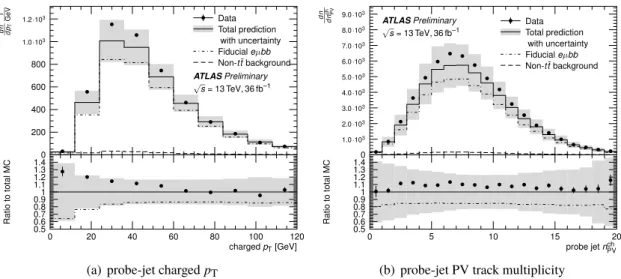
Figures1-3compare relevant probe-jet observables between the MC prediction and the observed data. In both cases all uncertainties described in Section6are included in the prediction uncertainty. Reasonable agreement is observed between the simulated and observed events.
events witheµj j (≥1b-tag) probe-jets
process predicted yields
fiducialt¯t – 44000 ±12000
non-fiducialt¯t – 6700 ±1900
totalt¯t 76000 ±18000 51000 ±12000
single top 4400 ±1500 1580 ±600
Z+jets 125 ±45 13.0 ±5.1
diboson 90 ±34 9.7 ±3.9
total non-t¯t 4600 ±1600 1600 ±600
b-jets – 52200 ±12000
c-jets – 180 ±60
other jets – 250 ±70
total prediction 81000 ±18000 53000 ±12000 observed yields
data 88511 57476
Table 1: Summary of expected and observed event and probe-jet yields.
b b b b b b b b b b b
ATLASPreliminary
√s= 13 TeV, 36 fb–1
b Data
Total prediction with uncertainty Non-t¯tbackground
0 5.0·103 1.0·104 1.5·104 2.0·104 2.5·104 3.0·104 3.5·104
dn dη b b b b b b b b b b b b b
-3 -2 -1 0 1 2 3
0.50.6 0.70.8 0.91 1.11.2 1.31.4
probe jetη
RatiotototalMC
(a) probe-jetη
b b b b b b b b b b
ATLASPreliminary
√s= 13 TeV, 36 fb–1
b Data
Total prediction with uncertainty Non-t¯tbackground
0 100 200 300 400 500 600 700 800 900
dn dpT1 GeV b b b b b b b b b b
50 100 150 200 250
0.50.6 0.70.8 0.91 1.11.2 1.31.4
probe jetpT[GeV]
RatiotototalMC
(b) probe-jetpT
Figure 1: Comparison of detector-level probe-jet observable distributions between simulation and collision data:
probe-jetηandpT. All systematic uncertainties are included in total prediction’s uncertainty band. The first and last histogram bins do not include the under- and over-flow entries.
b b b b b b b b b b
ATLASPreliminary
√s= 13 TeV, 36 fb–1
b Data
Total prediction with uncertainty Fiducialeµbb Non-t¯tbackground
0 200 400 600 800 1.0·103 1.2·103
dn dpT1 GeV b b b b b b b b b b
0 20 40 60 80 100 120
0.50.6 0.70.8 0.91 1.11.2 1.31.4
chargedpT[GeV]
RatiotototalMC
(a) probe-jet chargedpT
b b b b b b b b b b b b b b b b b b b b
ATLASPreliminary
√s= 13 TeV, 36 fb–1
b Data
Total prediction with uncertainty Fiducialeµbb Non-t¯tbackground
0 1.0·103 2.0·103 3.0·103 4.0·103 5.0·103 6.0·103 7.0·103 8.0·103 9.0·103
dn dnch PV b b b b b b b b b b b b b b b b b b b b
0 5 10 15 20
0.50.6 0.70.8 0.91 1.11.2 1.31.4
probe jetnPVch
RatiotototalMC
(b) probe-jet PV track multiplicity
Figure 2: Comparison of detector-level probe-jet observable distributions between simulation and collision data:
probe-jet total chargedpTand the number of tracks associated to the jet that originate from the primary vertex. The nominal non-tt¯background and fiducialtt¯→eµbbpredictions are shown in addition to the total MC prediction; the fiducial probe-jet histogram is not stacked on top of the non-tt¯background in order to show the fraction of expected fiducial events. All systematic uncertainties are included in total prediction’s uncertainty band. The first and last histogram bins do not include the under- and over-flow entries.
b b b b b b b b b b b b
ATLASPreliminary
√s= 13 TeV, 36 fb–1
b Data
Total prediction with uncertainty Fiducialeµbb Non-t¯tbackground
0 5.0·103 1.0·104 1.5·104 2.0·104 2.5·104 3.0·104 3.5·104
dn dm1 GeV b b b b b b b b b b b b
0 1 2 3 4 5 6
0.50.6 0.70.8 0.91 1.11.2 1.31.4
probe jet SV charged mass [GeV]
RatiotototalMC
(a) probe-jet SV mass
b b b b b b b b b b b b b b b b b b b b
ATLASPreliminary
√s= 13 TeV, 36 fb–1
b Data
Total prediction with uncertainty Fiducialeµbb Non-t¯tbackground
0 1.0·106 2.0·106 3.0·106 4.0·106 5.0·106
dn dz b b b b b b b b b b b b b b b b b b b b
0 0.005 0.01 0.015 0.02
0.50.6 0.70.8 0.91 1.11.2 1.31.4
probe jetzrel,bch
RatiotototalMC
(b) probe-jetzch
rel,b
Figure 3: Comparison of detector-level probe-jet observable distributions between simulation and collision data: the invariant mass of all track constituents of the jet secondary vertex and the relative momentum of the secondary vertex to the jet charged momentum,zch
rel,b=|( ®pbch× ®pch
jet)|/| ®pch
jet|2. The nominal non-tt¯background and fiducialtt¯→eµbb predictions are shown in addition to the total MC prediction; the fiducial probe-jet histogram is not stacked on top of the non-tt¯background in order to show the fraction of expected fiducial events. All systematic uncertainties are included in total prediction’s uncertainty band. The first and last histogram bins do not include the under- and over-flow entries.
5 Unfolding procedure
The FBU technique is used to extract the posterior probability of the particle-level differential cross-sections given the observed data. A likelihood of the data given a prediction is constructed with the particle-level signal cross-sections (σ®p) as the parameters of interest. Systematic uncertainties, which are described in more detail in Section6, are included in the likelihood as nuisance parameters (NPs), whose vector of values is denotedp®.
To build the likelihood function, the predicted number of signal and background events is calculated in each bin of the detector-level observables given a set ofσ®pandp®values. The total predicted event count, xi, in biniof a detector-level observable is first constructed as the luminosity,L( ®p), times the predicted background cross-section,bi( ®p), plus the response matrix times the particle-level signal cross-sections, Í
jMi jp→d( ®p)σpj, where jruns over the particle-level bin indices, xi(®σp,p)® = L( ®p) ·
bi( ®p)+Õ
j
Mi jp→d( ®p)σpj
. (2)
The background predictionsbi( ®p)are defined as
bi( ®p)=bi,0+ Õ
k∈NPs
pk(bi,k−bi,0), (3)
wherebi,0is the nominal background prediction in bini, andbi,kis the background prediction in biniwith the variation corresponding to nuisance parameterk. Detector response matrices are computed similarly:
Mi jp→d( ®p)= Mi j,p→d
0 + Õ
k∈NPs
pk(Mi j,kp→d−Mi j,p→d
0 ), (4)
whereMi j,p→d
0 is the nominal probability of a jet in particle-level bin jto be observed in detector-level bini, andMi j,kp→dis the corresponding probability for systematic variationk. A likelihood is then constructed as the product of Poisson probabilites over all detector-level binsias a function of the model parameters,σ®p andp®:
L( ®d| ®σp,p)® =Ö
i
Poisson(di,xi(®σp,p)).® (5)
Finally, Gaussian priors withµ=0 andσ=1 are imposed for the nuisance parameters corresponding to systematic variations; the one exception is the luminosity, for which a log-normal prior is used withµ=0 andσ=0.021, corresponding to the luminosity uncertainty described in Section6. A flat, non-negative prior is imposed on signal cross-sections,σ®p. The posterior probability distribution given the observed data is then
P(®σp,p| ®®d) ∝ L( ®d| ®σp,p) ·® Ö
k∈NPs
Priork(pk). (6)
The maximum of this distribution over all parameters of interest and nuisance parameters is determined using gradient ascent. The distribution is then marginalized by integrating over the nuisance parameters via sampling with a Hamiltonian Markov Chain Monte Carlo [68].
The unfolding procedure has been found to correctly reproduce particle-level spectra from detector-level observations. To check this, both pseudo-data from the nominal Powheg+Pythia8 detector-level prediction and that of Herwig7.0.4 were unfolded to the particle-level. In both cases the central values of the particle-level posterior distributions were in excellent agreement with the true particle-level spectra, well within the total uncertainty of the unfolded pseudo-data.
6 Systematic uncertainties
Systematic uncertainties associated with detector/reconstruction and simulation are treated in this analysis by calculating the detector response matrix and non-fiducial background estimate for each systematic variation and parameterizing the interpolation between templates through nuisance parameters in the unfolding procedure. Here the sources of systematic uncertainty considered in the unfolding of the measured observables are outlined.
In addition to the uncertainties described in the following two subsections, an uncertainty based on observed differences in the jet chargedpTspectrum between the MC prediction and data is derived. This is to ensure that any mismodeling of this observable is accounted for in the non-fiducial background estimate and signal detector response. Weights are derived from the observed differences between the data and simulation, and they are applied to the MC prediction. The effect of this reweighting is propagated into the non-fiducial background prediction and response matrix and treated as a systematic variation in the unfolding model.
6.1 Theory and modeling uncertainties
Four variations on the nominaltt¯MC model are considered. Their effects on both the response matrix as well as the predicted non-fiducialt¯tbackground are taken into account. In addition to the sources of uncertainty listed below, an uncertainty on thett¯normalization in this phase space is considered. Recent experimental measurements in the exclusivett¯+0 jet phase space [69] quote uncertainties at the 10%
level. For the purposes of this analysis, the experimental uncertainty is doubled to 20%; the impact of this uncertainty is very subdominant since normalized cross sections are measured.
• parton shower and hadronization: Powheg +Herwig7.0.4 is used to build an alternative prediction and the difference with respect to the nominal prediction is taken as an uncertainty.
• initial-state radiation: Var3 of the A14 Pythia8 tune corresponds to variations ofαS(mZ)between 0.115 and 0.140. This parameter is varied together with the hadronization and factorization scales in the matrix element and thehdampvalue as described in Chapter3, to increase and decrease the amount of initial-state radiation int¯tevents.
• final-state radiation: The nominal Powheg +Pythia8 A14 sample is compared to two samples generated with Powheg +Pythia8 using the Var2 eigentune variations. The latter include the variations of several parameters in Pythia8, the largest of which is the variation of the amount of final-state radiation by shiftingαFSRS to 0.111 and 0.139, respectively.
• secondary-vertex track multiplicity: Powheg +Pythia8t¯tevents are reweighted to force the number of secondary vertex tracks in simulated probe jets to agree with the observed distribution in probe jets in data. The effect of this reweighting is propagated into the detector response matrix and treated as a systematic uncertainty.
6.2 Non-tt¯modeling uncertainties
In addition to uncertainties on the prediction oftt¯events, we assess a 30% uncertainty on the normalization of three non-t¯tbackground processes with two prompt leptons: tW, Drell-Yan, and diboson production.
The largest of these istW production, for which the difference between the diagram removal (DR) and diagram subtraction (DS) schemes for calculating interference between single-top-quark andt¯tproduction are additionally considered [46].
6.3 Detector uncertainties
The systematic uncertainties related to the imperfect understanding of the detector in data have an impact on the estimated background yield and on the signal detector response. The jet energy scale uncertainty consists of 18 eigenvector components and is derived with a combination of test-beam data, in situ measurements and simulation at 13 TeV [70]. Further contributions originate from theη-intercalibration, jet-flavor composition and response, single-particle response and pile-up effects. Anin situmeasurement of the jet response in dijet events [63] has been used to estimate the systematic uncertainty due to the jet energy resolution. An additional uncertainty to account for the JVT cut efficiency is evaluated.
The uncertainties related to lepton identification, reconstruction, isolation and trigger efficiencies are taken into account by a variation of the corresponding scale factors in simulation within their assigned uncertainties. Additional uncertainties for the modelling of the lepton energy/momentum resolution and scale are also considered. These uncertainties were obtained from measurements in data using J/ψ or Z →``events [59,61].
To correct for different b-tagging efficiencies in simulation and data, scale factors are applied to the simulation. Different scale factors have been obtained forb-jets,c-jets, and light-parton jets fromtt¯data, dijet data, and simulated events [71–73], which are then combined to give nominal scale factors and associated uncertainties. The total error due to theb-tagging efficiency and fake rate in this analysis has been obtained by varying these scale factors within their respective uncertainties.
Uncertainties due to differences between the simulation and data in the detector alignment, track recon- struction efficiency, track fake rate, trackd0resolution, and trackz0resolution have been assessed using Z → µµ, dijet, and minimum-bias events [74,75]. The distribution of the average number of interactions per bunch crossing (hµi) is altered to account for possible mismodeling of additional pileup vertices on the measurement [76,77]. The uncertainty in the combined 2015–2016 integrated luminosity is 2.1% [77], obtained using the LUCID-2 detector [76] for the primary luminosity measurements.
6.4 Uncertainty pruning
Systematic uncertainties with a negligible impact on the background prediction and response matrices are not included in the unfolding procedure; variations that change the predicted background by less than 5% in all detector-level observable bins and alter the response matrix by less than 0.01% in all bins are removed. Uncertainties on the lepton momentum scales and reconstruction efficiencies, the JVT efficiency for hard-scatter jets, tracking uncertainties from the alignment of the inner-tracker, the charm- and light-flavor jetb-tagging mistag rates, the normalization of theZ+jets and diboson production cross sections, and the predicted yield of events with only one prompt lepton are all found to have a small impact on the unfolding ingredients and are therefore neglected.
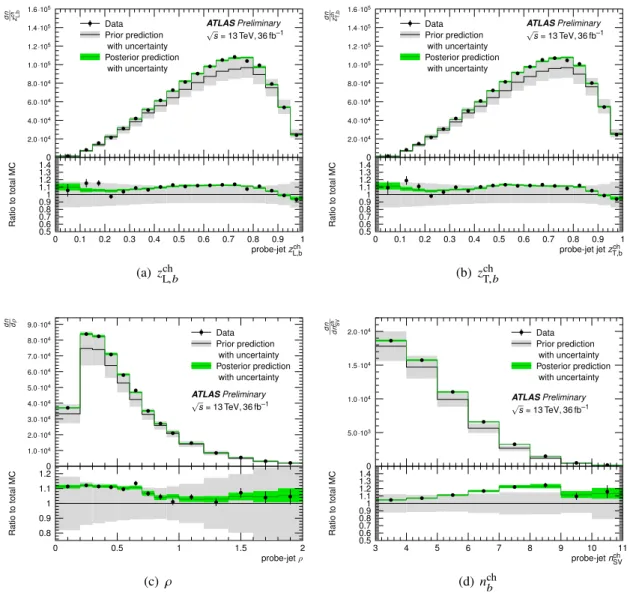
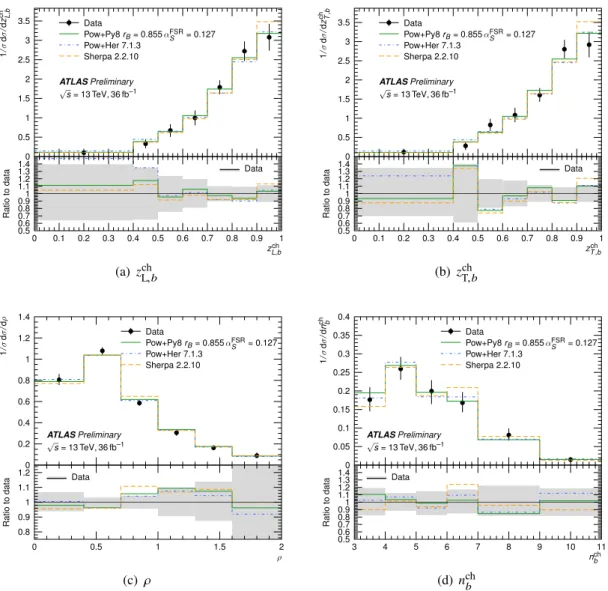
7 Results
Detector-level observable spectra for the collected data and the prediction, both before and after unfolding, are shown in Figure 4; all uncertainties on the background prediction and signal detector response, as described in Section6, are included in the uncertainty bands. The correspondingp-values for each generator configuration given the unfolded observables in collision data are presented in Table3. Reasonable agreement between the detector-level data and simulation is observed forzch
L,b,zch
T,b, andρ. However, the prior prediction shows slightly fewer SV tracks than appear in the data, which motivates the data-based b-hadron production and decay fraction uncertainty described in Section6. Based on the agreement between the data and the posterior prediction, we conclude that the model used to unfold the detector effects is sufficient to describe the observed data.
Posterior distributions for the particle-level cross-sections are extracted using the observed detector-level data, predicted detector response matrices, and predicted detector-level backgrounds. In all figures, data points correspond to the maximum likelihood particle-level cross-sections, and the uncertainty bands are the 16%-84% quantiles of the posterior distribution. Figure5compares the unfolded particle-level observable spectra to MC predictions from Powheg +Pythia8, Powheg +Herwig7, and Sherpa2, which are commonly used in other ATLAS analyses of LHC data. The unfolded spectra are summarized in Table2.
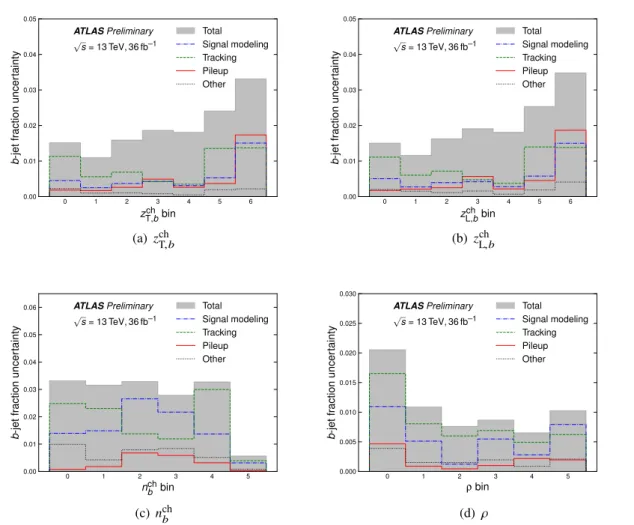
Figure6shows the systematic uncertainties on the fiducialb-jet fractions broken down by source.
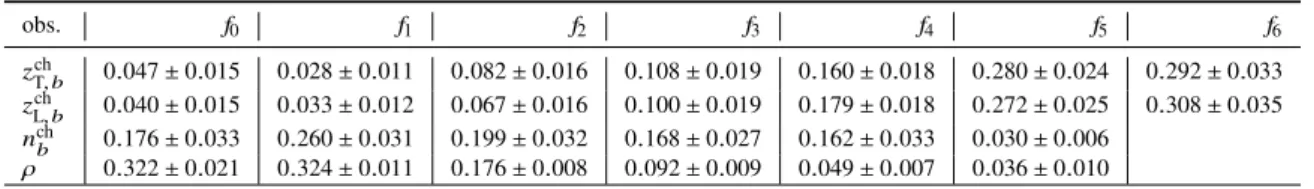
obs. f0 f1 f2 f3 f4 f5 f6
zT,bch 0.047±0.015 0.028±0.011 0.082±0.016 0.108±0.019 0.160±0.018 0.280±0.024 0.292±0.033 zL,bch 0.040±0.015 0.033±0.012 0.067±0.016 0.100±0.019 0.179±0.018 0.272±0.025 0.308±0.035 nchb 0.176±0.033 0.260±0.031 0.199±0.032 0.168±0.027 0.162±0.033 0.030±0.006
ρ 0.322±0.021 0.324±0.011 0.176±0.008 0.092±0.009 0.049±0.007 0.036±0.010
Table 2: Summary of observedb-jet fractions in particle-level bins for the four observables.
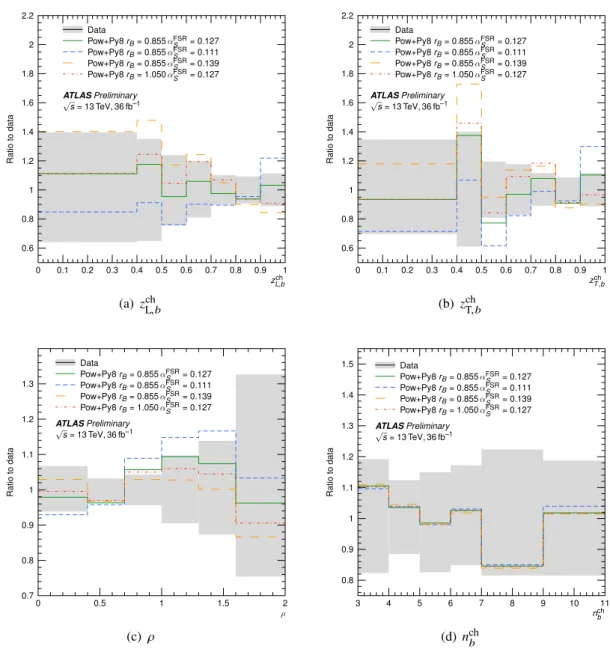
The effect of non-perturbative MC parameters on these observables, which have largely been tuned to the LEP and SLCee→bbdata, is explored. Figure7compares the data to various choices ofαFSRS andrB in the Pythia8 parton shower with the Lund-Bowler fragmentation model. αSFSRvalues of 0.127, 0.111, and 0.139 are those used in the nominal and down/up variations of the A14 tune, respectively; in the original A14 tunerBis taken from the Monash tune and set to 0.855 [11]. In the context of measurement of the top-quark mass,rB was recently re-fitted to the electron-positron collider data with the nominal αSFSR=0.127 value from the A14 tune; a value ofrB =1.050 was found to be optimal, and this choice is
b b b b b b b b b b b b b b b b b b b
ATLASPreliminary
√s= 13 TeV, 36 fb–1
b Data
Prior prediction with uncertainty Posterior prediction
with uncertainty
0 2.0·104 4.0·104 6.0·104 8.0·104 1.0·105 1.2·105 1.4·105 1.6·105
dn zch L,b b b b b b b b b b b b b b b b b b b b
0 0.1 0.2 0.3 0.4 0.5 0.6 0.7 0.8 0.9 1
0.50.6 0.70.8 0.91 1.11.2 1.31.4
probe-jetzchL,b
RatiotototalMC
(a) zch
L,b
b b b b b b b b b b b b b b b b b b b
ATLASPreliminary
√s= 13 TeV, 36 fb–1
b Data
Prior prediction with uncertainty Posterior prediction
with uncertainty
0 2.0·104 4.0·104 6.0·104 8.0·104 1.0·105 1.2·105 1.4·105 1.6·105
dn zch T,b b b b b b b b b b b b b b b b b b b b
0 0.1 0.2 0.3 0.4 0.5 0.6 0.7 0.8 0.9 1
0.50.6 0.70.8 0.91 1.11.2 1.31.4
probe-jet jetzchT,b
RatiotototalMC
(b) zch
T,b
b b b b b b b b b b b b b b
ATLASPreliminary
√s= 13 TeV, 36 fb–1
b Data
Prior prediction with uncertainty Posterior prediction
with uncertainty
0 1.0·104 2.0·104 3.0·104 4.0·104 5.0·104 6.0·104 7.0·104 8.0·104 9.0·104
dn dρ b b b b b b b b b b b b b b
0 0.5 1 1.5 2
0.8 0.9 1 1.1 1.2
probe-jetρ
RatiotototalMC
(c) ρ
b b b b b b b b
ATLASPreliminary
√s= 13 TeV, 36 fb–1
b Data
Prior prediction with uncertainty Posterior prediction
with uncertainty
0 5.0·103 1.0·104 1.5·104 2.0·104
dn dnch SV b b b b b b b b
3 4 5 6 7 8 9 10 11
0.50.6 0.70.8 0.91 1.11.2 1.31.4
probe-jetnSVch
RatiotototalMC
(d)nchb
Figure 4: Comparison between simulation and collision data for detector-level observables of interest. The "prior"
curve corresponds to the nominal observable prediction before unfolding; only uncertainties due to background and detector modeling are included in the uncertainty band. The "posterior" curve corresponds to the posterior probability of the detector-level prediction given the observed data used to unfold to particle level. As expected, good agreement is observed between the posterior prediction and the observed data. The posterior uncertainty is reduced due to correlations between systematic nuisance parameters induced in the Bayesian marginalization.
also compared to data in Figure7[78]. Forzch
L,b, the A14 Pythia8 tune and itsαSFSRvariations accurately describe the data and provide a reasonable uncertainty envelope onb-quark fragmentation.
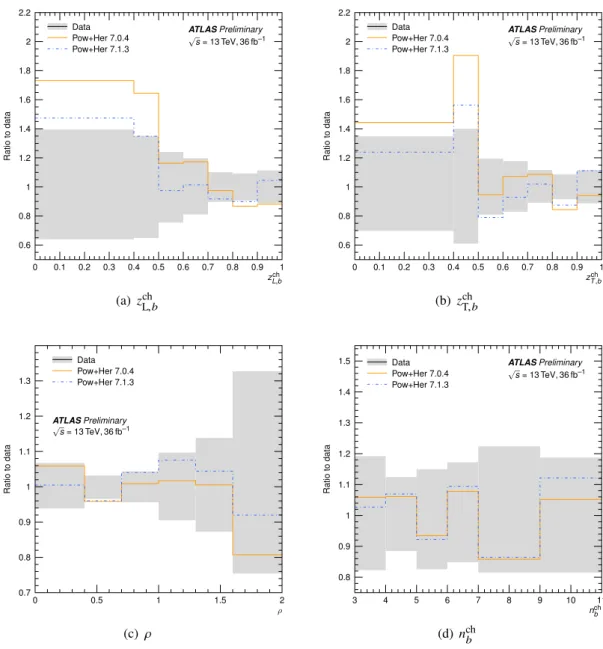
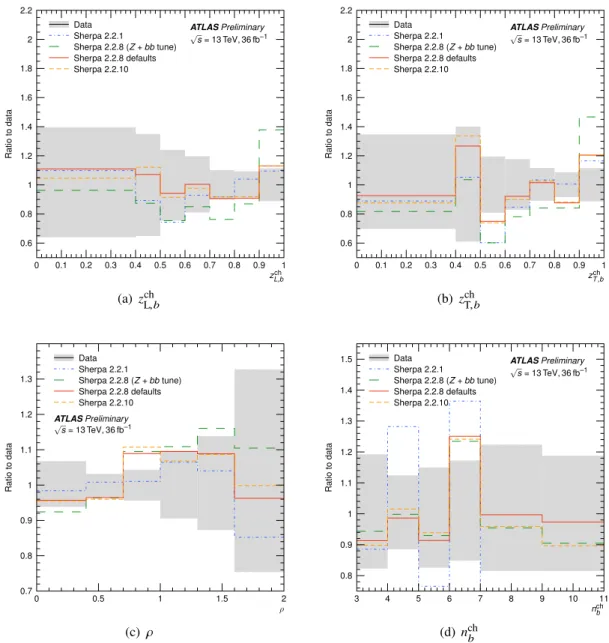
Comparisons are also made to Powheg +Herwig7 and Sherpa predictions in Figures8and9, respectively.
While Herwig7.0.4 appears to overpredictb-hadrons with soft fragmentation, developments introduced in version 7.1 do significantly improve the agreement with LHC data. There has also been substantial progress in recent versions of Sherpa: the choice of parameters used by ATLAS for version 2.2.1 showed significant mismodeling ofnchb, and in versions 2.2.8 and 2.2.10 this is largely corrected. Two Sherpa2.2.8 curves