nanoBRet binding assay
for histamine H 2 receptor ligands using live recombinant HEK293T cells
Lukas Grätz , Katharina tropmann , Merlin Bresinsky , christoph Müller , Günther Bernhardt & Steffen Pockes
*fluorescence/luminescence-based techniques play an increasingly important role in the development of test systems for the characterization of future drug candidates, especially in terms of receptor
binding in the field of G protein-coupled receptors (GPCRs). In this article, we present the
establishment of a homogeneous live cell-based BRet binding assay for the histamine H2 receptor
with different fluorescently labeled squaramide-type compounds synthesized in the course of this study. Py-1-labeled ligand 8 (UR-KAT478) was found to be most suitable in BRET saturation binding experiments with respect to receptor affinity (pK
d= 7.35) and signal intensity. Real-time kinetic experiments showed a full association of 8 within approximately 30 min and a slow dissociation of the ligand from the receptor. Investigation of reference compounds in BRET-based competition binding with 8 yielded pK
ivalues in agreement with radioligand binding data. This study shows that the BRET binding assay is a versatile test system for the characterization of putative new ligands at the
histamine H2receptor and represents a valuable fluorescence-based alternative to canonical binding assays.
The histamine H
2receptor (H
2R), which is activated endogenously by the biogenic amine histamine (1, Fig. 1), is a long known member of rhodopsin-like receptors (class A), the largest and best studied group of G protein- coupled receptors (GPCRs)
1–4. It represents an established target for the treatment of gastroesophageal reflux disease (GERD) and peptic ulcer, with H
2R antagonists, like cimetidine, ranitidine and famotidine (2–4, Fig. 1) being some of the first blockbuster drugs on the market in the 1970s
5. Current research on CNS-penetrating H
2R ligands, especially agonists, are ongoing, to get a better understanding of the role of the H
2R in the brain, as little is known about that so far
6. Since the H
2receptor has been described as being located in postsynaptic neurons and being involved in cognitive processes, it is discussed that stimulation of neuronal H
2Rs could have similar positive effects on memory and learning as antagonizing the H
3R
7–9, which makes the H
2R an interesting target for future drug development.
One of the first steps in developing novel ligands is the investigation of binding properties at the respective target. Until now, the characterization of potential ligands in terms of receptor binding is mostly done performing radioligand binding experiments. Despite its high sensitivity, the use of radiolabeled substances is usually con- nected with some drawbacks. In addition to the constantly increasing costs, the availability as well as the quality of commercial radioligands often declines. Furthermore, the management of radioactive waste is becoming increasingly regulated and expensive. To circumvent these issues, techniques using fluorescently labeled ligands like flow cytometry and the recently described BRET-based binding assay
10,11, which has been adapted to several G-protein coupled receptors (GPCRs)
12–24, have gained great importance.
For the NanoBRET binding assay the NanoLuc, a genetically engineered luciferase
25, is fused to the N-termi- nus of the GPCR of interest
10. After addition of the substrate the enzyme catalyzes an oxidation reaction, which is accompanied by the emission of blue light. Once a suitable fluorescent ligand binds to the tagged receptor, the ligand fluoresces due to bioluminescence resonance energy transfer (BRET). This transfer can only occur when the ligand is in close proximity to the bioluminescent donor, resulting in the observation of a lower non-specific
open
Institute of Pharmacy, University of Regensburg, Universitätsstraße 31, 93053 Regensburg, Germany. *email:
steffen.pockes@ur.de
binding as mainly the receptor-bound fraction of the fluorescent ligand is detected. Additionally, the ligand binding process can be followed in real time and not only after equilibrium is reached, which gives deeper insight into the kinetic behavior of the ligand.
In this study we established a BRET-binding assay for the histamine H
2receptor. Therefore we synthesized three differently labeled fluorescent ligands (8–10, Fig. 1), structurally derived from BMY-25368 (5, Fig. 1), a potent and long-acting histamine H
2receptor antagonist developed by Brystol-Myers in the 1980s
26, and radioligand [
3H]UR-DE257 (7, Fig. 1) from our laboratory
27,28. These fluorescent tracers were tested for their suitability in the BRET binding assay.
Results and discussion
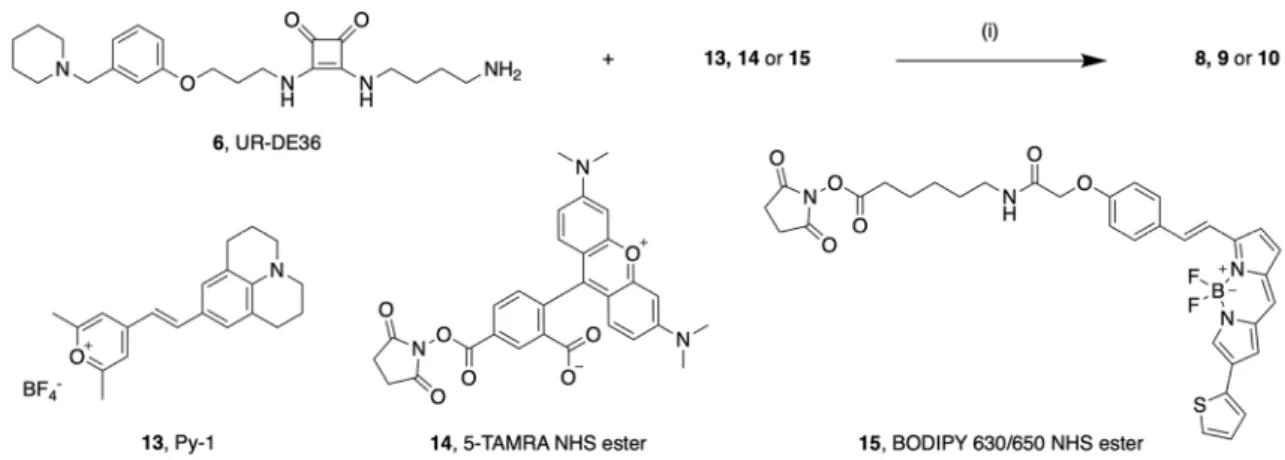
Synthesis of the fluorescent ligands. The synthesis of precursor UR-DE36 (6, Fig. 1) was carried out as previously reported in five steps
28,29. Subsequently, 6 was treated with the respective labeling reagent (13–15, Fig. 2) in the presence of triethylamine resulting in 8–10. Whereas 14 and 15 were commercially available, 13 was synthesized as described
30. Except for 8, aminolyses worked with good yields. Analytical characterization (
1H-NMR, HPLC purity) of the fluorescent ligands 8–10 is shown in the Supplementary Figures S1–S6.
Properties of synthesized ligands. The chemical stability of the fluorescent H
2R ligands 8 (UR-KAT478), 9 (UR-KAT515) and 10 (UR-KAT514) was investigated under assay conditions (pH = 7.4) in binding buffer (BB;
composition see Supplementary Information) at room temperature (rt) (Fig. 3, A, B and C1). Compounds 8 and 9 showed no decomposition during 96 h (Fig. 3, A) and 24 h (Fig. 3, B) incubation, respectively, and exhibited excellent chemical stability. The stability test with compound 10 also showed no chemical degradation. However, after only one hour almost no signal corresponding to compound 10 was detectable (Fig. 3, C1), most prob- ably because of adsorption of the ligand to the plastic vessel. This phenomenon could be confirmed visually by staining of the vessel wall and discoloration of the analyte solution. Addition of DMSO to the binding buffer (BB/DMSO 1:1) reduced adsorption, which is depicted in Fig. 3, C2. In order to prevent the adsorption of the fluorescent ligands in the whole cell-based NanoBRET binding assay, 2% of bovine serum albumin (BSA) were added to the buffer used for all serial dilutions.
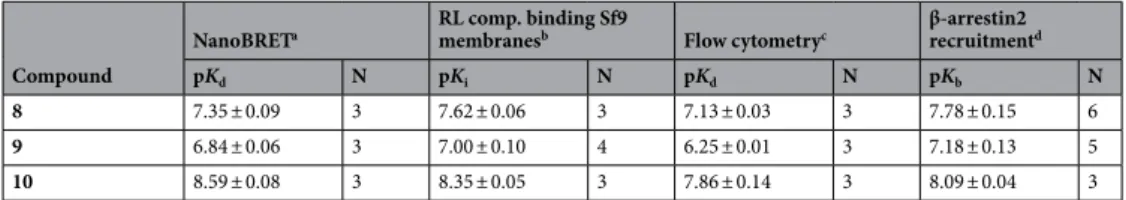
For a first pharmacological characterization of the synthesized compounds radioligand competition binding
experiments, as well as flow cytometric saturation binding experiments were conducted. All ligands exhibited
Figure 1. Structures of reported reference compounds (1–7, 11–12) and the synthesized fluorescent ligands
8–10 for the histamine H
2receptor.
good affinities in the nanomolar range in both test systems, with 10 showing highest affinities (cf. Table 1; Sup- plementary Figs. S8, S9). Moreover, we investigated the ligands in a functional test system using a split-luciferase- based β-arrestin2 recruitment assay
31. All ligands showed antagonistic behavior at the H
2R (see Supplementary Figs. S10, S11) and the obtained pK
bvalues supported the findings from the binding assays described above (Table 1).
BRet-based binding assay at the H
2receptor.
Saturation binding experiments.To investigate the suitability of the synthesized fluorescent ligands (8–10) for their use in the BRET-based binding assay, saturation binding experiments were performed at live HEK293T cells, stably expressing the NLuc-H
2R fusion protein. As depicted in Fig. 4, binding was saturable for all compounds and equilibrium dissociation constants (K
d/pK
dval- ues, respectively) in the nanomolar range could be determined (cf. Table 1). In congruence with the results from the other binding assays, highest affinity was observed for the BODIPY 630/650 (BY630/650)-labeled ligand 10 with a pK
dof 8.59, followed by 8 (Py-1, pK
d= 7.35) and 9 (TAMRA) with a pK
dof 6.84 (Table 1).
Figure 2. Synthesis of fluorescent ligands 8–10. Reagents and conditions: (i) 6 (1.5 equiv.), NEt
3(7.5 or 11 equiv.), 13, 14 or 15 (1 equiv.), DMF, rt, 2 h.
Figure 3. Chromatograms of 8 (A), 9 (B) and 10 (C1 and C2) after different periods of incubation in binding
buffer (pH 7.4, A, B, C1) or a mixture of binding buffer (pH 7.4)/DMSO 1:1 (C2) at rt.
However, beside the moderate signal-to-background ratio of 10, a higher BRET ratio was found for 8 and 9, which makes them more suitable as BRET acceptors (Fig. 4) for screening purposes. Due to its higher binding affinity, when compared to 9, the Py-1-labeled fluorescent ligand 8 was used for further experiments.
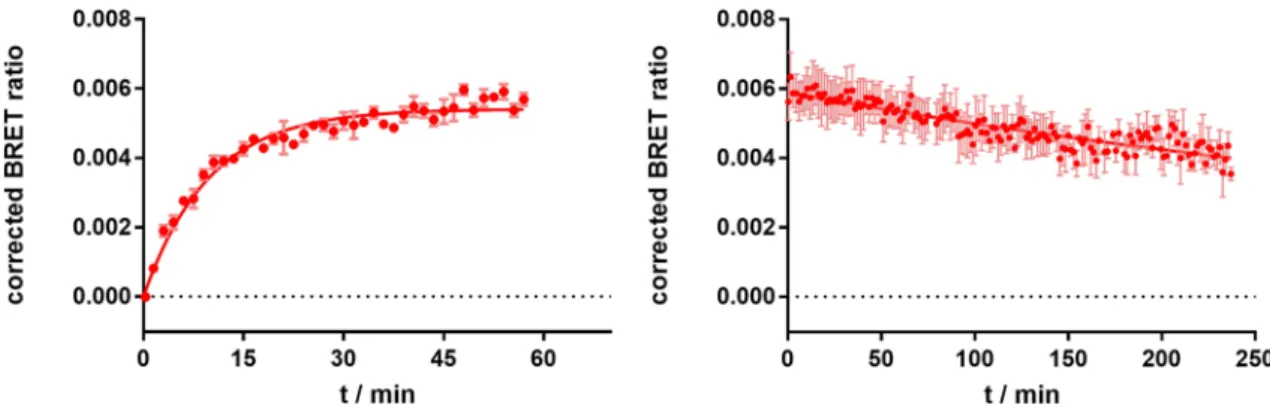
Real‑time kinetic experiments with 8.
For the further characterization of 8, real-time kinetic binding experi- ments were conducted (Fig. 5). Therefore, 50 nM of 8 were used to measure ligand association to the H
2R (Fig. 5, left). The ligand was fully bound to the receptor after approximately 30 min. Dissociation of 8 was initiated by the addition of a 300-fold excess of famotidine (c = 15 µM) after preincubation (60 min) of the cells with fluorescent ligand (c = 50 nM; Fig. 5, right). Slow dissociation kinetics with a dissociation half-life of 300 min were observed and only a small amount of 8 was displaced within 240 min (35–40%). A similar behavior was also reported for the structurally related radioligand 7, leading to the assumption that the pharmacological scaffold is responsible for this type of binding
28. All kinetic parameters describing the binding of 8 are summarized in Table 2.
Investigation of reported H2R ligands in BRET‑based competition binding.
To show the versatility of the pre- sented assay principle, we additionally performed BRET-based competition binding experiments with differ- ent reported H
2receptor agonists and antagonists, using one fixed concentration of 8 (c = 50 nM) and various concentrations of the respective ligands (Fig. 6). Despite the slow dissociation kinetics of 8, all ligands were able to totally displace the fluorescent tracer after 60 min. It is noteworthy that the displacement curve of histamine shows a markedly flatter slope (slope ± SEM = − 0.55 ± 0.03, N = 5) in comparison to the other tested competitive ligands, which could suggest the existence of a second receptor affinity state, as previously described
32. However, this could not be clearly confirmed in a competition binding experiment using an extended set of concentra- tions (cf. Supplementary Fig. S12). Therefore, monophasic binding was assumed for all tested compounds. The pK
ivalues from the BRET competition binding assay are shown in comparison to radioligand binding data are shown in Table 3. Data reported for radioligand binding at CHO hH
2R membranes
32are in good accordance with our NanoBRET data obtained at live recombinant HEK293T cells, while data acquired at Sf9 membranes expressing the hH
2R-Gsα
sfusion protein
28show a larger deviation. It is conspicuous that agonists (1, 11–12) Supplementary Information. Flow cytometric measurements performed at HEK293T-hH
2R-qs5-HA cells as described in the Supplementary Information.
dβ-arrestin2 recruitment assays performed at HEK293T-ARRB2- H
2R cells as described in the Supplementary Information.
Figure 4. Representative isotherms from NanoBRET saturation binding experiments with 8–10 at the NLuc-
hH
2R, stably expressed in HEK293T cells. Non-specific binding was determined in presence of a 300-fold excess
of famotidine. *: Indicated K
d-values are results from single experiments. Error bars of total and non-specific
binding represent SEM. The error of the specific binding was calculated according to the Gaussian law of error
propagation. Each experiment was performed in triplicate (N = 3).
show comparatively higher affinities at Sf9 membranes, whereas antagonists/inverse agonists (2–4) show lower affinities (cf. Table
3). A possible explanation for this observation could be the direct fusion of the receptorwith the Gsα
s, since the receptor is thereby permanently brought into an active receptor conformation favoring agonist binding. In contrast, antagonists and especially inverse agonists do not prefer this receptor state, which may lead to the observation of lower binding affinities. This is relevant as cimetidine (2), ranitidine (3) and famotidine (4) are also often described as inverse agonists at the hH
2R, supporting our finding
33–35. Another possibility for the evident discrepancy in the affinity for histamine (1) is the known allosteric effect of sodium on the binding of agonists to several GPCRs
36. As the buffer used in radioligand binding assays at Sf9 membranes expressing the H
2R is devoid of sodium ions, in contrast to the BRET assay and also to the binding experiments performed at CHO membranes
32, we changed the assay procedure by adding sodium in a physiological concen- tration (c = 145 mM) to the binding buffer. This change resulted in a decrease in affinity for histamine (1) with a pK
iof 4.37 ± 0.02 (N = 3, cf. Table 3
#) for histamine (1), which is now in good agreement to the binding constant from the BRET binding assay. Taken together the presented BRET-based approach yields comparable binding data for reported histamine H
2receptor ligands, which confirms the suitability of the test system in combination with the fluorescent ligand 8.
Figure 5. BRET-based specific binding kinetics of the fluorescent ligand 8 at the NLuc-hH
2R, stably expressed in HEK293T cells. Left panel: Association of 8 (c = 50 nM) to the receptor; Right panel: Dissociation of 8 (c = 50 nM) after preincubation for 60 min. Dissociation was started by addition of famotidine (300-fold excess, c = 15 µM). Graphs show representative experiments (N = 4), each performed in triplicate. Error bars of specific binding represent propagated errors.
Table 2. Kinetic parameters of 8 at the NLuc-hH
2R determined in the BRET-based binding assay.
aData represent mean values ± SEM from four independent experiments.
bDissociation half-life
t1/2= ln(2)/k
off.c
Association rate constant.
dKd(kin)= k
off/k
on.
b,c,dIndicated errors were calculated according to the Gaussian law of error propagation.
kobsa (min−1) koffa (min−1) t1/2b (min) konc (min−1 nM−1) Kd(kin)d (nM)
8 0.093 ± 0.009 0.0023 ± 0.0002 300.4 ± 19.90 0.0018 ± 0.0002 1.30 ± 0.16
Figure 6. Displacement of the fluorescent ligand 8 (c = 50 nM) by reported H
2receptor ligands in BRET-
based competition binding experiments at HEK293T cells, stably expressing the NLuc-hH
2R. Data shown are
means ± SEM from at least four independent experiments, each performed in triplicate.
conclusion
In this study we report the development of a NanoBRET binding assay for the histamine H
2receptor including the synthesis and characterization of suitable fluorescent H
2R ligands. As a homogeneous live cell-based assay, this assay allows for a convenient determination of affinity constants of putative H
2receptor ligands, independ- ent of their mode of action without any washing or separation steps. The results from our BRET binding assay were well comparable to currently used radioactivity- or fluorescence-based (e.g. flow cytometry) binding assays.
Furthermore, real-time kinetic measurements can be performed enabling a better resolved monitoring of ligand- receptor interactions. Prerequisite for the establishment of such assays is the availability of suitable fluorescent ligands. Therefore, we synthesized three differently labeled compounds, all of which have proven to be generally usable in BRET saturation binding experiments. Out of those, substance 8 turned out to be the best compromise with regard to receptor affinity and signal strength and was successfully used for further investigations. Until now, BRET binding assays have only been described for the histamine H
1,3,4receptors
22,23, making this study close the gap of NanoBRET assays within the histamine receptor family. Thus, selectivity studies, which are essential for the development of new drug candidates, can be carried out using the same assay principle increasing the comparability of results. All in all, this study shows that the BRET binding assay is a valuable test system for the histamine H
2receptor and provides a novel fluorescence-based alternative to other conventional binding assays.
Materials and methods
Materials. Dulbecco’s modified Eagle’s medium (DMEM) and HEPES were purchased from Sigma-Aldrich (Munich, Germany). Leibovitz’ L-15 medium (L-15) was from Fisher Scientific (Nidderau, Germany). Fetal calf serum (FCS), geneticin and trypsin/EDTA (0.05%/0.02%) were from Biochrom (Berlin, Germany). Bovine serum albumin (BSA) was sourced from SERVA Electrophoresis (Heidelberg, Germany). Furimazine was from Promega, (Mannheim, Germany). Histamine dihydrochloride was from TCI Chemicals (Tokyo, Japan). Cimeti- dine was from Sigma-Aldrich (Munich, Germany). Famotidine and ranitidine hydrochloride were from Tocris Bioscience (Ellisville, MO, USA). All other chemicals and solvents were purchased from standard commer- cial suppliers [Merck (Darmstadt, Germany), Sigma-Aldrich (Munich, Germany), Acros Organics (Geel, Bel- gium), Alfa Aesar (Karlsruhe, Germany), abcr (Karlsruhe, Germany)] and were used as received. The fluorescent dyes BODIPY 630/650 X NHS ester and 5-TAMRA NHS ester were purchased from Lumiprobe (Hannover, Germany) or abcr (Karlsruhe, Germany) respectively, the pyrylium dye Py-1 was synthesized as previously published
30. All solvents were of analytical grade.
Synthesis and analytical data.
General.NMR spectra were recorded on a Bruker Avance 600 (
1H:
600 MHz) (Bruker, Karlsruhe, Germany) with deuterated solvents from Deutero (Kastellaun, Germany). HRMS was performed on an Agilent 6540 UHD Accurate-Mass Q-TOF LC/MS system (Agilent Technologies, Santa Clara, CA, USA) using an ESI source. Preparative HPLC was performed with a system from Waters (Milford, Massachusetts, USA) consisting of a 2524 binary gradient module, a 2489 detector, a prep inject injector, fraction collector III and the column was a Phenomenex Kinetex (250 × 21 mm, 5 µm) (Phenomenex, Aschaffenburg, Germany). As mobile phase, mixtures of MeCN and 0.1% aqueous TFA were used. UV detection was carried out at 220 nm. Freeze-drying was carried out using a ScanVac CoolSafe 4-15L freeze dryer from Labogene (LMS, Brigachtal, Germany), equipped with a RZ 6 rotary vane vacuum pump (Vacuubrand, Wertheim, Germany).
Analytical HPLC experiments were performed on a 1,100 HPLC system from Agilent Technologies, equipped with Instant Pilot controller, a G1312A Bin Pump, a G1329A ALS autosampler, a G1379A vacuum degasser, a G1316A column compartment and a G1315B DAD detector. The column was a Phenomenex Kinetex XB-C18 each performed in triplicate. NanoBRET experiments were performed at live HEK293T cells stably expressing the NLuc-hH
2R as described in Methods.
bRadioligand competition binding experiments were performed with [
3H]UR-DE257 (hH
2R, K
d= 11.2 nM, c = 20 nM, for representative radioligand saturation binding cf.
Supplementary Fig. S7) on membrane preparations of Sf9 insect cells expressing the hH
2R-Gsα
sfusion protein.
#
Experiments were performed in analogy with
b, apart from the addition of 145 mM NaCl to the binding buffer.
cData from radioligand competition binding experiments performed at CHO-hH
2R membranes, expressing the hH
2R with [
125I]-iodoaminopotentidine
32.
dBiphasic curve with high and low affinity state.
Indicated pK
i-values were re-calculated from published K
i-values.
column (250 × 4.6 mm, 5 µm) (Phenomenex, Aschaffenburg, Germany), tempered at 30 °C. As the mobile phase, mixtures of MeCN and 0.05% aqueous TFA were used. Gradient mode: MeCN/TFA (0.05%) (v/v) 0 min: 10:90, 30 min: 90:10, 33 min: 95:5, 40 min: 95:5, 43 min: 10:90, 50 min: 10:90; flow rate: 0.8 mL/min, t
0= 3.21 min;
capacity factor k = (t
R− t
0)/t
0. Absorbance was detected at 220 nm. Purity of the compounds was calculated as the percentage peak area of the analyzed compound by UV detection at 220 nm. The purities of the fluorescent ligands used for pharmacological investigation were ≥ 95%.
General procedure for the synthesis of the fluorescent ligands.
The amine precursor UR-DE36 (6, (3-((4-Amin- obutyl)amino)-4-((3-(3-(piperidin-1-ylmethyl)phenoxy)propyl)amino)cyclobut-3-ene-1,2-dione × 2 TFA), was synthesized as previously reported
28,29.
Following labeling reactions were carried out in 1.5-mL Eppendorf reaction vessels. The amine UR-DE36 (6, 1.5 equiv.) was dissolved in 30 µL of DMF, before NEt
3(7.5 or 11 equiv.) was added. The labeling reagents (1 equiv.) were dissolved in 20 µL of DMF, added to the mixture and the vessel was rinsed twice with DMF (20 µL and 10 µL). The mixture was stirred at room temperature for 2 h. Subsequently, the reaction was stopped by addtion of 10% aqueous TFA (20 µL). The crude products were purified by preparative HPLC. The solvent was removed by lyophilization.
(E)-1-(4-((3,4-Dioxo-2-((3-(3-(piperidin-1-ylmethyl)phenoxy)propyl)amino)cyclobut-1-en-1-yl)amino) butyl)-2,6-dimethyl-4-(2-(2,3,6,7-tetrahydro-1H,5H-pyrido[3,2,1-ij]quinolin-9-yl)vinyl)pyridin-1-ium (8)
37. The title compound was prepared from amine 6 (6.9 mg, 10.8 µmol), Py-1 (13, 2.8 mg, 7.2 µmol) and NEt
3(7.5 µL, 54 µmol) according to the general procedure yielding the product as a red solid (0.98 mg, 15%).
RP-HPLC: 96.0% (t
R= 17.20 min, k = 4.36).
1H NMR (600 MHz, DMSO-d
6) δ 9.22 (s, 1H), 7.77 (s, 2H), 7.68 (d,
J = 15.9 Hz, 1H), 7.37 (t, J = 7.9 Hz, 1H), 7.10 (s, 2H), 7.07 (s, 1H), 7.05–7.00 (m, 2H), 6.88 (d, J = 16.0 Hz, 1H),6.51 (s, 1H), 4.34–4.28 (m, 2H), 4.22 (d, J = 5.3 Hz, 2H), 4.05 (t, J = 6.0 Hz, 2H), 3.71–3.63 (m, 2H), 3.60–3.51 (m, 2H), 3.25 (t, J = 5.8 Hz, 4H), 2.85 (q, J = 10.9 Hz, 2H), 2.72 (s, 6H), 2.69 (t, J = 6.3 Hz, 4H), 2.03–1.96 (m, 2H), 1.86 (p, J = 6.1 Hz, 4H), 1.83–1.76 (m, 3H), 1.72–1.55 (m, 6H), 1.40–1.29 (m, 1H). HRMS (ESI–MS): m/z M
+calcd.
for C
44H
56N
5O
3+: 702.4378; found: 702.4382; C
44H
56N
5O
3+× C
4HF
6O
4-(930.00).
2-(3,6-Bis(dimethylamino)xanthylium-9-yl)-5-((4-((3,4-dioxo-2-((3-(3-(piperidin-1-ylmethyl)phenoxy)pro- pyl)amino)cyclo-but-1-en-1-yl)amino)butyl)carbamoyl)benzoate (9). The title compound was prepared from amine 6 (5.8 mg, 9.0 µmol), 5-TAMRA NHS ester (14, 3.2 mg, 6.0 µmol) and NEt
3(9.3 µL, 67 µmol) according to the general procedure yielding the product as a pink solid (4.02 mg, 70%). RP-HPLC: 96.5% (t
R= 13.88 min, k = 3.32).
1H NMR (600 MHz, DMSO-d
6) δ 8.35 (s, 1H), 8.91 (t, J = 5.2 Hz, 1H), 8.28 (d, J = 8.2 Hz, 1H), 8.66 (s, 1H), 7.79–7.44 (m, 2H), 7.38 (t, J = 7.9 Hz, 1H), 7.22–6.66 (m, 8H), 4.23 (s, 2H), 4.06 (t, J = 5.92 Hz, 2H), 3.69 (s, 2H), 3.60–3.53 (m, 2H), 3.38–3.34 (m, 2H), 3.33–3.12 (m, 14H), 2.92–2.80 (m, 2H), 2.01 (p, J = 6.3 Hz, 2H), 1.86–1.76 (m, 2H), 1.72–1.54 (m, 7H), 1.41–1.30 (m, 1H). HRMS (ESI): m/z [M + H]
+calcd. for C
48H
55N
6O
7+: 827.4127; found: 827.4126; C
48H
54N
6O
7× C
2HF
3O
2(941.02).
(E)-6-(2-(4-(2-(5,5-Difluoro-8-(thiophen-2-yl)-5H-4λ
4,5λ
4-dipyrrolo[1,2-c:2′,1′-f][1,3,2]diazaborinin-3-yl) vinyl)phen-oxy)acetamido)-N-(4-((3,4-dioxo-2-((3-(3-(piperidin-1-ylmethyl)phenoxy)propyl)amino) cyclobut-1-en-1-yl)amino) butyl)hexanamide (10). The title compound was prepared from amine 6 (4.2 mg, 6.5 µmol), BODIPY 630/650 X NHS ester (15, 2.9 mg, 4.3 µmol) and NEt
3(6.6 µL, 47 µmol) according to the general procedure yielding the product as a dark blue solid (3.25 mg, 69%). RP-HPLC: 98.3% (t
R= 20.84 min, k = 5.49).
1H NMR (600 MHz, DMSO-d
6) δ 9.19 (s, 1H), 8.12 (t, J = 5.8 Hz, 1H), 8.03 (dd, J = 3.8, 1.1 Hz, 1H), 7.82 (dd, J = 5.0, 1.1 Hz, 1H), 7.78–7.70 (m, 2H), 7.62–7.57 (m, 3H), 7.41–7.34 (m, 3H), 7.30–7.25 (m, 3H), 7.08–7.04 (m, 3H), 7.04–6.99 (m, 2H), 6.94 (d, J = 4.2 Hz, 1H), 4.52 (s, 2H), 4.21 (d, J = 5.2 Hz, 2H), 4.04 (t,
J = 6.1 Hz, 2H), 3.66 (s, 3H), 3.31–3.26 (m, 3H), 3.10 (q, J = 6.7 Hz, 2H), 3.02 (q, J = 6.6 Hz, 2H), 2.88–2.79 (m,2H), 2.52–2.50 (m, 2H), 2.05–1.95 (m, 4H), 1.84–1.76 (m, 2H), 1.70–1.53 (m, 3H), 1.51–1.28 (m, 8H), 1.27–1.14 (m, 2H). HRMS (ESI): m/z [M + H]
+calcd. for C
52H
61BF
2N
7O
6S
+: 960.4460; found: 960.4471; C
52H
60BF
2N
7O
6S
× C
2HF
3O
2(1,073.99).
Generation of plasmids. The cDNA coding for the human H
2R was purchased from the Missouri cDNA resource centre (Rolla, MO, USA). The plasmid encoding NanoLuc was kindly provided by Promega (Man- nheim, Germany). The sequences of the receptor and the luciferase were amplified using standard PCR tech- niques, introducing restriction sites at their respective 5′ and 3′ ends as well as the membrane signal peptide of the murine 5HT
3Areceptor upstream of the luciferase gene. These were then cloned in-frame into the pcDNA3.1/
myc-HIS (B) vector backbone separated by a flexible linker (-SGGGS-) to generate the plasmid encoding the NLuc-hH
2R. All sequences were verified by sequencing (Eurofins Genomics, Ebersberg, Germany).
Cell culture and transfection. All cells were routinely cultivated in DMEM + 10% FCS in a water-satu-
rated atmosphere containing 5% CO
2at 37 °C and regularly monitored for mycoplasm infection using the Venor
GeM Mycoplasma Detection Kit (Minerva Biolabs, Berlin, Germany). In order to generate stable transfectants,
HEK293T wild-type cells were seeded at a density of 3 × 10
5cells/mL in a 6-well plate (Sarstedt, Nümbrecht,
Germany) one day prior to transfection with 2 µg of cDNA using XtremeGene HP transfection reagent (Roche
Diagnostics, Mannheim, Germany) according to the manufacturer’s protocol. After two days of incubation
(water-saturated atmosphere, 5% CO
2, 37 °C), transfected cells were trypsinized, transferred to a 15 cm cell cul-
ture dish (Sarstedt, Nümbrecht, Germany) in DMEM and geneticin was added at a final concentration of 1 mg/
according to manufacturer’s protocol beforehand, were added. After 5 min of equilibration time at 27 °C, the measurement was started. Competition binding experiments were performed as described above using one fixed concentration of fluorescent ligand 8 (c = 50 nM) and varying concentrations of the competitors 1–4, 11, 12, that were added at the same time. Kinetic measurements were performed as follows: 10 µL of L-15 (for total bind- ing) or 4 (300-fold excess, c = 15 µM, non-specific binding) were added to the cells. After addition of the diluted substrate, the plate was placed inside the reader for 5 min to equilibrate. To start association 50 µL of a threefold concentrated solution of the fluorescent ligand 8 (c
final= 50 nM) were added to the adherent cells and the plate was measured for 60 min. Dissociation experiments were conducted in wells, which have been preincubated with 8 as described above for association experiments. To initiate dissociation, 50 µL of a fourfold concentrated solution of 4 (300-fold excess, c
final= 15 µM) were added to the cells and the measurement was performed for 4 h.
All measurements were performed on a TECAN InfiniteLumi plate reader (TECAN, Grödig, Austria) at 27 °C using the Blue2 NB (460 nm ± 35 nm, bandpass) and the Red NB (> 610 nm, longpass) filter combination with an integration time of 100 ms. For the kinetic experiments, integration time was increased to 500 ms for both channels to reduce noise. BRET ratios were calculated by dividing the acceptor emission (red NB) by the donor luminescence (Blue2 NB).
For all BRET binding experiments, specific binding was calculated by subtracting non-specific binding from total binding yielding the “corrected BRET ratio”. For saturation binding experiments, total and non-specific binding were fitted simultaneously using the “one-site total and nonspecific binding” fit. Specific binding was fitted accordingly applying the “one-site specific binding” fit. For competition binding experiments, data were normalized to buffer control (0%) and a 100%-control containing solely fluorescent ligand. The normalized competition binding curves were then fitted with a four-parameter logistic fit yielding pIC
50-values. These were transformed into pK
i-values using the Cheng–Prusoff equation
38.
For kinetic experiments, association experiments were fitted with the “one-phase association” fit yielding k
obs, whereas the dissociation experiments were fitted assuming a “one-phase decay” model resulting in k
off. The asso- ciation rate constant k
onwas calculated using the following equation: k
on= (k
obs− k
off)/c(ligand); c(ligand) = 50 nM.
Dissociation half-life t
1/2was calculated applying the following formula: t
1/2= ln(2)/k
off.The kinetic equilibrium dissociation constant K
d(kin)was calculated as follows: K
d(kin)= k
off/k
on. The errors for k
on,t
1/2and K
d(kin)were cal- culated according to the Gaussian law of error propagation. All experimental data were analyzed using Prism 8 software (GraphPad, San Diego, CA, USA).
Data availability
The datasets generated and analyzed during the current study are available from the corresponding author on reasonable request.
Received: 3 February 2020; Accepted: 24 July 2020
References
1. Lagerström, M. C. & Schiöth, H. B. Structural diversity of G protein-coupled receptors and significance for drug discovery. Nat.
Rev. Drug Discov. 7, 339–357 (2008).
2. Black, J. W., Duncan, W. A. M., Durant, C. J., Ganellin, C. R. & Parsons, E. M. Definition and antagonism of histamine H2-receptors.
Nature 236, 385–390 (1972).
3. Schwartz, J.-C., Pollard, H. & Quach, T. T. Histamine as a neurotransmitter in mammalian brain: neurochemical evidence. J.
Neurochem. 35, 26–33 (1980).
4. Hill, S. J. et al. International Union of Pharmacology. XIII. Classification of histamine receptors. Pharmacol. Rev. 49, 253–278 (1997).
5. Van Der Goot, H. & Timmerman, H. Selective ligands as tools to study histamine receptors. Eur. J. Med. Chem. 35, 5–20 (2000).
6. Pockes, S., Wifling, D., Keller, M., Buschauer, A. & Elz, S. Highly potent, stable, and selective dimeric hetarylpropylguanidine-type histamine H2 receptor agonists. ACS Omega 3, 2865–2882 (2018).
7. Darras, F. H. et al. Synthesis, biological evaluation, and computational studies of tri-and tetracyclic nitrogen-bridgehead compounds as potent dual-acting AChE inhibitors and hH3 receptor antagonists. ACS Chem. Neurosci. 5, 225–242 (2014).
8. Khan, N. et al. The dual-acting H3 receptor antagonist and AChE inhibitor UW-MD-71 dose-dependently enhances memory retrieval and reverses dizocilpine-induced memory impairment in rats. Behav. Brain Res. 297, 155–164 (2016).
9. Sadek, B., Khan, N., Darras, F. H., Pockes, S. & Decker, M. The dual-acting AChE inhibitor and H 3 receptor antagonist UW-MD- 72 reverses amnesia induced by scopolamine or dizocilpine in passive avoidance paradigm in rats. Physiol. Behav. 165, 383–391 (2016).
10. Stoddart, L. A. et al. Application of BRET to monitor ligand binding to GPCRs. Nat. Methods 12, 661–663 (2015).
11. Stoddart, L. A., White, C. W., Nguyen, K., Hill, S. J. & Pfleger, K. D. G. Fluorescence- and bioluminescence-based approaches to study GPCR ligand binding: fluorescence and bioluminescence in ligand binding. Br. J. Pharmacol. 173, 3028–3037 (2016).
12. Stoddart, L. A., Kilpatrick, L. E. & Hill, S. J. NanoBRET approaches to study ligand binding to GPCRs and RTKs. Trends Pharmacol.
Sci. 39, 136–147 (2018).
13. Christiansen, E., Hudson, B. D., Hansen, A. H., Milligan, G. & Ulven, T. Development and characterization of a potent free fatty acid receptor 1 (FFA1) fluorescent tracer. J. Med. Chem. 59, 4849–4858 (2016).
14. Hansen, A. H. et al. Development and characterization of a fluorescent tracer for the free fatty acid receptor 2 (FFA2/GPR43). J.
Med. Chem. 60, 5638–5645 (2017).
15. Sakyiamah, M. M., Nomura, W., Kobayakawa, T. & Tamamura, H. Development of a NanoBRET-based sensitive screening method for CXCR4 ligands. Bioconjug. Chem. 30, 1442–1450 (2019).
16. Wu, Q.-P. et al. Application of the novel bioluminescent ligand–receptor binding assay to relaxin-RXFP1 system for interaction studies. Amino Acids 48, 1099–1107 (2016).
17. Hoare, B. L. et al. Multi-component mechanism of H2 relaxin binding to RXFP1 through NanoBRET kinetic analysis. iScience 11, 93–113 (2019).
18. Wang, J.-H. et al. A novel BRET-based binding assay for interaction studies of relaxin family peptide receptor 3 with its ligands.
Amino Acids 49, 895–903 (2017).
19. White, C. W., Johnstone, E. K., See, H. B. & Pfleger, K. D. NanoBRET ligand binding at a GPCR under endogenous promotion facilitated by CRISPR/Cas9 genome editing. Cell. Signal. 54, 27–34 (2019).
20. Soave, M., Stoddart, L. A., Brown, A., Woolard, J. & Hill, S. J. Use of a new proximity assay (NanoBRET) to investigate the ligand- binding characteristics of three fluorescent ligands to the human β1-adrenoceptor expressed in HEK-293 cells. Pharmacol. Res.
Perspect. 4, e00250 (2016).
21. Conroy, S. et al. Synthesis and evaluation of the first fluorescent antagonists of the human P2Y2 receptor based on AR-C118925.
J. Med. Chem. 61, 3089–3113 (2018).
22. Stoddart, L. A. et al. Development of novel fluorescent histamine H1-receptor antagonists to study ligand-binding kinetics in living cells. Sci. Rep. 8, 1572 (2018).
23. Mocking, T. A. M., Verweij, E. W. E., Vischer, H. F. & Leurs, R. Homogeneous, real-time NanoBRET binding assays for the histamine H3 and H4 receptors on living cells. Mol. Pharmacol. 94, 1371–1381 (2018).
24. Kozielewicz, P., Bowin, C.-F., Turku, A. & Schulte, G. A NanoBRET-based binding assay for smoothened allows real-time analysis of ligand binding and distinction of two binding sites for BODIPY-cyclopamine. Mol. Pharmacol. 97, 23–34 (2020).
25. Hall, M. P. et al. Engineered luciferase reporter from a deep sea shrimp utilizing a novel imidazopyrazinone substrate. ACS Chem.
Biol. 7, 1848–1857 (2012).
26. Cavanagh, R. L. & Buyniski, J. P. Effect of BMY-25368, a potent and long-acting histamine H2-receptor antagonist, on gastric secretion and aspirin-induced gastric lesions in the dog. Aliment. Pharmacol. Ther. 3, 299–313 (1989).
27. Li, L. et al. Synthesis and pharmacological activity of fluorescent histamine H2 receptor antagonists related to potentidine. Bioorg.
Med. Chem. Lett. 13, 1717–1720 (2003).
28. Baumeister, P. et al. [3H]UR-DE257: development of a tritium-labeled squaramide-type selective histamine H2 receptor antagonist.
ChemMedChem 10, 83–93 (2015).
29. Buschauer, A., Postius, S., Szelenyi, I. & Schunack, W. Isohistamine and homologs as components of H2-antagonists. 22. H2-anti- histaminics. Arzneimittelforschung 35, 1025–1029 (1985).
30. Höfelschweiger, B. K. The pyrylium dyes: a new class of biolabels. Synthesis, spectroscopy, and application as labels and in general protein assay. PhD Thesis, University of Regensburg (2005).
31. Felixberger, J. Luciferase complementation for the determination of arrestin recruitment: Investigations at histamine and NPY receptors. PhD Thesis, University of Regensburg (2014).
32. Leurs, R., Smit, M. J., Menge, W. M. & Timmerman, H. Pharmacological characterization of the human histamine H2 receptor stably expressed in Chinese hamster ovary cells. Br. J. Pharmacol. 112, 847–854 (1994).
33. Alewijnse, A. E. et al. Constitutive activity and structural instability of the wild-type human H2 receptor. J. Neurochem. 71, 799–807 (1998).
34. Preuss, H. et al. Mutations of Cys-17 and Ala-271 in the human histamine H2 receptor determine the species selectivity of guanidine-type agonists and increase constitutive activity. J. Pharmacol. Exp. Ther. 321, 975–982 (2007).
35. Preuss, H. et al. Constitutive activity and ligand selectivity of human, guinea pig, rat, and canine histamine H2 receptors. J. Phar‑
macol. Exp. Ther. 321, 983–995 (2007).
36. Katritch, V. et al. Allosteric sodium in class A GPCR signaling. Trends Biochem. Sci. 39, 233–244 (2014).
37. Erdmann, D. Histamine H2- and H3-receptor antagonists: synthesis and characterization of radiolabelled and fluorescent phar- macological tools. PhD Thesis, University of Regensburg (2011).
38. Cheng, Y.-C. & Prusoff, W. H. Relationship between the inhibition constant (Ki) and the concentration of the inhibitor which causes 50 per cent inhibition (I50) of an enzymatic reaction. Biochem. Pharmacol. 22, 3099–3108 (1973).