Impact of drugs targeting tumor metabolism on CD8 T cell effector function
DISSERTATION ZUR ERLANGUNG DES
DOKTORGRADES DER NATURWISSENSCHAFTEN (DR. RER. NAT.) DER FAKULTÄT FÜR BIOLOGIE UND VORKLINISCHE MEDIZIN
DER UNIVERSITÄT REGENSBURG
vorgelegt von
Christina Bruß
aus Schwandorf
im Jahr 2019
The present work was carried out from September 2014 to January 2019 at the Clinic and
Polyclinic of Internal Medicine III at the University Hospital Regensburg.
Die vorliegende Arbeit entstand im Zeitraum von September 2014 bis Januar 2019 an der Klinik und Poliklinik für Innere Medizin III des Universitätsklinikums Regensburg.
Das Promotionsgesuch wurde eingereicht am: 11. Januar 2019 Die Arbeit wurde angeleitet von: Prof. Dr. Marina Kreutz
Unterschrift:
____________________________
To my parents
Meinen Eltern
I
Table of contents
List of figures
... VIList of tables
... IXList of abbreviations
... X1. Introduction
... 11.1. The human immune system ... 1
1.2. T cell differentiation and maturation ... 1
1.3. Human CD8 T cells ... 3
1.3.1. Differentiation of human CD8 T cells ... 3
1.3.2. CD8 T cells as key players in the immune response... 5
1.3.3. Metabolism of T cells – a link between metabolism and effector functions? ... 7
1.3.3.1. Glucose metabolism is strongly increased in activated T cells ... 7
1.3.3.2. Amino acids play an essential role in T cell activation and metabolism ... 9
1.3.3.3. Mitochondrial respiration in T cells ... 11
1.3.3.4. Subset specific differences in the metabolic phenotype of T cells ... 12
1.4. Impact of tumor metabolism on tumor infiltrating immune cells ... 13
1.5. State of the art: Targeting the tumor metabolism as an emerging strategy in cancer therapy ... 15
1.5.1. Targeting glucose metabolism as a promising concept for anti-tumor therapy ... 16
1.5.2. Targeting mitochondrial respiration in the context of tumor therapy ... 18
1.5.3. Targeting amino acid metabolism for tumor therapy ... 18
1.5.4. Application of anti-metabolic drugs in immunotherapy: opportunities and challenges ... 19
1.6. Hypothesis and objectives ... 20
II
2. Material and methods
... 212.1. Materials ... 21
2.1.1. Equipment ... 21
2.1.2. Consumables ... 22
2.1.3. Media, buffers and solutions ... 23
2.1.3.1. Medium for cultivation of human T cells ... 24
2.1.3.2. Medium for cultivation of human DCs ... 24
2.1.3.3. Medium for cultivation of murine T cells ... 24
2.1.3.4. Freezing medium ... 25
2.1.3.5. FACS staining buffer ... 25
2.1.3.6. MACS buffer ... 25
2.1.3.7. EDTA (200 mM) ... 25
2.1.3.8. ACK lysis buffer (6x) ... 25
2.1.4. Kits, reagents and chemicals ... 26
2.1.5. Antibodies ... 27
2.1.5.1. Antibodies for western blotting ... 27
2.1.5.2. Antibodies for flow cytometry ... 28
2.1.5.2.1. Anti-human antibodies ... 28
2.1.5.2.2. Anti-mouse antibodies ... 29
2.1.5.2.3. Other antibodies and dyes ... 29
2.1.6. Databases and software ... 29
2.2. Methods ... 30
2.2.1. Cell culture methods for human immune cells ... 30
2.2.1.1. Cell counting and cell size monitoring using the Casy system ... 30
2.2.1.2. Freezing and thawing of cells ... 30
2.2.1.3. Isolation of human immune cells ... 31
2.2.1.3.1. Isolation of human mononuclear cells by density gradient centrifugation ... 31
2.2.1.3.2. Separation of monocytes by counterflow centrifugation elutriation ... 31
2.2.1.3.3. Maturation of monocytes to DCs ... 32
2.2.1.3.4. Isolation of human CD8 T cells ... 32
2.2.1.4. T cell stimulation, cultivation and experimental setup for human T cells ... 33
III
2.2.1.5. Cultivation under metabolic restriction ... 34
2.2.2. Cell culture methods for murine immune cells ... 34
2.2.2.1. Mice ... 34
2.2.2.2. Isolation of murine immune cells ... 34
2.2.2.2.1. Tissue preparation of the spleen for the isolation of splenocytes ... 34
2.2.2.2.2. Isolation of murine CD4 and CD8 T cells ... 35
2.2.2.2.3. Stimulation, cultivation and experimental setup for murine T cells ... 36
2.2.3. Western blot analysis ... 36
2.2.4. Flow cytometry ... 36
2.2.4.1. Staining of extracellular surface marker ... 37
2.2.4.2. Antibody staining of intracellular molecules for flow cytometry ... 37
2.2.4.3. Cell viability measurement by 7AAD and Annexin V staining ... 37
2.2.4.4. Analysis of mitochondrial content by MitoTracker Green staining ... 38
2.2.4.5. Determination of glucose uptake with 2-NBDG by flow cytometry... 38
2.2.4.6. Fluorescence activated cell sorting ... 38
2.2.5. Methods for metabolic analysis ... 40
2.2.5.1. Determination of glucose consumption ... 40
2.2.5.2. Determination of lactate accumulation ... 40
2.2.5.3. Measurement of the cellular oxygen consumption with the PreSens technology ... 40
2.2.5.4. Measurement of the cellular oxygen consumption and extracellular acidification rate with the Seahorse technology ... 41
2.2.6. Determination of cytokines by ELISA ... 41
3. Results
... 423.1. Characterization of human CD8 T cells ... 42
3.1.1. Distribution and functional characterization of CD8 T cell subsets ... 42
3.1.2. Metabolic characteristics of CD8 T cell subsets ... 47
3.2. Nutrient restriction in CD8 T cells - Characterization of CD8 T cell subsets under nutrient restriction ... 48
3.3. The role of glutamine metabolism in human CD8 T cells ... 54
3.3.1. Glutamine is essential for CD8 T cells, but low concentrations are sufficient to maintain effector functions ... 54
IV
3.3.2. Biosynthetic precursors and other amino acids are not able to substitute for
glutamine ... 59
3.4. Anti-metabolic targeting to restore immune cell effector functions of human CD8 T cells in the tumor microenvironment ... 61
3.4.1. Pharmacologic blockade of glutamine metabolism in human CD8 T cells ... 62
3.4.2. Pharmacological blockade of glucose metabolism by MCT inhibitors - Impact of NSAIDs on the function of human CD8 T cell subsets in the early phase of activation ... 65
3.5. Impact of MCT4 deficiency on T cell function ... 68
3.5.1. Immune cell composition in spleens from wildtyp and MCT4 deficient mice ... 69
3.5.2. Metabolic and functional characterization of murine MCT4-/- CD4 and CD8 T cells .. 71
3.6. Sorting through CD8 subsets: Which T cell subset is appropriate for adoptive immunotherapy in combination with anti-metabolic therapy? ... 76
3.6.1. Optimizing the expansion protocol of CD8 T cell subsets for adoptive T cell transfer 76 3.6.2. Impact of metabolic targeting on T cell function in expanded human CD8 T cell subsets ... 82
4. Discussion
... 854.1. Nutrient competition in the tumor microenvironment - does nutrient restriction blunt T cell function? ... 85
4.1.1. Functional and metabolic characteristics of human CD8 T cell subsets ... 85
4.1.1.1. Glucose metabolism and T cell function ... 85
4.1.1.2. The dependency on mitochondrial respiration is CD8 T cell subset specific ... 88
4.1.1.3. Glutamine is an essential substrate during T cell stimulation ... 90
4.2. Impact of drugs targeting tumor metabolism on human CD8 T cells ... 93
4.2.1. Impact of pharmacologic blockade of glutamine metabolism in CD8 T cells ... 93
4.2.2. Targeting glycolysis via inhibition of MCT1 and MCT4 in T cells ... 94
4.2.3. Impact of anti-metabolic targeting on T cell function in expanded CD8 T cell subsets in the context of immunotherapeutic approaches ... 98
4.3. Perspectives: The potential of metabolic targeting to support immunotherapy ... 100
V
5. Summary
... 1026. Zusammenfassung
... 1057. References
... 108Publications
... 130Acknowledgment
... 132VI
List of figures
Figure 1: Model of the differentiation process of CD8 T cell subsets in humans and their
relationship with functional attributes. ... 4
Figure 2: Pathways linked to glutamine metabolism.. ... 11
Figure 3: Metabolic hallmarks of tumor cells and the interplay between tumor cells and immune cells, according to Renner et al. 2017 ... 15
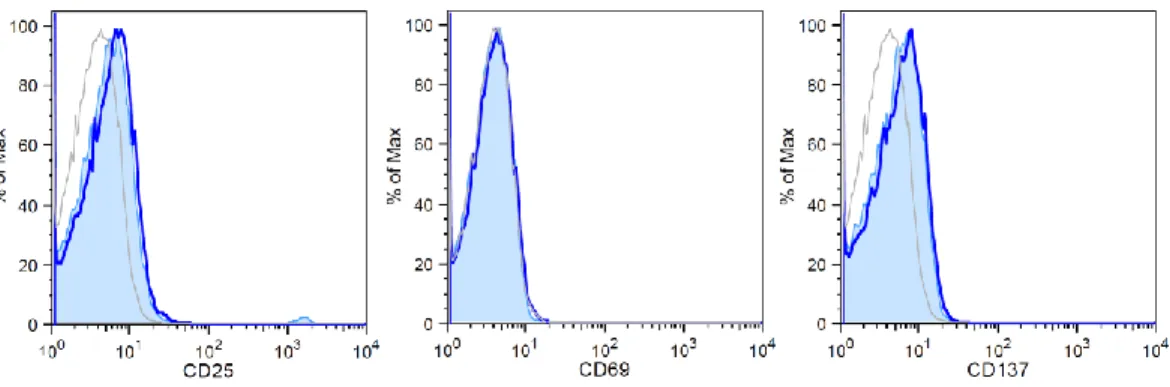
Figure 4: Analysis of the inactive state of CD8 T cells after overnight storage.. ... 33
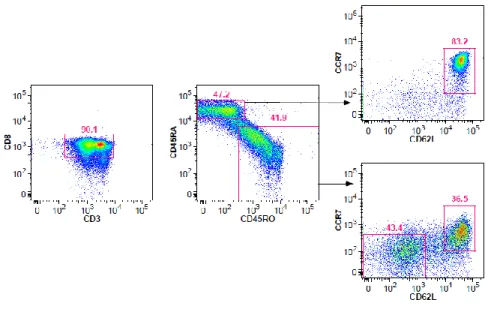
Figure 5: Purity of CD8 T cell subsets was confirmed by reanalysis after fluorescence activated cell sorting ... 39
Figure 6: Staining of surface markers associated with differentiation state of CD8 T cell subsets ... 43
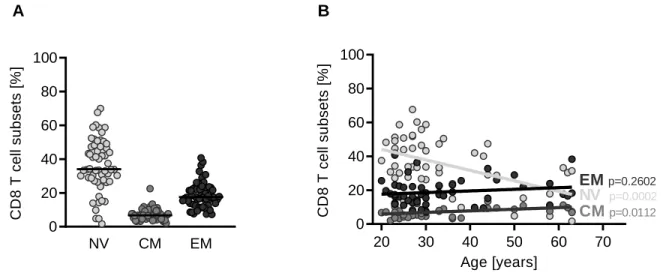
Figure 7: Distribution of naïve, CM and EM subsets in bulk CD8 T cells. ... 44
Figure 8: Relation between IFNγ secretion and T cell subset distribution in bulk CD8 T cells .... 44
Figure 9: Cytokine secretion of CD8 T cell subsets. ... 45
Figure 10: Proliferation of CD8 T cell subsets. ... 46
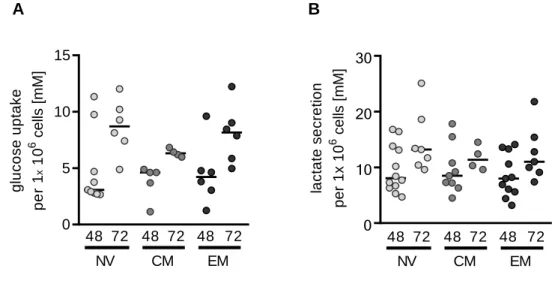
Figure 11: Glycolytic activity of CD8 T cell subsets.. ... 47
Figure 12: Mitochondrial respiration of CD8 T cell subsets.. ... 48
Figure 13: Impact of nutrient restriction on viability of CD8 T cell subsets... 49
Figure 14: Impact of nutrient restriction on glycolysis in human CD8 T cell subsets.. ... 50
Figure 15: Impact of nutrient restriction on mitochondrial respiration of CD8 T cell subsets.. ... 50
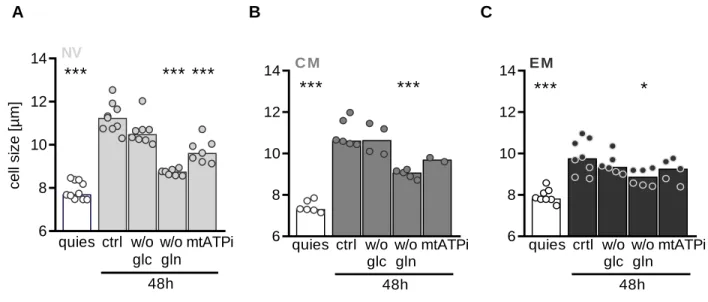
Figure 16: Impact of nutrient restriction on increase in cell size in CD8 T cell subsets.. ... 51
Figure 17: Impact of nutrient restriction on cytokine production of CD8 T cell subsets. ... 52
Figure 18: Impact of nutrient restriction on proliferation of CD8 T cell subsets.. ... 53
VII
Figure 19: Impact of glutamine concentration on metabolic activity in human bulk CD8 T cells..55
Figure 20: Impact of glutamine concentration on T cell function in human bulk CD8 T cells ... 56
Figure 21: Glutamine is required in the whole course of stimulation. ... 57
Figure 22: Impact of glutamine deprivation on mTOR activity in human bulk CD8 T cells. ... 58
Figure 23: Exogenous addition of metabolites directly linked to glutamine metabolism is not able to substitute for glutamine. ... 60
Figure 24: GLUL is expressed in myeloid cells, but not in CD8 T cells. ... 61
Figure 25: Impact of pan-inhibition on glutamine metabolism in comparison to specific glutaminase inhibition on respiration.. ... 64
Figure 26: Impact of NSAIDs on glycolytic activity of CD8 T cell subsets.. ... 66
Figure 27: Impact of NSAIDs on T cell function in CD8 T cell subsets.. ... 67
Figure 28: Immunoblot analysis of MCT4 expression in murine CD4 and CD8 T cells. ... 68
Figure 29: MCT4 deficiency does moderately alter immune cell composition in spleens ... 70
Figure 30: MCT4 deficiency has no impact on glycolytic activity in CD4 and CD8 T cells. ... 71
Figure 31: MCT4 deficiency does not affect mitochondrial mass, but has an impact on respiration. ... 72
Figure 32: MCT4 deficiency has no impact on cytokine production in CD4 and CD8 T cells. ... 73
Figure 33: MCT4 deficiency only moderately affects T cell function in CD4 and CD8 T cells, even in combination with MCT1/2 inhibition.. ... 74
Figure 34: Diclofenac shows a comparable effect on lactate production and IFNγ secretion as a combined blockade of MCT1, MCT2 and MCT4 in CD4 and CD8 T cells. ... 75
Figure 35: Impact of various stimulation methods on proliferation and viability of CD8 T cell subsets. ... 78
Figure 36: Impact of different stimulation methods on the expression of CCR7 in CD8 T cell subsets.. ... 79
VIII
Figure 37: Impact of different stimulation methods on the expression of CD62L in CD8 T cell subsets ... 80 Figure 38: Impact of various stimulation methods on effector functions of CD8 T cell subsets.. . 81
IX
List of tables
Table 1: Antibodies for western blotting ... 27
Table 2: Anti-human antibodies for flow cytometry ... 28
Table 3: Anti-mouse antibodies for flow cytometry ... 29
Table 4: Other antibodies and dyes for flow cytometry ... 29
Table 5: Antibodies used for fluorescence activated cell sorting with used volume for 10 x 106 cells ... 39
Table 6: Average IFNγ and TNF production of CD8 T cell subsets. ... 46
Table 7: Impact of pan-inhibition of glutamine metabolism in comparison to glutaminase inhibition on T cell function. ... 63
Table 8: Impact of metabolic inhibition on T cell function in CD8 T cell subsets after expansion ... ..83
X
List of abbreviations
2-DG 2-deoxyglucose
2-NBDG (2-(N-(7-nitrobenz-2-oxa-1,3-diazol-4-yl)amino)-2-deoxyglucose 7AAD 7-amino-actinomycin D
acivicin ((2S)-amino-(5S)-3-chloro-4,5-dihydro-1,2-oxazol-5-yl ethanoic acid) ACT adoptive cell transfer
AKT v-akt murine thymoma viral oncogene homolog 1 AMPK 5' AMP-activated protein kinase
ANOVA analysis of variance APC allophycocyanin APC antigen presenting cell APS ammonium persulfate ARG arginase
ATP adenosine triphosphate
BPTES (bis-2-(5-phenylacetamido‑1,2,4‑thiadiazol‑2‑yl) ethyl sulfide) BSA bovine serum albumine
BV brilliant violet
CAR chimeric antigen receptor CCL4 CC chemokine ligand 4 CCR7 C-C chemokine receptor CD cluster of differentiation
CM central memory
CO2 carbon dioxide COX cyclooxygenase CTL cytotoxic T cell
CTLA-4 cytotoxic T lymphocyte associated protein 4 ctrl control
Cy cyanine
DC dendritic cell
ddH2O double-destilled water dic diclofenac
DMSO dimethylsulfoxide DNA deoxyribonucleic acid
XI
DON 6-diazo-5-oxo-L-norleucine ECAR extracellular acidification rate ECL enhanced chemiluminescence EDTA ethylene diamine tetraacetate EFF effector T cell
ELISA enzyme-linked immunosorbent assays EM effector memory
EMRA effector memory cell expressing CD45RA ERK extracellular signal-regulated kinase FASL Fas ligand
FACS fluorescence activated cell sorting FCS fetal calf serum
FITC fluorescein isothiocyanate Fox forkhead box
FSC forward scatter
GAPDH glycerinaldehyde 3-phosphate dehydrogenase GCL glutamate cysteine ligase
GDH glutamate dehydrogenase
glc glucose
gln glutamine
GLS glutaminase
GLUL glutamine synthetase GLUT glucose transporter
GM-CSF granulocyte macrophage colony-stimulating factor GOT glutamic-oxaloacetic transaminase
GSH glutathione
H2O2 hydrogen peroxide
HBSS Hank’s balanced salt solution HCl hydrochloric acid
HIF1α hypoxia-inducible factor 1-alpha
HK hexokinase
HRP horse raddish peroxidase
IC50 half maximal inhibitory concentration IDO indolamine 2,3-dioxygenase
XII
KRAS v-Ki-ras2 Kirsten rat sarcoma viral oncogene homolog IFNγ interferon γ
IL interleukin
JAK-STAT janus kinase-signal transducer and activator of transcription JNK c-Jun N-terminal kinase
Ki inhibitory constant
KLRG1 killer cell lectin-like receptor LDH lactate dehydrogenase LPS lipopolysaccharide lum lumiracoxib
MCT monocarboxylate transporter mDC mature dendritic cell
MDSC myeloid-derived suppressor cell
met metformin
MFI mean of fluorescence
MHC major histocompatibility complex MLR mixed lymphocyte reaction MNC mononuclear cell
MTA methylthioadenosine mtATPi oligomycin
mTOR mechanistic target of rapamycin
mTORC1 mechanistic target of rapamycin complex 1 NAD nicotinamide adenine dinucleotide
NFAT nuclear factor of activated T cells NF-kB nuclear factor κB
NK natural killer cell NKT natural killer T cell
no number
NSAID nonsteroidal anti-inflammatory drug
NV naïve
O2 oxygen
OCR oxygen consumption rate OXPHOS oxidative phosphorylation
p38MAPK p38 mitogen-activated protein kinase
XIII
PB pacific blue
PBS phosphate buffered saline PD programmed cell death protein Pe phycoerythrin
PGE prostaglandine
PMA phorbol-12-myristat-13-acetate ROS reactive oxygen species rpm rounds per minute SCM stem cell memory T cell SEM standard error of the mean SSC sideward scatter
TCA tricarboxlic acid cycle TCR T cell receptor
TGF tumor growth factor Th T helper cell
TIL tumor infiltrating lymphocyte TNF tumor necrosis factor
TRAIL TNF-related apoptosis-inducing ligand Treg regulatory T cell
w/o without
1
1. Introduction
1.1. The human immune system
The human immune system is classified into two branches: the innate (non-specific) and the adaptive (specific) immune system. Innate immunity (also called natural or native immunity) provides the early line of defense against microbes. In addition to physical barriers and the complement system (Sarma and Ward 2011) different immune cell populations are important components of the innate immune response as phagocytic cells (neutrophils, macrophages), dendritic cells (DC) and natural (NK) cells.
The immune cell populations can be categorized into either the myeloid or the lymphoid lineage. Besides macrophages, monocytes, DCs and granulocytes belong to the myeloid cells.
Granulocytes consist of eosinophils, basophils and neutrophils, which secret vesicles, containing enzymes such as lysozymes and other molecules lethal to pathogens. Macrophages and DCs take up antigens, process them and present them to immune cells from the adaptive immune system. These so called professional antigen presenting cells (APCs) serve as an important link between the innate and the adaptive immune system.
Unlike the innate immune system, the adaptive immune system is highly specific to a particular pathogen and develops during a person’s lifetime. Moreover, immunological memory is created after an initial response to a specific pathogen and leads to an enhanced and faster immune response in case of a reinfection. The adaptive immune system consists of lymphocytes, B and T cells, and their secreted products such as antibodies or cytokines. These two cell types as well as NK cells belong to the lymphoid lineage.
T cells and NK cells play a major role in the defense against virally infected cells. Both secrete cytokines and chemokines driving and modulating the immune response (Caligiuri 2008). In the context of the anti-tumor immune response T cells are of special importance as they are able to directly kill tumor cells beside cytokine secretion.
1.2. T cell differentiation and maturation
T cells play a central role in cell mediated immune responses. Derived from hematopoietic stem cells in the bone marrow, progenitor T cells migrate to the thymus for maturation. Within the thymus developing T cells, referred to as thymocytes, undergo several selection processes.
Introduction
2
By positive selection the cells acquire the capability to recognize foreign antigens. A negative selection process ensures T cells to maintain self-tolerance by eliminating progenitors with receptors binding to self-antigens. After maturation T cells express the T cell receptor (TCR) and either the cluster of differentiation (CD) 4 or CD8 co-receptor on the cell surface. The TCR binds to peptides presented by major histocompatibility complex (MHC) molecules (Moss et al. 1992).
MHCs interacting with T cell receptors are divided into two major forms, class I (MHC I) and class II (MHC II) molecules.
Class II molecules are expressed by professional APCs (Doyle and Strominger 1987). APCs ingest exogenous antigens in the periphery, process them into peptides and present them as epitopes via MHC II molecules on their surface. Suchlike activated APCs migrate to lymphatic organs, where the epitopes are recognized by specific CD4 T cells. Within the CD4 T cell compartment, four major populations can be distinguished: The T helper (Th) cell lineages Th1, Th2, Th17 and the regulatory T (Treg) cells (Zhu and Paul 2008). Helper T cells secrete cytokines and chemokines that activate and/or recruit other immune cell types. Th1 and Th2 cells are known as effector CD4 T cells. Th1 cells are triggered by interleukin (IL)-12 and secrete predominantly the cytokines IL-2 and interferon (IFN) γ (Zhu and Paul 2008). IL-2 stimulates survival, proliferation and differentiation of activated T cells. IFNγ, discussed more into detail in chapter 1.3.2, is critical for macrophage activation and upregulation of MHC II molecules. Th2 cells are stimulated by IL-2 and IL-4 and are characterized by a secretion of a broad range of cytokines as, among others, IL-4, IL-5 and IL-10 (Zhu and Paul 2008). IL-4 is a stimulatory factor for Th2 differentiation and serves as a positive feedback amplifier. Moreover it promotes, similar to IL-5, proliferation of B and T cells. IL-10 is an anti-inflammatory, immunosuppressive cytokine, as it downregulates MHC II expression for instance. Th17 cell differentiation is induced by tumor growth factor (TGF)-ß and IL-6, IL-21 and IL-23. This pro-inflammatory population produces IL-17 and IL-21 (Zhu and Paul 2008). IL-17 promotes secretion of chemokines recruiting other immune cells to sites of inflammation. IL-21 acts as a stimulatory factor in a positive feedback loop. Tregs characterized by expression of CD25 and forkhead box protein 3 (FoxP3) are important immunosuppressive cells releasing IL-10 and TGF-β (Zhu and Paul 2008). Within this group naturally occurring, generated in the thymus or at peripheral sites, and in cell culture TGF-ß induced Tregs can be distinguished (Shevach and Thornton 2014). TGF-ß is essential for the differentiation of naïve CD4 T cells to Tregs and maintains homeostasis of this population.
MHC I molecules interacting with CD8 as a co-receptor (Salter et al. 1990) are expressed by platelets and nearly all nucleated cells. Molecules presented by MHC class I are cytosolic proteins degraded in the proteasome and transported to the cell surface. Foreign or mutated
3
peptides are presented by MHC I molecules to other cells. Therefore CD8 T cells have an important role in the anti-tumor immunity by recognizing mutated cells (Hadrup et al. 2013). Due to this fact, this work is focused on CD8 T cells which will be further highlighted in the following chapters.
1.3. Human CD8 T cells
1.3.1. Differentiation of human CD8 T cells
Human CD8 T cells can be grouped into various subsets based on their antigen experience, function and molecular phenotype (Figure 1). Major subsets circulating in the blood are classified into naïve (NV) T cells and antigen-experienced populations such as central memory (CM) and effector memory (EM) T cells. These subsets are distinguished on the basis of differential expression of surface molecules, including splice variants of CD45, the lymph-node homing receptors CCR7 (C-C chemokine receptor 7) and CD62L (L-selectin) (Sallusto et al. 1999).
CD45, a protein tyrosine phosphatase exclusively expressed on cells of the hematopoietic lineage, is the most abundant leukocyte cell surface marker and plays a key role in TCR signal transduction (Tonks et al. 1988; Trowbridge and Thomas 1994). Different isoforms of CD45 are generated by alternative splicing and are expressed in cell type specific patterns on functional subsets of lymphocytes. CD45RA is found on naïve T cells as well as on a group of effector cells (EMRA T cells). After binding to the respective antigen, central and effector memory T cells lose expression of CD45RA and gain expression of CD45RO.
CCR7 and CD62L are lymphocyte homing receptors expressed on naïve and CM cells in order to track them to secondary lymphoid organs (Picker et al. 1993). In line, lack of those receptors on effector memory and effector T cells triggers migration of these subsets in peripheral regions of the body where they are recruited by chemokines into inflammatory sites.
However, all three T cell subsets are present in peripheral and lymphoid tissues.
Introduction
4
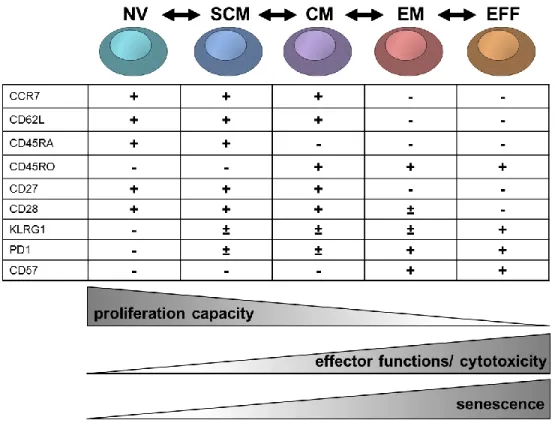
Figure 1: Model of the differentiation process of CD8 T cell subsets in humans and their relationship with functional attributes. According to Appay et al. 2008, Larbi and Tamas 2014 and Mahnke et al. 2013. CD8 subsets of circulating CD8 T cells are mainly defined according to differential expression of CCR7, CD62L, CD45RO and CD45RA. These markers change when T cells differentiate from one subset to another. Upon T cell differentiation CD8 T cells downregulate the expression of CD27 (IL-7 receptor) and CD28 (co-stimulatory receptor) and upregulate the expression of KLRG1 (killer cell lectin-like receptor-1), PD1 (programmed cell death protein 1) and CD57 (function unknown, marker for senescence). Moreover CD8 T cells lose their proliferation capacity, but acquire specific effector functions. NV: naïve T cells; SCM: stem cell memory T cells; CM: central memory T cells; EM: effector memory T cells; EFF: effector T cells.
The lineage relationship and specific phenotype of CD8 T cell subsets is still a subject of controversy in the field (Mahnke et al. 2013). After antigen exposure in the lymph nodes naïve T cells undergo proliferative expansion, differentiate into antigen experienced T cell subsets and end up as terminally differentiated effector T cells (Figure 1). CM T cells are long-lived memory cells capable to differentiate into shorter-lived EM upon antigen stimulation (Sallusto et al. 2004).
Other studies propose the other way around, claiming that EM convert to CM (Wherry et al.
2003). The EM and EFF subsets seem to display a more exhausted phenotype indicated by reduced proliferative capacity and the expression of proposed senescence/ exhaustion markers such as CD57, killer cell lectin-like receptor-1 (KLRG1) and programmed cell death protein 1
5
(PD1) (Larbi and Tamas 2014). Moreover, the loss of the co-receptors CD27 and/ or CD28 is regarded as a characteristic for exhausted T cells.
Lately, a population of memory T cells has been defined, which has enhanced stem cell-like qualities compared to conventional CM T cells and an enhanced capacity for self-renewal. This cell type was designated memory stem T cells (SCM) (Gattinoni et al. 2011).
While CD4 Tregs are an accepted population, studies on human CD8 Tregsare rather sparse (Kapp and Bucy 2008). Patients with a leishmanial infection showed CD8 with an immunosuppressing phenotype (Holaday et al. 1993). A minor population of FoxP3 expressing CD8 T cells was detected in rheumatoid arthritis displaying superior regulatory abilities and inhibiting Th17 response (Ellis et al. 2014). A CD8, LAG-3, CD25, FoxP3, CCL4 expressing Treg subset may play a role in immunoregulation in humans through the secretion of CC chemokine ligand 4 (CCL4), which can inhibit T cell activation (Joosten et al. 2007).
1.3.2. CD8 T cells as key players in the immune response
CD8 T cells, also named cytotoxic T lymphocytes (CTL), are very important for the immune defense against intracellular pathogens such as viruses as well as for tumor immune surveillance. For a proper T cell stimulation various signals are required including antigen recognition by the TCR and secondary activating stimuli. The TCR complex is composed of two highly variable chains, the α- and the β-chain interacting with the antigens, the CD3 molecule and two ζ-chains mediating signal transduction. The CD8 co-receptor also binds to MHC I leading to a stabilization of the whole complex. Another required co-receptor, CD28, receives a co-stimulatory signal by binding to B7-1 (CD80) and B7-2 (CD86) on APCs. Besides cell to cell interaction leading to stimulation, cytokines support and enhance T cell stimulation and activation. The most important cytokine is IL-2. IL-2 is produced mainly by CD4 T cells and acts in an auto- and paracrine fashion.
After activation CD8 T cells secrete cytokines, primarily IFNγ and tumor necrosis factor (TNF), which have anti-tumor, immunoregulatory and anti-viral effects. IFNγ activates the Janus kinase- signal transducer and activator of transcription (JAK-STAT) signaling pathway in macrophages (Schroder et al. 2004). The JAK-STAT pathway targets gene promoters in the nucleus triggering anti-viral and adaptive immune responses (Aaronson and Horvath 2002). One well described effect of IFNγ is the inhibition of cell growth, even of tumor cells (Jonasch and Haluska 2001).
This effect could be linked to the capability of IFNγ to upregulate the expression of MHC class I and II molecules (Propper et al. 2003; Schroder et al. 2004), which could result in a better
Introduction
6
recognition by other immune cells. Moreover IFNγ orchestrates the recruitment of specific immune cells to sites of inflammation by upregulation of adhesion molecules and chemokines (Boehm et al. 1997). Besides its impact on cells of the adaptive immune system, IFNγ also triggers the innate immune response. Macrophages activated by IFNγ display increased pinocytosis and phagocytosis as well as enhanced microbial killing ability (Schroder et al.
2004).TNF triggers five different types of signals includingnuclear factor κB (NF-κB) activation, extracellular signal-regulated kinase (ERK), p38 mitogen-activated protein kinase (p38MAPK) and c-Jun N-terminal kinase (JNK) (Aggarwal et al. 2012). TNF binds also to the TNF-related apoptosis-inducing ligand (TRAIL). This pathway induces apoptosis in tumor cells but not in normal cells (Wiley et al. 1995).
Moreover, CD8 T cells are capable to directly lyse cells by release of cytotoxic proteins (Peters 1991). The pore-forming protein perforin is released to facilitate granzyme influx into the target cell. Granzymes are serine proteases and cause cell death in any type of target cell.
Granzyme B is the most powerful pro-apoptotic member and induces apoptosis by both caspase mediated and caspase independent pathways (Trapani 2001).
Another important mechanism how CD8 T cells kill target cells, is the binding of Fas (CD95) on their targets by the Fas ligand (FasL, CD95L) (Waring and Müllbacher 1999). This binding induces cell death mediated by caspase activation (Waring and Müllbacher 1999).
Due to their specificity and cytotoxic capability CD8 T cells comprise a powerful branch of the adaptive immune response. Regarding the ‘tumor-specific adaptive immune response’ tumor infiltrating CD8 cells have been shown to be of major importance in different types of solid tumors, including renal, ovarian, colorectal and lung cancer (Nakano et al. 2001; Sato et al.
2005; Galon et al. 2006; Kawai et al. 2008). A meta-analysis of expression signatures of 18.000 human tumors has confirmed that infiltration and activation of CD8 T cells is linked to improved patient outcome in different cancer types (Gentles et al. 2015). However, they also frequently fail to induce a sufficient anti-tumor immune response. Despite the lack of antigens and the expression of inhibitory surface markers, so called checkpoint molecules as cytotoxic T lymphocyte associated protein 4 (CTLA-4) or PD-1, which will be more elucidated later on, one reason might be their high metabolic demands upon activation and interplay with the specific metabolic tumor microenvironment.
7
1.3.3. Metabolism of T cells – a link between metabolism and effector functions?
In the resting state T lymphocytes cover their basal energy demand primarily through mitochondrial oxidation of glucose and glutamine (Bental and Deutsch 1993; Jones and Thompson 2007). Stimulation of T cells leads to a change from a resting towards an activated state. T cell activation requires metabolic reprogramming supporting their highly proliferative and biosynthetic phenotype (Frauwirth et al. 2002). During T cell activation and differentiation key metabolic processes such as glycolysis, mitochondrial respiration and fatty acid oxidation are recognized as crucial pathways (MacIver et al. 2013).
The metabolic reprogramming upon T cell activation is regulated on both the transcriptional and posttranscriptional level. Several studies have implicated the involvement of different signaling cascades such as 5' AMP-activated protein kinase (AMPK), AKT and mechanistic target of rapamycin (mTOR) in regulating T cell metabolism (Frauwirth et al. 2002; Pearce et al.
2009; Carr et al. 2010; Xu et al. 2012; Finlay and Cantrell 2011). Notably, those pathways are also known to be upregulated in cancer cells. Moreover, Wang and colleagues were able to show that metabolic genes involved in glucose and glutamine metabolism as well as mitochondrial biogenesis are regulated by the oncogene c-myc in murine T cells (Wang et al.
2011). Deletion of myc significantly impaired glycolytic flux and inhibited the upregulation of glutamine oxidation in active T cells. Myc, but not hypoxia-inducible factor 1-alpha (HIF1α) was required for activation-induced T cell metabolic reprogramming.
Pathways that control T cell function and cellular metabolism are linked and changes in cell metabolism can suppress or even enhance lymphocyte function (MacIver et al. 2013). As most of the publications are focused on murine T cells, it is of major importance to elucidate the role of metabolic pathways for CD8 T cell activation and function.
1.3.3.1. Glucose metabolism is strongly increased in activated T cells
Highly proliferating cells show an accelerated glucose metabolism, degrading most of the glucose into lactate, named aerobic glycolysis, first described in tumor cells by Otto Warburg (Warburg 1956). In contrast, non-proliferating cells metabolize glucose to pyruvate via glycolysis in the cytoplasm, which is subsequently oxidized to carbon dioxide (CO2) by oxidative phosphorylation (OXPHOS) in the mitochondria. A yield of 36 mol adenosine triphosphate (ATP) is gained by 1 mol of glucose by OXPHOS, whereas only 2 mol ATP are produced by glycolysis.
Nevertheless, the accelerated glycolytic flux rate and the rapid turnover of glucose allow cells to
Introduction
8
produce sufficient amounts of ATP and at the same time to use the intermediates of the tricarboxylic acid cycle (TCA) for the biosynthesis of molecules (Fox et al. 2005; Vander Heiden et al. 2009). Already during the 1960’s it has been shown that proliferating lymphocytes show an increased glucose metabolism (Cooper et al. 1963) and this phenomenon has regained attention during the last years.
After stimulation the expression of glycolysis associated genes is upregulated in human T cell populations. The expression of glycolytic enzymes and transporters such as the lactate dehydrogenase A (LDHA), the hexokinases (HK), the glucose transporter 1 (GLUT1) or the monocarboxylate transporter 1 (MCT1), responsible for lactate secretion is increased (Frauwirth et al. 2002; Macintyre et al. 2014; Renner et al. 2015). Accordingly, T cells show enhanced glucose uptake and lactate secretion in the course of stimulation. The increase in glucose metabolism has been reported in activated murine and human T cells. However, its impact on T cell function is still controversially discussed.
A strong link between glycolysis and effector functions as IFNγ production has been investigated in the murine system (Jacobs et al. 2008; Cham and Gajewski 2005; Macintyre et al. 2014). It has been reported that glycerinaldehyde 3-phosphate dehydrogenase (GAPDH) interferes with the translation of IFNγ in murine Th1 cells (Chang et al. 2013). Murine CD4 T cells lacking LDHA, an enzyme converting pyruvate to lactate, secret less IFNγ indicating that glycolysis promotes T cell effector functions (Peng et al. 2016). Therefore glycolytic enzymes could function as metabolic checkpoints by linking T cell effector functions to glucose availability.
However, another study showed that mitochondrial respiration is able to compensate for the lack of glucose to maintain IFNγ production in murine T cells (Salerno et al. 2016). Although cytokine production might require a glycolytic switch (Chang et al. 2013), glucose availability does not alter the rate of IFNγ production in murine T cells upon activation (Salerno et al. 2016).
Moreover, other effector functions such as IL-2 production or cytolytic activity appear not to depend on glucose in the murine system (Cham and Gajewski 2005; Sukumar et al. 2013).
In human T cells IFNγ, TNF and IL-2 secretion is if at all moderately affected by low glucose levels (Renner et al. 2015). Cytokine secretion seems to be preserved even under very low glucose conditions (0.4 mM) (Renner et al. 2015) suggesting minor importance of glycolysis for T cell function. In another study glucose deprivation caused only tentatively reduced secretions of IL‐2, TNF, IFNγ and IL‐4 in human CD4 T cells (Tripmacher et al. 2008). Nevertheless, rapid IFNγ production was shown to be linked to increased glycolytic flux in human memory T cells (Gubser et al. 2013). However, the link between metabolism and human T cell effector functions is still a matter of debate.
9
Regarding proliferation glucose is required for murine and human T cells. Under glucose deprivation T cell expansion is strongly impaired (Chang et al. 2013, Renner et al. 2015, Tripmacher et al. 2008). Glut1 deficient CD4 and CD8 T cells have an impaired capacity to proliferate in vitro and in vivo (Macintyre et al. 2014). Nevertheless, LDHA deficiency in murine CD4 T cells had no impact on proliferation (Peng et al. 2016). These results suggest the major importance of glucose but not glucose fermentation for proliferation in the murine system.
Interestingly, Glut1 deletion seemed to interfere also with CD4 T cell differentiation into Th1, Th2 and Th17 lineage, but differentiation into CD8 CTLs and CD4 Tregs were not affected (Macintyre et al. 2014).
1.3.3.2. Amino acids play an essential role in T cell activation and metabolism
Beside glucose, amino acids are regarded as key nutrients for activated T cells. It has been demonstrated that amino acids rather than glucose account for the majority of cell mass in proliferating mammalian cells, providing carbon and nitrogen to proliferating cells (Hosios et al.
2016). Amino acids fuel metabolic processes such as the TCA cycle (Newsholme et al. 2003b).
Moreover amino acids are used as biosynthetic precursors for protein and nucleic acid biosynthesis. Antigen signaling through the TCR increases the uptake of several amino acids, such as phenylalanine, leucine, arginine, serine, glutamate and glutamine into T cells (Carr et al.
2010; Sinclair et al. 2013; Geiger et al. 2016). Detailed studies on the importance of amino acids for T cell function have been performed lately.
Recent work reveals that serine metabolism is enhanced in activated T cells. Serine is required for optimal T cell expansion by fueling the one-carbon metabolism and nucleotide biosynthesis (Ma et al. 2017). In addition, enzymes required for the transport or the conversion of arginine into downstream metabolites like ornithine or proline are upregulated in activated T cells. In the absence of arginine, T cells showed a reduced capacity to proliferate, impaired activity and decreased cytokine secretion (Choi et al. 2009). T cells with increased intracellular levels of arginine shift their metabolism from glycolysis to OXPHOS and display enhanced survival as well as anti-tumor activity, which is linked to the generation of CM T cells (Geiger et al. 2016).
Nevertheless, glutaminolysis plays a crucial role in T cell activation. Glutamine is with a concentration range between 550–750 µM the most abundant amino acid in the peripheral blood (Gleeson 2008). The degradation of glutamine provides precursors for the synthesis of other amino acids, proteins or nucleotides for instance (Dang 2010). When glutamine is oxidized into
Introduction
10
glutamate, glutamate may be metabolized to produce other amino acids or may be used as anaplerotic substrate to replenish TCA cycle (Newsholme et al. 2003a; Newsholme et al.
2003b). Glutamine is converted by the glutaminase (GLS) to glutamate and two isoforms can be distinguished: the kidney- and the liver-type glutaminase. Besides glutaminase, T cell activation coordinately enhances expression of enzymes associated with glutaminolysis as the glutamic- oxaloacetic transaminase (GOT) or the glutamate dehydrogenase (GDH) (Carr et al. 2010;
Sinclair et al. 2013). Subsequently, glutamate can be transformed into α-ketoglutarate by aminotransferases, transferring nitrogen to pyruvate or oxaloacetate to form aspartate or alanine, respectively. In turn α-ketoglutarate enters the TCA cycle to gain energy. Moreover, glutamate is one of the three building blocks of the antioxidant glutathione (GSH) which is comprised of three amino acids: cysteine, glutamate and glycine. GSH scavenges reactive oxygen species (ROS) and prevents thereby cellular damage. Specifically in T cells, it was shown that GSH is essential for the accelerated energy metabolism required for T cell effector functions (Mak et al. 2017). Moreover glutamine is essential for nucleotide synthesis as it acts as nitrogen donor in purine as well as in pyrimidine synthesis (Cory and Cory 2006).
Glutamine depletion blocked murine T cell growth, proliferation and cytokine production such as IFNγ and IL-2. Interestingly, this effect could not be rescued by substitution of biosynthetic precursors (proline or asparagine) or products (glutamate) of glutamine (Carr et al. 2010).
Glutamine deprivation in CD4 T cells resulted in reduced mechanistic target of rapamycin complex 1 (mTORC1) activity and led to a differentiation toward a Treg cell phenotype (Klysz et al. 2015). Metzler and colleagues demonstrated that the differentiation into Tregs induced by glutamine restriction is caused by an impaired glutamine dependent nucleotide synthesis (Metzler et al. 2016). Another study assigned Treg formation under glutamine restriction to an inhibited conversion of glutamate into α-ketoglutarate and thereby preventing the production of 2-hydroxyglutarate. The formation of 2-hydroxyglutarate was essential to reduce the methylation of the Foxp3 gene locus (Xu et al. 2017).
Taken together, glutamine is involved in a variety of pathways, summarized in Figure 2.
Although glutamine is generally not regarded as an essential amino acid, T cells seem to lack the ability to compensate for glutamine deprivation, even when other pathway intermediates are provided. However, it is still not clear which pathway glutamine is involved in and which one is crucial for T cell activation as providing different intermediates only partially rescues T cell activation.
11
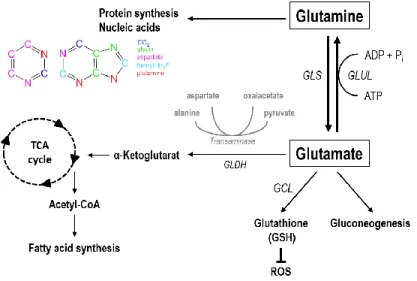
Figure 2: Pathways linked to glutamine metabolism. Glutamate is produced from glutamine through glutaminase (GLS). The reverse reaction is catalyzed by the glutamine synthetase (GLUL) producing glutamine from glutamate.
Glutamate can be used as an amino group donor for the transamination of other amino acids as aspartate or alanine and is converted to α-ketoglutarate via glutamate dehydrogenase (GLDH) which is a TCA intermediate. Glutamate is one of the three building blocks for the antioxidant glutathione which is synthesized by the glutamate cysteine ligase (GCL) and protects cells from reactive oxygen species (ROS).
1.3.3.3. Mitochondrial respiration in T cells
During the last years the importance of glucose and amino acids for T cell function has been studied intensively. Only recently mitochondrial involvement in T cell activation and function regained attention.
Oxidative metabolism was shown to be important for T cell response in the murine and the human system (Sena et al. 2013; Okoye et al. 2015; Desdín-Micó et al. 2017). For murine T cells mitochondrial mass increases during the first hours of activation (Baixauli et al. 2015; Tan et al. 2017) and Fischer and colleagues described the critical role of mitochondrial biogenesis for cytokine production in human CD8 T cells (Fischer et al. 2018). Moreover, genetic approaches by deletion of the mitochondrial transcription factor A (Tfam) (Baixauli et al. 2015) or the apoptosis inducing factor (AIF) (Milasta et al. 2016), both leading to defective mitochondrial respiration, caused a strong decrease in proliferation. Interestingly, Tfam deficient CD4 T cells showed increased numbers of IFNγ cells (Baixauli et al. 2015). Balmer and Hess have shown that dysfunction of mitochondrial respiration correlates with exhaustion in murine and human CD8 T cells (Balmer and Hess 2016). T cells which lost mitochondrial mass within the tumor microenvironment were characterized by a very low cytokine production in the murine and the human system (Scharping et al. 2016; Siska et al. 2017).
Introduction
12
Recently, Buck and colleagues reported that remodeling of mitochondria ultrastructure is critical for modulation of T cell differentiation into various subsets and moreover has an impact on anti-tumor immune response during adoptive cell transfer (ACT) (Buck et al. 2016). These findings suggest that activated T cells require not only glycolysis but also mitochondrial respiration for immune response. Therefore, the role of mitochondrial respiration has to be considered in light of the development of mitochondrial inhibitors for cancer therapy and needs further analysis.
1.3.3.4. Subset specific differences in the metabolic phenotype of T cells
Most of the studies on the link between T cell metabolism and function have been performed in bulk T cell cultures. Some publications indicate that the metabolic profile and the metabolic demands differ between T cell subsets. It has been proposed that murine CD8 memory T cells rely on lipid oxidation (Pearce et al. 2009; O'Sullivan et al. 2014). However, this finding is discussed controversially as in this study very high concentrations of etomoxir, an irreversible inhibitor of carnitine palmitoyltransferase-1 (CPT-1A), were applied (O'Sullivan et al. 2014), probably leading to unspecific side effects. In contrast, a complete CPT-1A knockout in CD8 T cells is dispensable for the development of CD8 T cell memory and protective immunity (Raud et al. 2018) . Nevertheless, memory differentiation involves oxidative phosphorylation and changes in mitochondrial structure, as over-expression of a protein promoting mitochondrial membrane fusion fosters the generation of memory T cells in vivo (Buck et al. 2016). Moreover, inhibiting glycolytic metabolism by 2-deoxyglucose (2-DG) enhances memory generation in murine CD8 T cells (Sukumar et al. 2013). The metabolic profile of activated T cell subsets has been less investigated. Ecker and colleagues recently reported that IFNγ production is glucose sensitive in naïve and CM CD4 T cells (Ecker et al. 2018). Similar data have been shown for CD4 EM T cells (Dimeloe et al. 2016). In line, Gubser and colleagues showed that the accelerated effector functions of human CD8 memory T cells but not of naïve T cells is glycolysis dependent (Gubser et al. 2013). Nevertheless, it has to be taken into consideration, that those analyses have been performed in the absence of serum, which is regarded as a crucial factor for T cell activation.
Taken together T cells have a high metabolic demand. Therefore, the metabolic conditions in the tumor microenvironment could contribute to diminished anti-tumor immune responses probably in a subset dependent manner.
13
1.4. Impact of tumor metabolism on tumor infiltrating immune cells
Tumor cells are characterized by an altered and highly elevated metabolism in comparison to normal cells. Tumor cells reprogram and accelerate pathways including nutrient up-take and degradation in order to meet their bioenergetic, biosynthetic and redox demands. The resulting metabolic tumor microenvironment actively influences the surrounding tissue and the behavior of surrounding cells. Low nutrient levels and the accumulation of metabolites in the tumor microenvironment, produced and released by tumor cells themselves or stromal cells inside the tumor, mediate tumor promotion, invasion and metastasis (Hanahan and Coussens 2012).
The tumor microenvironment is hostile to T cells in many perspectives and many different mechanisms contribute to the failure of T cells to eradicate tumor cells. Nutrient supply is limited due to the highly elevated metabolic activity of tumor cells but also other stroma cells in the tumor microenvironment. As T cells undergo metabolic reprogramming upon stimulation to support their cell growth and effector functions, the need for nutrients is likewise elevated. This leads to a competition for nutrients between tumor cells and stroma cells including tumor infiltrating lymphocytes (TILs).
The classical example of a reprogrammed metabolic pathway in cancer is the accelerated aerobic glycolytic activity even in the presence of oxygen, the already mentioned Warburg effect (Warburg et al. 1927; Warburg 1956). As glucose is rapidly taken up by proliferating tumor cells, TILs are exposed to lowered extracellular glucose concentrations. Glucose consumption by tumor cells might metabolically restrict T cells by leading to decreased mTOR activity, glycolytic capacity and reduced effector functions (Chang et al. 2015). Ho and colleagues identified a mechanism by which glucose metabolism directly controls effector functions. Due to lowered phosphoenolpyruvate concentrations by glucose deprivation, calcium and nuclear factor of activated T cells (NFAT) signaling was suppressed, resulting in diminished anti-tumor effector functions. Nevertheless, glucose seems not to be the main restricting substrate for T cells within tumors, since in most human tumor entities an average glucose concentrations above 1 mM has been measured (Walenta et al. 2017), which has been shown to be sufficient for T cell function (Renner et al. 2015).
Besides glucose, amino acids are crucial for tumor growth (Mayers and Vander Heiden 2015;
Altman et al. 2016). Many oncogenic mutations are associated with the glutamine metabolism (Altman et al. 2016). Glutamine metabolism was shown to be linked to mTORC1, and the oncogenes KRAS, MYC and p53 (Choi and Park 2018).
Introduction
14
A variety of amino acids as glutamine, arginine, tryptophan or other amino acids are highly consumed by various tumor cell types as they are essential nutrients for tumor growth.
Accordingly, Pan and colleagues showed that glutamine concentrations were consistently and significantly lower in tumor core regions (less than 100 µM) compared to the tumor periphery (about 400 µM) (Pan et al. 2016). Moreover, higher gene expression of enzymes involved in glutaminolysis are correlated with poor survival as shown in patients with ovarian cancer (Yang et al. 2014). Others demonstrated that glutamine is an important metabolite to drive tumor growth and metastasis (Zhang et al. 2014). In addition, asparagine and arginine levels correlate with tumor growth (Patil et al. 2016; Knott et al. 2018) and lowered levels of arginine are found in the tumor microenvironment (Rodriguez et al. 2009). Arginine is used by tumor cells but also other immune cells as T cells or myeloid-derived suppressor cells (MDSCs) (Renner et al. 2017).
In addition, degradation of arginine by arginase secreted by MDSCs inside the tumor results in an impaired T cell responsiveness (Bronte and Zanovello 2005; Fletcher et al. 2015).
As amino acid metabolism is also important for activated T cells and other immune cells such as macrophages found in the tumor stroma, amino acid concentrations might become limiting in the tumor microenvironment (Renner et al. 2017).
Despite nutrient restriction, the secretion of metabolites formed in the course of glycolysis or amino acid degradation contributes to an immunosuppressive microenvironment. Highly glycolytic tumor cells need to efficiently export lactate to maintain glucose flux. The lactate export by the MCTs is proton-linked (Halestrap and Wilson 2012), which results in lactate accumulation and concomitantly a decrease in the extracellular pH inside the tumor. It was shown that tumor derived lactic acid suppresses proliferation and cytokine production of human cytotoxic T cells in vitro and in vivo, hence is regarded as an immunosuppressive metabolite (Fischer et al. 2007; Calcinotto et al. 2012; Mendler et al. 2012). In line, Cascone and colleagues demonstrated that increased tumor glycolysis is associated with a lower therapeutic response to adoptive T cell transfer due to suppression of anti-tumor immunity (Cascone et al. 2018).
Moreover, tryptophan degradation results in the production and secretion of kynurenine regarded as an immunosuppressive metabolite (Frumento et al. 2002; Uyttenhove et al. 2003;
Fallarino et al. 2006). Additionally, the adenosine metabolism is regarded as a possible pathway harming immune cell response in the tumor microenvironment. An upregulated expression of an ecto-5′-nucleotidase (CD73) was shown to result in adenosine production, affecting T and NK cells (Huang et al. 1997; Häusler et al. 2011). The accumulation of methylthioadenosine (MTA) caused by the loss of methylthioadenosine phosphorylases impairs T cell function (Henrich et al.
15
2016). Other waste products as prostaglandin E2 (PGE2) are also known as immunosuppressive metabolite (Kalinski 2012).
Taken together, the metabolic microenvironment in tumors has a strong impact on a T cell mediated anti-tumor immune response. On the one hand a competition for nutrients is observed, on the other hand the secretion of immunosuppressive metabolites impairs T cell function (Figure 3).
Figure 3: Metabolic hallmarks of tumor cells and the interplay between tumor cells and immune cells, according to Renner et al. 2017. Tumor cells exhibit high expression of glucose transporters (GLUT), lactate dehydrogenase (LDH), cyclooxygenase (COX), arginase (ARG), indolamine 2,3-dioxygenase (IDO), glutaminase (GLS), and oxidative phosphorylation (OXPHOS). As a consequence, glucose and the amino acids arginine, tryptophan, and glutamine are depleted from the tumor microenvironment and nutrient restriction contributes to an anergic state of anti-tumoral cytotoxic T cells. In addition, accelerated glycolysis by tumor cells results in lactate production and secretion via monocarboxylate- transporters (MCT). Lactate and other secreted metabolites, such as glutamate, prostaglandins (PGE2), and kynurenines, affect immune cells. Overexpression of the ecto-5′-nucleotidase (CD73) leads to adenosine formation; loss of methylthioadenosine phosphorylase (MTAP) results in methylthioadenosine (MTA) accumulation in the tumor environment.
1.5. State of the art: Targeting the tumor metabolism as an emerging strategy in cancer therapy
Targeting and thereby restricting tumor metabolism could be an interesting strategy in different perspectives; (i) metabolic restriction affects proliferation and viability of tumor cells and (ii) blocking metabolic pathways reduces the secretion of immunosuppressive metabolites.
During the past decades targeting cancer metabolism has emerged as a promising strategy and selective drugs, targeting glucose metabolism, mitochondrial activity or glutaminolysis have been developed.
As tumor cells and immune cells show overlaps in their metabolic profile it will be a major challenge to develop protocols affecting tumor cell metabolism but preserving immune cell function. This is of special importance, since an effective anti-tumor immune response is known
Introduction
16
to positively affect patient outcome (Galon et al. 2006). Therefore it is essential to understand this link and the metabolic demand in T cells which is required for a successful immune response.
A huge variety of drugs has been developed during the last years targeting different metabolic pathways. While initial studies have mainly focused on glucose metabolism, it is now clear that inhibiting mitochondrial function is another emerging approach (Tennant et al. 2010).
Besides glycolysis and OXPHOS, amino acid metabolism has also been considered as a target of cancer therapy (Altman et al. 2016).
1.5.1. Targeting glucose metabolism as a promising concept for anti-tumor therapy
Glucose metabolism can be targeted at different levels. As glucose enters cells via specific transporters several inhibitors for glucose transporters have been developed and clinical trials are ongoing to test toxicity and efficacy (Cao et al. 2007; Zhan et al. 2011). An alternative strategy for inhibiting glucose metabolism relies on the inhibition of glycolytic enzymes.
Compounds such as the glucose analog 2-DG or 3-bromopyruvate (HK), lonidamine (pyruvate kinase M2 and hexokinase), gossypol (LDH), dichloroacetate (pyruvate dehydrogenase kinase) are able to inhibit glucose catabolism and are currently tested in clinical trials (Yu et al. 2001; Di Cosimo et al. 2003; Maschek et al. 2004; Murray et al. 2005; Michelakis et al. 2008; Ovens et al.
2010b; Pedersen 2012).
Targeting lactate metabolism is another attractive strategy for cancer therapeutics (Doherty and Cleveland 2013). Lactic acid produced by tumor cells has emerged as a critical factor of cancer development, metastasis as well as patient survival probability (Walenta et al. 2000;
Gatenby and Gillies 2004). Blocking lactate secretion affects the tumor cells itself and at the same time accumulation of the immunosuppressive metabolite lactic acid is reduced. The main transporters involved in lactate secretion are MCTs. MCTs are plasma membrane transporters carrying monocarboxylates, such as lactate, pyruvate or ketone bodies, across biological membranes (Halestrap and Wilson 2012). MCTs are encoded by the solute carrier family 16 genes (SLC16). Within this family 14 members have been identified so far in mammals (Halestrap and Price 1999; Juel and Halestrap 1999; Halestrap and Wilson 2012). However, only the MCTs 1 to 4 have been demonstrated to facilitate monocarboxylate transport up to now.
While MCT1, 3 and 4 use the basignin protein (CD147) as ancillary protein, MCT2 uses embidigin (Halestrap and Wilson 2012).
17
MCT2 (SLC16A7) and MCT3 (SLC16A8) seem to play a less significant role in human tissue and have a more restricted expression pattern (Halestrap and Wilson 2012). MCT1 (SLC16A1) is expressed almost ubiquitously in all tissues such as the kidney, the liver, the heart and the skeletal muscle (Halestrap and Price 1999). MCT1 has a high lactate affinity with a Km value of 3.5 mM and is responsible for lactate entry into or efflux out of cells depending on the metabolic state (Halestrap 2012). High expression levels of this transporter in tumors are associated with a poor outcome (Kong et al. 2016). MCT1 expression was shown to be highly elevated in breast, colorectal, gastric and cervical cancer (Pinheiro et al. 2008; Pinheiro et al. 2010; de Oliveira, Talvane Torres Antônio et al. 2012). However, a single MCT1 knockdown in human colon adenocarcinoma cells neither impaired glycolysis nor the rate of tumor growth (Le Floch et al.
2011). In line, in breast cancer cells MCT1 inhibition did not consistently alter lactate transport.
However, reduced pyruvate export has been observed suggesting MCT1 to also promote pyruvate export (Hong et al. 2016).
In highly glycolytic cells such as tumor cells lactate transport is not only mediated by MCT1 but also by MCT4 (SLC16A3) (Halestrap and Wilson 2012). MCT4 expression is a direct downstream target of the transcription factor HIF-1α and is upregulated in response to hypoxia (Ullah et al. 2006; Perez de Heredia et al. 2010). Due to its low affinity for lactate (Km value: 22 to 28 mM) MCT4 is in particular adapted to the release of lactate in a microenvironment already containing high amounts of lactate (Dimmer et al. 2000). MCT4 plays a key role in tumorigenesis. Knockdown experiments have shown that MCT4 is not essential for survival but required for migration and invasion of tumor cells (Gallagher et al. 2007; Izumi et al. 2011; Kong et al. 2016). Elevated levels of MCT4 have been detected in colorectal and prostate cancer (Pinheiro et al. 2008; Pértega-Gomes et al. 2011).
The elevated levels of MCT1 and MCT4 in various tumor entities provide a promising target structure. Several potent MCT1/2 inhibitors have already been developed (Murray et al. 2005;
Ovens et al. 2010a; Doherty et al. 2014) and some are currently tested in clinical trials (Doherty and Cleveland 2013). However, these compounds are inactive in the presence of MCT4. Hence, the development of potent pan-MCT inhibitors or inhibitors selectively targeting MCT4 is needed.
Recently, Sasaki and colleagues demonstrated that diclofenac, a nonsteroidal anti-inflammatory drug (NSAID), is capable to block lactate transport by MCT4 (Sasaki et al. 2016). Diclofenac is able to reduce glucose uptake and lactate secretion in tumor cells. In in vivo experiments diclofenac significantly impaired tumor growth (Chirasani et al. 2013; Gottfried et al. 2013). New data of our laboratory demonstrate that diclofenac is capable to directly block MCT1 and MCT4
Introduction
18
(Renner et al. under revision). Therefore diclofenac might be a candidate for a pan-MCT inhibitor used as an anti-cancer drug.
1.5.2. Targeting mitochondrial respiration in the context of tumor therapy
Besides glycolytic activity, mitochondrial respiration displays a possible target in tumor cells as well. The clinically applied multikinase inhibitor sorafenib interferes with mitochondrial function and reduces mitochondrial respiration (Tesori et al. 2015). Additionally, sorafenib was shown to decrease Treg frequency in metastatic renal cell carcinoma patients (Busse et al.
2011).
The anti-diabetic drug metformin, a biguanide, is also able to block mitochondrial respiration (Owen et al. 2000). Type 2 diabetes patients treated with metformin are known to be at lower risk for developing cancer (Dowling et al. 2007; Libby et al. 2009). Moreover, metformin was proposed as adjuvant therapy for glioma, as preliminary results reported a survival benefit of patients with grade III glioma using metformin (Seliger et al. 2019). As metformin is a frequently applied and well tolerated drug, it might be applied for tumor therapy. However, it has to be taken into consideration that metformin as well as sorafenib induce compensatory glycolytic activity (Tesori et al. 2015; Renner et al. 2018), which could in turn contribute to immune escape.
Thus a combination of a glycolytic inhibitor with those drugs might be a more promising strategy (Gerthofer et al. 2018; Renner et al. 2018).
1.5.3. Targeting amino acid metabolism for tumor therapy
As tumor cells are characterized by an elevated amino acid metabolism, these pathways are also regarded as a possible target for tumor therapy and various drugs have been developed.
The application of an enzyme degrading arginine resulting in arginine deprivation showed promising results in patients with leukemia (Miraki-Moud et al. 2015). Moreover, the inhibitor CB- 1158 blocked arginase released by MDSCs within the tumor microenvironment, diminished tumor growth and was able to reduce suppressive capacity of these cells (Steggerda et al.
2017).
Asparaginase, the enzyme catalyzing the degradation of asparagine, is used to treat acute lymphoblastic leukemia and lymphomas for decades (Avramis 2012). Asparagine displays an important metabolite for tumor cells especially under glutamine restricted conditions (Zhang et
19
al. 2014). Due to this fact, the treatment with asparaginase in combination with drugs targeting glutamine metabolism could maximize the therapeutic efficacy.
Phenylacetate reduces the biologic availability of glutamine in the blood stream and is able to inhibit the proliferation of tumor cells (Samid et al. 1993). Most compounds targeting glutamine metabolism are still in the preclinical stage (Altman et al. 2016). Allosteric inhibitors of GLS, such as CB-839 or BPTES (bis-2-(5-phenylacetamido‑1,2,4‑thiadiazol‑2‑yl) ethyl sulfide), have shown promising results in preclinical models of triple-negative breast cancer and human B cell lymphoma (Shukla et al. 2012; Gross et al. 2014). CB-839 is currently under investigations in clinical trials for solid tumors, hematological tumors as well as leukemia (Clem et al. 2016).
Other compounds targeting glutamine dependent pathways as acivicin ((2S)-amino-(5S)-3- chloro-4,5-dihydro-1,2-oxazol-5-yl ethanoic acid) or DON (6-diazo-5-oxo-L-norleucine) failed to get approval due to severe toxicity (Adolphson et al. 1986; Rais et al. 2016).
1.5.4. Application of anti-metabolic drugs in immunotherapy: opportunities and challenges
Tumor cells have developed several strategies to escape and suppress the immune system (Figure 3) summarized as the hallmarks of cancer (Hanahan and Weinberg 2011), including the deregulated energy metabolism and immune escape, which seem to be closely related. As the metabolic tumor microenvironment limits endogenous anti-tumor immune responses it is likely to limit the efficacy of newly developed immunotherapeutic approaches. During the last decades immunotherapy has become an important approach in treating cancer (Callahan et al. 2016).
Currently investigated immunotherapies include antibodies against immune checkpoints, such as PD-1 or CTLA-4, displaying receptors with a regulatory function. CD8 T cells in tumors express high levels of PD-1 associated with an exhausted phenotype and impaired effector functions (Ahmadzadeh et al. 2009). A therapy combining nivolumab and ipilimumab, monoclonal antibodies targeting PD-1 or CTLA-4 on T cells, has shown promising response rates in metastatic melanoma (Postow et al. 2015), but in the meantime also in other tumor entities.
ACT is another promising type of immunotherapy. After isolation, genetic engineering and in vitro expansion of patient derived T cells, anti-tumor T cells are applied to cancer patients in order to recognize, target and destroy tumor cells. ACT of antigen-specific T cells was shown to mediate regression of established tumors (Yee et al. 2002). Moreover, ACT of chimeric antigen receptor (CAR) T cells is another promising immunotherapeutic approach. In this therapy T cells
![Table 5: Antibodies used for fluorescence activated cell sorting with used volume for 10 x 10 6 cells Specificity Conjugation Volume [µl]](https://thumb-eu.123doks.com/thumbv2/1library_info/3735730.1509020/57.918.282.643.133.311/table-antibodies-fluorescence-activated-sorting-specificity-conjugation-volume.webp)