Article
Restricting Glycolysis Preserves T Cell Effector Functions and Augments Checkpoint Therapy
Graphical Abstract
Highlights
d
Glycolytic index in melanoma negatively correlates with response to anti-PD1 therapy
d
Blocking lactate transport or knock out of glycolytic genes improves checkpoint therapy
d
Diclofenac blocks the lactate transporters MCT1 and MCT4 in a COX-independent manner
d
Inhibition of glycolysis by MCT blockade does not impede T cell function
Authors
Kathrin Renner, Christina Bruss, Annette Schnell, ..., Katja Dettmer, Mark Selby, Marina Kreutz
Correspondence
kathrin.renner-sattler@ukr.de
In Brief
Renner et al. demonstrate a negative correlation between glycolytic activity in tumors and response to checkpoint therapy. Genetic blockade of glycolysis or pharmacological inhibition of the main lactate transporters MCT1 and MCT4 preserves T cell function, reverses tumor acidification, and augments response to checkpoint therapy.
Renner et al., 2019, Cell Reports 29 , 135–150 October 1, 2019 ª 2019 The Author(s).
https://doi.org/10.1016/j.celrep.2019.08.068
Cell Reports
Article
Restricting Glycolysis Preserves T Cell Effector Functions
and Augments Checkpoint Therapy
Kathrin Renner,
1,2,21,24,* Christina Bruss,
1,21Annette Schnell,
1,21Gudrun Koehl,
3Holger M. Becker,
4,22Matthias Fante,
1Ayse-Nur Menevse,
2Nathalie Kauer,
1Raquel Blazquez,
1Lisa Hacker,
1Sonja-Maria Decking,
1Toszka Bohn,
5Stephanie Faerber,
1Katja Evert,
6Lisa Aigle,
1Sabine Amslinger,
7Maria Landa,
7,23Oscar Krijgsman,
8Elisa A. Rozeman,
8Christina Brummer,
1Peter J. Siska,
1Katrin Singer,
1Stefanie Pektor,
9Matthias Miederer,
9Katrin Peter,
1Eva Gottfried,
1Wolfgang Herr,
1Ibtisam Marchiq,
10Jacques Pouyssegur,
10,11William R. Roush,
12SuFey Ong,
13Sarah Warren,
13Tobias Pukrop,
1Philipp Beckhove,
2Sven A. Lang,
14Tobias Bopp,
5,15,16,17Christian U. Blank,
8John L. Cleveland,
18Peter J. Oefner,
19Katja Dettmer,
19Mark Selby,
20and Marina Kreutz
1,21
Department of Internal Medicine III, University Hospital Regensburg, Regensburg, Germany
2
Regensburg Center for Interventional Immunology, Regensburg, Germany
3
Department of Surgery, University Hospital Regensburg, Regensburg, Germany
4
Division of General Zoology, University of Kaiserslautern, Kaiserslautern, Germany
5
Institute for Immunology, University Medical Center Johannes Gutenberg University (UMC) Mainz, Mainz, Germany
6
Institute of Pathology, University of Regensburg, Regensburg, Germany
7
Institute of Organic Chemistry, University of Regensburg, Regensburg, Germany
8
Department Medical Oncology and Division of Molecular Oncology and Immunology, The Netherlands Cancer Institute, Amsterdam, the Netherlands
9
Department of Nuclear Medicine, University Medical Center, Johannes Gutenberg University Mainz, Mainz, Germany
10
Institute of Research on Cancer and Aging (IRCAN), CNRS-INSERM-UNS UMR 7284, Nice, France
11
Department of Medical Biology, Scientific Centre of Monaco (CSM), Monaco
12
Department of Chemistry, The Scripps Research Institute, Scripps-Florida, Jupiter, FL, USA
13
NanoString Technologies, Seattle, WA, USA
14
Department of General and Visceral Surgery, Medical Center, Faculty of Medicine University of Freiburg, Freiburg, Germany
15
Research Center for Immunotherapy (FZI), UMC Mainz, Mainz, Germany
16
University Cancer Center Mainz, UMC Mainz, Mainz, Germany
17
German Cancer Consortium (DKTK), Heidelberg, Germany
18
Department of Tumor Biology, Moffitt Cancer Center and Research Institute, Tampa, FL, USA
19
Institute of Functional Genomics, University of Regensburg, Regensburg, Germany
20
Bristol-Myers Squibb, Redwood City, CA, USA
21
These authors contributed equally
22
Present address: Department of Physiological Chemistry, University of Veterinary Medicine Hannover, Hannover, Germany
23
Present address: Institute of Organic Chemistry, University of Stuttgart, Stuttgart, Germany
24
Lead Contact
*Correspondence: kathrin.renner-sattler@ukr.de https://doi.org/10.1016/j.celrep.2019.08.068
SUMMARY
Tumor-derived lactic acid inhibits T and natural killer (NK) cell function and, thereby, tumor immunosurveil- lance. Here, we report that melanoma patients with high expression of glycolysis-related genes show a worse progression free survival upon anti-PD1 treat- ment. The non-steroidal anti-inflammatory drug (NSAID) diclofenac lowers lactate secretion of tumor cells and improves anti-PD1-induced T cell killing in vitro . Surprisingly, diclofenac, but not other NSAIDs, turns out to be a potent inhibitor of the lactate transporters monocarboxylate transporter 1 and 4 and diminishes lactate efflux. Notably, T cell activa- tion, viability, and effector functions are preserved un- der diclofenac treatment and in a low glucose environ- ment in vitro. Diclofenac, but not aspirin, delays tumor
growth and improves the efficacy of checkpoint ther- apy in vivo. Moreover, genetic suppression of glycol- ysis in tumor cells strongly improves checkpoint ther- apy. These findings support the rationale for targeting glycolysis in patients with high glycolytic tumors together with checkpoint inhibitors in clinical trials.
INTRODUCTION
Immunotherapy with immune checkpoint inhibitors can over- come T cell anergy and activate the anti-tumor immune response, and yet, many patients still fail on such therapies (Ba- lar and Weber, 2017; Migali et al., 2016; Sharma et al., 2017;
Zhao and Subramanian, 2017). The tumor microenvironment is also characterized by nutrient competition and accumulation of metabolites, which compromise T cell metabolism and function and might contribute to the restricted response to checkpoint
Cell Reports 29, 135–150, October 1, 2019 ª 2019 The Author(s). 135
blockade (Anderson et al., 2017; Brand et al., 2016; Chang et al., 2015; Colegio et al., 2014; Ho et al., 2015). Accordingly, combi- nation strategies are being developed to target both metabolism and immune checkpoints. Interestingly, the combination of im- mune checkpoint inhibition with the non-steroidal anti-inflamma- tory drug (NSAID) aspirin, which blocks cyclooxygenase (COX) activity and prostaglandin E secretion (PGE
2), has been shown to augment the efficacy of checkpoint blockade (Zelenay et al., 2015). However, in addition to elevated lipid metabolism and COX expression, tumor cells are often characterized by increased glycolytic activity that results in intratumoral lactate accumulation and acidification. Furthermore, T and natural killer (NK) cells take up lactic acid that impairs effector functions (Fischer et al., 2007). Accordingly, strategies that impair tumor cell glycolysis improve immunosurveillance and tumor growth control (Brand et al., 2016; Long et al., 2018). In line with these findings, tumor glucose fermentation inversely correlates with T cell infiltration and overall survival (Ottensmeier et al., 2016;
Singer et al., 2011). Moreover, retrospective analyses have shown that elevated lactate dehydrogenase (LDH) correlates with poor prognosis and outcome in anti-PD1-treated patients (Heppt et al., 2017; Kelderman et al., 2014; Wen et al., 2017).
Given these findings, there are efforts to develop effective means to impair tumor glycolysis in order to improve the response to checkpoint therapy. Targeting lactate transporters (monocar- boxylate transporters [MCTs]) is a promising approach (Baek et al., 2014; Doherty et al., 2014; Long et al., 2018; Marchiq et al., 2015). Indeed, MCT1/2-selective inhibitors rapidly disable glycolysis (Baek et al., 2014; Doherty et al., 2014; Marchiq et al., 2015) and are currently tested in a phase 1 trial (https://www.
clinicaltrials.gov/ct2/show/NCT01791595). However, the efficacy of such agents in reducing tumor cell lactate efflux can be limited by co-expression of MCT4, which is frequently found on tumor cells (Doherty et al., 2014; Le Floch et al., 2011; Marchiq et al., 2015). Therefore, the simultaneous inhibition of MCT1/2 and MCT4 transporters is likely required to significantly reduce lactic acid secretion in the tumor milieu. Such agents could also target immune cell metabolism and, thereby, impair their function, as in- creases in glycolysis have been linked to the effector functions e.g. of T cells (Chang et al., 2013; Freemerman et al., 2014; Gubser et al., 2013; Kelly and O’Neill, 2015; Macintyre et al., 2014; van der Windt and Pearce, 2012). However, a recent study has shown that the response to adoptive T cell transfer can be improved by glyco- lytic inhibitors (Cascone et al., 2018) and genetic downregulation of the lactate-generating enzyme LDHA improved the efficacy of anti-PD-1 treatment (Daneshmandi et al., 2019).
Here, we tested the hypothesis whether pharmacological tar- geting of tumor glycolysis could improve checkpoint blockade.
In support of this notion, a high glycolytic index negatively corre- lated with progression-free survival in cancer patients treated with anti-PD1 therapy. As diclofenac targets glucose metabolism not only in murine tumor models and cell lines but also in patients with actinic keratosis (Gottfried et al., 2013; Singer et al., 2019), we tested its impact on the efficacy of checkpoint therapy.
T-cell-mediated killing of tumor cells could be improved in an in vitro coculture assay by pre-treating tumor cells with diclofe- nac, which we identified as a potent inhibitor of MCT1 and MCT4. Diclofenac spared the anti-tumor activity of effector
T cells in vitro and improved checkpoint therapy in two tumor models. These findings support the concept of combining diclo- fenac or other MCT inhibitors with immunotherapy.
RESULTS
Tumor Cell Glycolysis Limits the Response to Checkpoint Inhibition
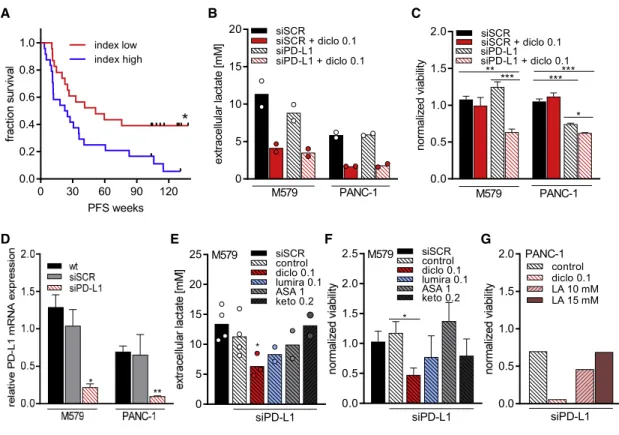
We investigated whether local metabolic activity affects the response to checkpoint therapy in biopsies of 47 melanoma pa- tients prior to anti-PD-1 treatment (Table S1). A glycolytic index based on the expression level of glycolysis-related genes was calculated (Table S2) (https://meetinglibrary.asco.org/record/
156550/abstract). Patients with lower index levels had an increased probability of longer progression-free survival times (Figure 1A), even after adjustment for sex, age, pre-treatment, stage, and location.
These patient data suggested that increased glycolytic activity limits the efficacy of checkpoint therapy. Thus, targeting glucose fermentation could improve response rates. As lactic acid in- hibits T-cell-mediated killing (Brand et al., 2016), we investigated whether reducing lactate secretion improves T-cell-mediated killing of melanoma and pancreatic tumor cells in combination with PD-L1 knockdown, resembling the application of anti-PD- 1 antibodies. As we have previously shown that diclofenac impairs lactate efflux of tumor cells (Gottfried et al., 2013), mela- noma (M579) and pancreatic cancer cells (PANC-1) were pre- treated with diclofenac. Diclofenac diminished lactate secretion in both tumor cell lines (Figure 1B) independent of any effect on proliferation, as shown by normalization to cell number applying the consumption and release profiling (CORE) method (Fig- ure S1A; Jain et al., 2012). The viability of tumor cells and T cells was not affected by 72 h of diclofenac treatment (Figures S1B and S1C). More lactate was detected in supernatants of melanoma cells compared to pancreatic cancer cells (Figure 1B).
T cells alone were not capable of killing tumor cells in both model systems (Figure 1C). PD-L1 knockdown was effective (Figure 1D) but by itself insufficient to induce T-cell-mediated melanoma cell killing (Figure 1C). High concentrations of lactic acid might sup- press responses to checkpoint blockade. In line, reduction of lactate secretion through diclofenac boosted T-cell-mediated killing in PD-L1 knocked down melanoma cells (Figure 1C). In contrast, aspirin, ketoprofen, or lumiracoxib had only a limited effect on lactate secretion and killing (Figures 1E and 1F). In contrast to melanoma cells, PD-L1 knockdown in pancreatic cancer cells boosted T-cell-mediated killing (Figure 1C), which was further enhanced by diclofenac. Adding lactic acid in tu- mor-relevant concentrations reverted the positive effect of diclo- fenac (Figure 1G). This effect can be explained by the fact that T cells died under increasing lactic acid concentrations (Fig- ure S1D), whereas pancreatic tumor cells tolerated the exoge- nous addition of lactic acid in contrast to M579 cells (Figure S1C).
Taken together, reducing tumor efflux of lactate enhances the immune response to checkpoint inhibition.
Diclofenac Directly Inhibits MCT1 and MCT4 Activity
As some NSAIDs, including diclofenac, are monocarboxylates,
we hypothesized that diclofenac directly targets MCTs. We
investigated the effect of different NSAIDs on MCT transport ac- tivity in Xenopus laevis oocytes expressing either MCT1 or MCT4. Indeed, diclofenac inhibited transport activity of both MCT1 and MCT4, with a half maximal inhibitory concentration (IC
50) of 1.45 ± 0.04 mM for MCT1 and 0.14 ± 0.01 mM for MCT4. Thus, diclofenac is a potent MCT inhibitor and has an approximately 10-fold higher potency for MCT4 than for MCT1 (Figures 2A, 2B, S2A, and S2B). Furthermore, recovery of
MCT4 transport activity was significantly reduced following washout of the drug compared to the recovery of MCT1 activity (Figures S2C and S2D), suggesting stronger binding of diclofe- nac to MCT4 than to MCT1. To clarify whether other NSAIDs are capable of blocking MCT activity, the effect of ketoprofen and lumiracoxib, which show structural similarity to diclofenac, as well as aspirin, were analyzed. Lumiracoxib also blocked MCT1 and MCT4 activity, however, at higher IC
50values
A B C
D E F G
Figure 1. Glycolytic Activity Limits T Cell Response
(A) Expression of AKT1, HIF1A, SLC2A1, HK2, HK1, TPI1, ENO1, LDHA, PFKFB3, PFKM, GOT1, GOT2, and GLUD1 was analyzed in melanoma biopsies of 47 patients prior to anti-PD1 therapy, and a glycolytic index was calculated. Patients were stratified according to the median index calculated; progression-free survival was plotted as a Kaplan Meier estimation curve. Significance was calculated applying the log-rank (Mantel-Cox) test.
(B–G) M579-LUC or PANC-1-LUC cells were transfected either with pools of small interfering RNA (siRNA) either scrambled (siSCR) or siRNAs targeting PD- L1 (siPD-L1).
(B) Lactate levels in supernatants were determined after 72 h of transfection in the presence or absence of 0.1 mM diclofenac. The experiment was conducted twice; each time two independent plates with four technical replicates were performed. Supernatants of technical replicates were pooled for analysis (mean, n = 2).
(C) 72 h after transfection, tumor cells were pulsed with influenza peptide and influenza-specific T (FluT) cells were added, and after 20 h of coculture, luciferase activity of tumor cells was determined. Tumor cell viability was calculated as the ratio of luciferase activity of tumor cells only to tumor cells cocultured with FluT cells within one treatment condition. The experiment was conducted two times; each time two independent plates with four technical replicates on each were performed. Mean of technical replicates of each plate was calculated (one-way ANOVA, Dunnett’s multiple comparisons test, *p < 0.05, **p < 0.01, ***p < 0.001, mean + SEM, n = 4).
(D) PD-L1 mRNA expression was analyzed in wild-type cells (WT), in cells treated with siSCR and cells treated with siPD-L1 (one-way ANOVA paired, Dunnett’s multiple comparisons test, *p < 0.05, **p < 0.01, mean + SEM, n = 4).
(E and F) M579 cells were transfected as indicated in the presence or absence of 0.1 mM diclofenac (diclo), 0.1 mM lumiracoxib (lumira), 1 mM aspirin (ASA), or 0.2 mM ketoprofen (keto).
(E) Lactate levels were determined in supernatants after 72 h of transfection (mean, n = 2 to 4).
(F) 72 h after transfection, tumor cells were pulsed with influenza peptide, peptide was removed, and medium only or FluT was added. After 20 h, luciferase activity of tumor cells was determined. Viability was calculated by dividing siSCR normalized luciferase values of tumor cells cultured with FluT cells to respective medium-only values within each treatment condition (mean + SEM, n = 3).
(G) Lactic acid was added during coculture of FluT cells with PANC-1-LUC cells transfected with siPD-L1, and normalized viability was calculated. The experiment was performed once in triplicates; shown is the mean.
See also Figure S1.
(of 4.15 mM and 1.12 mM, respectively; Figures 2C and 2D).
Ketoprofen inhibited MCT activity with an almost 100-fold higher IC
50than diclofenac (Figures S2E and S2F). Finally, aspirin had no impact on transport activity even at a concentration of 1.0 mM (Figures 2E and 2F). To clarify the importance of the
Figure 2. Diclofenac and Lumiracoxib Inhibit MCT1 and MCT4 Transport Activity (A and B) Indicated concentrations of diclofenac were washed in for 10 min, and relative rate of change in [H
+]
i(D[H
+]
i/Dt) was determined as induced by application of (A) 3 mM lactate in Xenopus oocytes expressing MCT1 and (B) 10 mM lactate in oocytes expressing MCT4 (mean ± SEM, n = 5).
(C and D) Indicated concentrations of lumiracoxib were washed in for 10 min, and relative rate of change in [H
+]
i(D[H
+]
i/Dt) was determined as induced by application of (C) 3 mM lactate in oo- cytes expressing MCT1 and (D) by application of 10 mM lactate in oocytes expressing MCT4 (mean ± SEM, n = 5).
(E and F) Original recording showing change in intracellular H
+concentration in oocytes during application of aspirin. D[H
+]i/Dt as induced by application of (E) 3 mM lactate in oocytes ex- pressing MCT1 and (F) 10 mM lactate in oocytes expressing MCT4 before (light gray bar) and after (dark gray bar) 10 min wash in of 1 mM aspirin (mean ± SEM, n = 5).
(G and H) Impact of diclofenac derivatives (G) on lactate secretion (H) in a human melanoma cell line (MelIM). Lactate levels were normalized to control (mean+SEM, n = 3).
See also Figure S2.
monocarboxylate structure for MCT inhi- bition, we tested two structurally related compounds with blocked carboxyl groups (Figure 2G). Both diclofenac tert- butyl ester (DtBE) and diclofenac amid had no impact on lactate secretion (Fig- ure 2H), indicating that the carboxyl group is essential for blocking MCT.
Lactate Lowering by Diclofenac Is Independent of Changes in
Glycolysis-Associated Proteins and MCT Expression Profile
Diclofenac diminished lactate secretion of melanoma and pancreatic tumor cells. To investigate whether this is partially medi- ated by reducing the expression of the MCTs or suppression of glycolysis- related proteins, we analyzed MCT1, MCT4, LDHA, and LDHB protein levels af- ter diclofenac treatment. No effects were observed in melanoma and pancreatic tu- mor cells (Figures 3A and 3B). To exclude an impact on PD-L1 and MHC-I expres- sion, we performed flow cytometry ana- lyses. We did not detect a suppressive effect of diclofenac on PD-L1 but saw a slightly upregulated MHC-I expression in melanoma cells (Figures 3C and 3D).
Next, the effect of diclofenac was compared to the clinically
tested MCT1/2 inhibitor AZD3965 in tumor cell lines expressing
different MCT1 to MCT4 ratios. MCT1 was highly expressed in both cervix carcinoma cell lines investigated, but MCT4 was ex- pressed at higher levels in OC-316 cells compared to IGROV-1 cells (Figure S3A). In accordance with the MCT expression pro- file, the MCT1/2 inhibitor AZD3965 reduced lactate secretion in IGROV-1 but not in OC-316 cells (Figure S3B). In contrast, diclo- fenac suppressed lactate secretion in both tumor cell lines (Fig- ure S3B). The combination of diclofenac and AZD slightly augmented the reduction of lactate secretion in both cell lines (Figure S3B). To confirm on-target specificity of diclofenac and the MCT1/2 inhibitor, we assessed the effects of diclofenac versus AZD on human LS174T colorectal cancer cell clones ex- pressing both MCT1 and MCT4 (wild type [WT]) in comparison to MCT1 (MCT1
/), MCT4
/and MCT1/4 double knockout (MCT1/4
/). MCT expression was confirmed by western blot (Figure S3C). As expected, the MCT1/2 inhibitor strongly reduced lactate secretion only in MCT4
/cells, whereas diclo- fenac diminished lactate efflux in the parental and the single- knockout clones but had no impact in MCT1/4
/cells, which secreted very small amounts of lactate (Figure S3D).
MCT Inhibition Does Not Compromise T Cell Function In Vitro
Blocking MCT1/2 impairs glycolysis in lymphocytes (Murray et al., 2005), and diclofenac might affect glucose metabolism in T cells. The MCT expression was first assessed in quiescent and anti-CD3/CD28-stimulated human CD8
+and CD4
+T cells.
Quiescent human T cells expressed very low levels of MCT1 and MCT4. Activation of T cells led to a marked and sustained upregulation of MCT1, whereas MCT4 induction was delayed but yet robust 6 days following stimulation (Figures 4A and S4A). In line with the MCT expression, the MCT1/2 inhibitor AZD3965 (AZD) reduced lactate secretion in stimulated human CD8
+and CD4
+T cells and 0.1 mM diclofenac had similar effects A
B D
C Figure 3. Effects of Diclofenac Are Indepen-
dent of Changes in Glycolysis-Associated Proteins
(A and B) Expression of MCT1, MCT4, LDHA, and LDHB were analyzed in (A) M579 cells and (B) PANC-1 cells after 72 h of 0.1 or 0.2 mM diclofe- nac treatment. Protein expression was deter- mined by western blot. One representative blot out of three independent experiments is shown.
(C and D) Surface expression of PD-L1 and MHC-I in (C) M579 and (D) PANC-1 cells was analyzed after 72 h of 0.1 and 0.2 mM diclofenac treatment by flow cytometry. One representative out of three independent experiments is shown.
See also Figure S3.
(Figures 4B and S4B). Treatment with 0.2 mM diclofenac led to a more profound decrease in lactate secretion, and this ef- fect was only marginally intensified by the combined treatment with AZD (Figures 4B and S4B). As expected, reductions in lactate secretion correlated with a dimin- ished glucose uptake (data not shown) and proliferation (Figures 4C and S4C). We also investigated the effect of lumiracoxib, as it displays the highest structural sim- ilarity to diclofenac and was capable of inhibiting both trans- porters in the low micromolar range. In line with higher IC
50values for both MCTs, lumiracoxib was capable of reducing lactate secretion and proliferation at a concentration of 0.2 mM (Figures 2B, 2C, S2B, and S2C). Nevertheless, viability was pre- served under MCT inhibition (Figures 4D and S4D). Links be- tween glucose metabolism and T cell function particularly regarding interferon gamma (IFNg) production have been re- ported. Thus, we assessed whether reduced glycolytic activity triggered by MCT inhibition compromises human T cell function.
The initial growth phase, the so-called ‘‘on-blast’’ formation, was not affected by treatment with diclofenac ± MCT1/2 inhibitors or lumiracoxib (data not shown). Analyses of cytokine production revealed that IFNg (Figures 4E and S4E) and tumor necrosis fac- tor (TNF) production (data not shown) were maintained in both T cell populations, even when diclofenac was combined with AZD-blocking MCT1, MCT2, and MCT4. Interleukin-2 (IL-2) pro- duction in CD4
+T cells was unaffected by MCT inhibition (data not shown). Moreover, the expression of the activation-related molecules CD25, CD137, and PD-1 was unchanged in CD8
+and CD4
+T cells (Figures 4F and S4F).
Given the robust expression of both MCT1 and MCT4 after
6 days of expansion in CD8
+and CD4
+T cells (Figures 4G and
S4G), we tested the impact of MCT inhibition on expanded and
re-stimulated T cells. Lactate secretion was not affected by
MCT1/2 inhibition (Figures 4H and S4H). These findings were
confirmed by applying SR13800, another MCT1/2 inhibitor (data
not shown) (Doherty et al., 2014). Diclofenac and lumiracoxib treat-
ment reduced lactate secretion during re-stimulation in T cells after
a 6-day expansion, although to a lower extent compared to freshly
isolated and stimulated T cells (Figures 4H and S4H). Again, IFNg
secretion was preserved (Figures 4I and S4I). Similar to tumor cells,
A B C D
E
F
G H
J K L
I
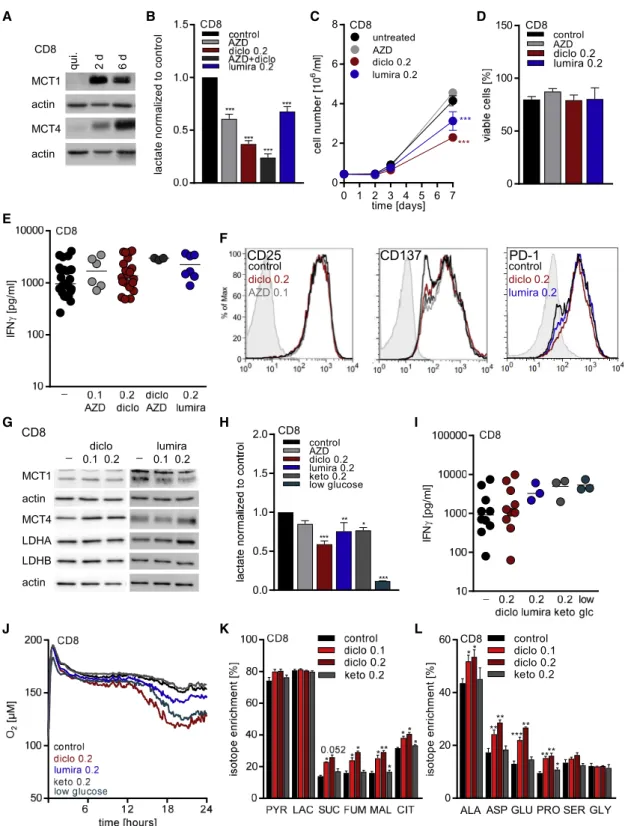
Figure 4. Diclofenac Treatment Preserves Effector Functions but Induces a Metabolic Shift from Glycolysis to Respiration in Human CD8
+T Cells In Vitro
(A–E) CD8
+T cells were freshly isolated and activated by anti-CD3/CD28 dynabeads.
(A) MCT1 and MCT4 expression in quiescent (qui.) and 2 day (2 d) and 6 day (6 d) stimulated CD8
+T cells was determined by western blot. One representative blot is shown.
(B–F) MCT inhibitors were applied at the following concentrations: 0.1 mM AZD3965 (AZD), 0.2 mM diclofenac (diclo), or 0.2 mM lumiracoxib (lumira), and the combination of 0.2 mM diclofenac and 0.1 mM AZD3965.
(legend continued on next page)
the expression of glycolysis-related proteins was not affected (Fig- ures 4G and S4G). The reduction in lactate secretion correlated with a diminished glucose uptake (data not shown), indicating pro- found changes in metabolism. Therefore, the impact of diclofenac on respiratory activity and glucose flux was analyzed in expanded T cells. Diclofenac treatment resulted in elevated cellular oxygen consumption (Figures 4J and S4J) and shifted glucose flux to tricarboxylic acid cycle (TCA) metabolites (Figures 4K and S4K).
Moreover, glucose flux into amino acids related to TCA was increased (Figures 4L and S4L). In comparison to blocking glucose metabolism by MCT inhibition, we restricted the glucose level to 0.5 mM, resulting from serum addition. Similar to diclofenac and lu- miracoxib, low glucose conditions resulted in decreased extracel- lular lactate levels (Figures 4H and S4H), preserved IFNg secretion (Figures 4I and S4I), and elevated respiration (Figures 4J and S4J).
Finally, we applied ketoprofen to control for possible COX-medi- ated effects. Ketoprofen exerted a slight impact on lactate secre- tion in CD8
+T cells but not in CD4
+T cells (Figures 4H and S4H) and did not affect IFNg secretion, respiration, or glucose flux (Figures 4I–4L and S4I–S4L).
Polyclonal activation of T cells by anti-CD3/CD28 stimulation may not reflect responses observed following antigen presenta- tion. Therefore, we assessed the effects of diclofenac on CD4
+T cells stimulated with allogeneic dendritic cells. Diclofenac reduced glucose metabolism and proliferation, but T cell effector functions were preserved (Table S3).
As diclofenac might not completely block MCT1 and MCT4 activity in T cells, we assessed the impact of a complete inhibi- tion of both transporters by using a MCT4
/mouse model.
MCT4 loss was confirmed by western blot of splenic T cells (Fig- ures 5A and 5B). T cell populations were stimulated with anti- CD3/CD28 in the presence or absence of the MCT1/2 inhibitor SR13800. MCT1/2 inhibition reduced lactate secretion by about 70% in WT T cells and by 90% in MCT4
/T cells (Figures 5C and 5D). MCT1/2 inhibition had no significant effect on IFNg
secretion in WT T cells and modestly reduced IFNg secretion in MCT4
/T cells (Figures 5E and 5F). Nonetheless, high levels of IFNg were still detected following simultaneous blocking of MCT1, MCT2, and MCT4. The impact of diclofenac on IFNg secretion was comparable to the combined blockade of MCT1, MCT2, and MCT4 (Figures 5G and 5H).
Finally, we tested whether in vivo administration of diclofenac affects T cell or NK cell levels in blood, spleen, or lymph nodes of healthy C57BL/6 mice. The percentage of CD3
+T cells, CD8
+T cells, and NK cells were not altered by diclofenac (Figures S5A–S5C). However, in tumor-bearing C57BL/6 mice, diclofe- nac treatment lowered the number of T cells in the spleen and in the blood (Figures S5D–S5E).
Targeting Tumor-Derived Lactic Acid Secretion Augments the Efficacy of Checkpoint Therapy
Lactic acid secretion of murine B16 melanoma cells promotes tumor growth in immunocompetent but not in immunodeficient mice (Brand et al., 2016). Both diclofenac and lumiracoxib reduced lactate secretion in B16 cells in vitro (Figure 6A) and elevated the pH in cell culture supernatants (Figures 6B and 6C). The immediate effect of diclofenac on pH further supports the notion that a reduction in proliferation (Figure 6D) is a sec- ondary effect and not the cause for decreased extracellular lactate levels. Viability was only affected after 72 h at concentra- tions of 0.2 mM diclofenac or lumiracoxib (Figure 6E). Similar to human tumor cells and T cells, the expression of glycolysis- related proteins such as MCTs or LDH isoforms (Figure 6F) and PD-L1 or MHC expression (Figure 6G) was not altered by diclo- fenac. We analyzed whether diclofenac could also improve checkpoint blockade in a murine coculture model of SIY-specific T cells and SIY-expressing B16 tumor cells. Diclofenac clearly improved IFNg secretion, especially in combination with anti- PD-1 treatment (Figure 6H). We, therefore, treated mice bearing B16 tumors with low dose diclofenac (7.5 mg/kg) alone or in
(B) Lactate levels were measured after 48 h in supernatants and normalized to control (one-way ANOVA, Dunnett’s multiple comparisons test, * shows significant differences between control and treated cells, ***p < 0.001; mean + SEM, n = 13 for diclofenac, n = 7 for AZD3965, and n = 3 for the combination thereof, n = 6 for lumiracoxib-treated CD8
+T cells).
(C) Proliferation of CD8
+T cells was monitored over 7 days. Cell number was measured by the cell analyzing system (CASY; one-way ANOVA, Dunnett’s multiple comparisons test, * shows significant differences between control and treated cells, ***p < 0.001; mean + SEM, n = 17 for control cells, n = 12 for diclofenac, n = 3 for AZD3965, and n = 10 for lumiracoxib-treated CD8
+T cells).
(D) Viability of CD8
+T cells was determined after 7 days (mean + SEM, n = 17 for control cells, n = 11 for diclofenac, n = 4 for AZD3965, and, n = 7 for lumiracoxib- treated CD8
+T cells).
(E) IFNg levels secreted by CD8
+T cells were determined after 48 h in supernatants by ELISA (median, each symbol represents an independent donor).
(F) Representative flow cytometry blots show expression of CD25 and CD137 in freshly isolated and 48 h stimulated CD8
+T cells. PD-1 expression was analyzed in 6 day expanded and for 48 h re-stimulated T cells. The signal on quiescent T cells as a negative control is shown for each antibody (filled gray).
(G–L) CD8
+T cells were isolated, activated with anti-CD3/CD28 dynabeads, and expanded for 6 days. After 6 days, T cells were pooled and re-stimulated.
Diclofenac was applied at 0.1 or 0.2 mM, AZD3965 at 0.1 mM, and lumiracoxib and ketoprofen at 0.2 mM. Low glucose (0.5 mM) was achieved by the usage of a glucose-free medium supplemented with 10% human serum.
(G) MCT1, MCT4, LDHA, and LDHB protein expression was determined by western blot after 72 h. One representative blot is shown.
(H) Lactate levels were measured in 48-h supernatants and normalized to control (one-way ANOVA, Dunnett’s multiple comparisons test, * shows significant differences between control and treated cells, **p < 0.01, ***p < 0.001, mean + SEM, n = 9 for diclofenac, n = 3 for lumiracoxib, AZD, or low glucose).
(I) IFNg levels in 48-h supernatants were determined by ELISA (median, each symbol represents an independent donor).
(J) Oxygen consumption was measured by the PreSens technology (mean of three independent donors).
(K and L) Glucose flux into (K) intermediates of glycolysis and TCA cycle or (L) amino acids was determined by mass spectrometry after 48 h (one-way ANOVA, Dunnett’s multiple comparisons test, * shows significant differences between control and treated cells, *p < 0.05, **p < 0.01, ***p < 0.001, mean + SEM, n = 3).
See also Figure S4.
combination with anti-PD-1 antibodies. Diclofenac as well as anti-PD-1 alone had no effect, but the combination delayed tumor growth (Figure 6I). To improve tumor control, we applied
diclofenac and lumiracoxib in higher concentrations (15 mg/kg) and administered anti-PD-1 and anti-CTLA-4 antibodies. In this setting, diclofenac alone partially controlled tumor growth and the combined anti-PD-1 and anti-CTLA-4 therapy was very effective. The combination of checkpoint therapy with diclofenac or lumiracoxib slightly improved tumor growth control (Figure 6J).
As diclofenac and lumiracoxib elevated pH in vitro (Figures 6B and 6C), we measured the pH in B16 tumors. Both drugs elevated tumor pH by trend but showed a considerable variation suggesting a high metabolic heterogeneity (Figure 6K). To test whether normalization of tumor pH will result in a better response to checkpoint therapy, we used a genetic B16 LDH
/knockout model characterized by a deletion of LDHA and LDHB ( Zdralevi c et al., 2018). As expected from in vitro analyses (Figure 6B), intra- tumoral pH of B16 LDH
/was comparable to blood pH in a range of 7.1 to 7.2 (Figure 6L). Furthermore, positron emission to- mography (PET) analyses revealed significantly decreased glucose consumption in LDH
/tumors (Figure 6M). In line with LDH-mediated lactate secretion and acidification as a resis- tance mechanism to immune checkpoint therapy, combined treatment with anti-PD-1 and anti-CTLA-4 antibodies resulted in a long-term growth control of B16 LDH
/tumors (Figure 6N).
Finally, we investigated immune cell infiltration in B16 tumors.
Upon checkpoint therapy, the number of tumor-infiltrating leuko- cytes (CD45
+) and T cell subpopulations (CD3
+, CD3
+CD8
+) increased in B16 WT and LDH
/tumors (Figures S6A–S6C).
T cell infiltration was even stronger in the direct comparison be- tween B16 LDH
/and WT tumors under checkpoint therapy (p = 0.039; Figure S6B). The combination of NSAIDs and check- point therapy did not further stimulate T cell infiltration; however, T cell activation in terms of IFNg and IL-2 expression and PD-1 expression were higher in the presence of NSAIDs by trend, especially compared to checkpoint therapy (Figures 6O, S6D, and S6E). The highest number of IFNg
+T cells was found in checkpoint-treated B16 LDH
/tumors (Figure 6O). Surpris- ingly, fewer NK cells were found after checkpoint therapy in B16 tumors. This effect was partially reverted by combination with diclofenac (Figure S6F). These data indicate that effective blockade of tumor glycolysis can augment immune cell infiltra- tion and activation and, thereby, improve the response to check- point therapy. However, in the B16 model, diclofenac and lumi- racoxib can only partially suppress tumor glycolysis.
To test whether the effect of diclofenac was manifested in other tumor models, the 4T1 model of triple-negative breast cancer was evaluated (Kaur et al., 2012). Aspirin was applied to assess the possible effects of COX inhibition. Diclofenac treatment reduced lactate secretion of 4T1 cells to a maximum of 40%, whereas aspirin had no effect in vitro (Figure 7A). In line with that result, diclofenac but not aspirin increased the pH in culture supernatants of 4T1 cells (Figure 7B). Diclofenac exerted an immediate impact on the extracellular pH that cannot be attributed to changes in proliferation. Thus, the reduction in proliferation and viability observed after 72 h is most likely the consequence of the reduced glycolytic activity (Figures 7C and 7D). In contrast to B16 tumor cells, diclofenac reduced LDHA and MCT1 expression in 4T1 cells (Figure 7E).
MCT4 and LDHB were not expressed in 4T1 cells (Figure 7E).
Furthermore, diclofenac partially reduced PD-L1 expression A
C
B
D
F E
G H
Figure 5. Combined MCT1/2 and MCT4 Blockade Only Moderately Affects T cell Function In Vitro
CD4
+and CD8
+T cell populations were isolated from spleens of WT and MCT4 knockout (MCT4
/) mice and activated with plate-bound anti-CD3 and soluble anti-CD28 antibodies.
(A and B) MCT4 expression in WT and MCT4
/(A) CD4
+and (B) CD8
+T cells was determined by western blot at indicated time points. One representative western blot is shown.
(C–H) MCT inhibitors were applied at the following concentrations: 1 mM SR13800 (SR), 0.1, or 0.2 mM diclofenac.
(C and D) Lactate levels were measured in 48-h supernatants of SR-treated WT and MCT4
/(C) CD4
+and (D) CD8
+T cells (Mann Whitney U test, *p < 0.05, mean + SEM, n = 4).
(E–H) IFNg levels secreted by WT and MCT4
/(E and G) CD4
+or (F and H)
CD8
+T cells were determined by ELISA in supernatants of 48-h stimulated
T cells (E and F, median, each symbol represents an individual mouse; G and
H, mean of two independent experiments).
A B C D
F E
H I J
L M N O
G
K
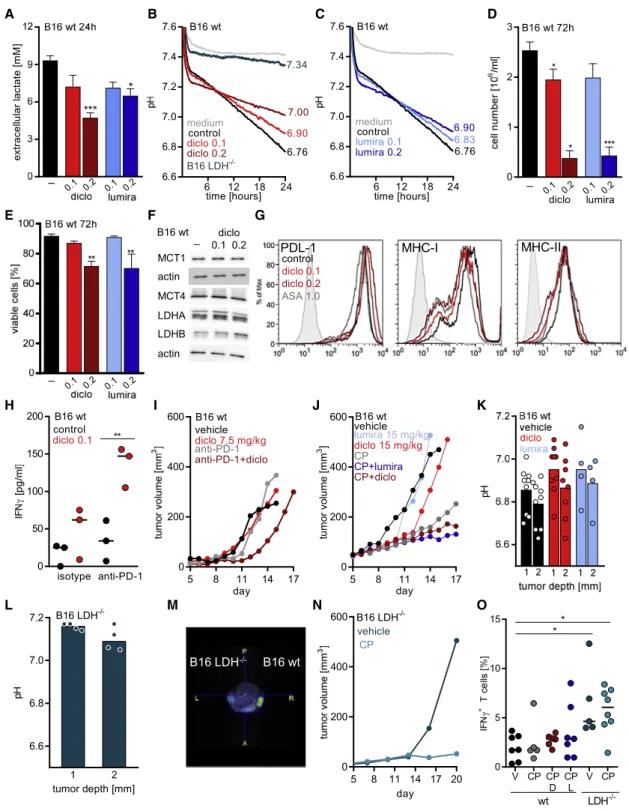
Figure 6. Modulating Glycolysis Augments the Efficacy of Checkpoint Inhibition in B16 Tumors
(A) Lactate levels were measured in supernatants of B16 WT cells in the presence or absence of 0.1 or 0.2 mM diclofenac as well as lumiracoxib (mean + SEM, n = 4, one-way ANOVA, Dunnett’s multiple comparisons test, *p < 0.05, ***p < 0.001).
(B and C) Medium pH was monitored with the PreSens technology in supernatants of B16 WT cells under diclofenac treatment and B16 LDH
–/–cells (B) or lumiracoxib-treated B16 WT cells (C) (mean, n = 3 for B16 WT cells, n = 2 for B16 LDH
/cells).
(D) Cell number was analyzed using the CASY system (one-way ANOVA, Dunnett’s multiple comparisons test, *p < 0.05, ***p < 0.001, mean+SEM, n = 3).
(E) Viability was determined (one-way ANOVA, Dunnett’s multiple comparisons test, **p < 0.01, mean+SEM, n = 3, except for diclofenac 0.2 mM, where n = 4).
(F) MCT1, MCT4, LDHA, and LDHB protein expression was determined by western blot after 72 h. One representative blot is shown.
(G) Representative FACS blots showing expression of PD-L1, MHC-I, and MHC-II after 72 h of diclofenac treatment. Isotype staining is shown (filled gray).
(legend continued on next page)
and increased MHC-I and MHC-II expression of 4T1 cells (Figure 7F).
We injected 4T1 cells subcutaneously into BALB/c mice, and at day 6, mice were treated with diclofenac or aspirin (Figure 7G).
Diclofenac delayed the growth of 4T1 tumors in vivo, whereas aspirin had only a slight impact (Figure 7G). Diclofenac also increased the intratumoral pH in this model (Figure 7H).
However, the measurement was difficult due to a dense tumor structure. Therefore, these results have to be handled with caution. In contrast to the B16 model in C57BL/6 mice, immune cell infiltration (CD45
+cells) was improved by diclofenac in 4T1 tumors (p = 0.07; Figures S7A and S7B), although the portion of CD8
+T cells among CD45
+cells was slightly decreased in 4T1 but not in B16 tumors (Figures S7C and S7D). Nevertheless, the number of activated CD8
+T cells expressing CD25 was elevated by trend under diclofenac treatment in both models (Figures S7E and S7F). NK cell infiltration was consistently higher after diclofenac treatment in both models (Figures 7G and 7H).
Furthermore, diclofenac elevated the number of IFNg
+NK cells but had no effect on IL-2 expression in 4T1 tumors (Figures 7I and 7J). Finally, among CD45
+leukocytes, CD11b
+myeloid cells represented the most frequent population and diclofenac had no impact on CD11b
+cells (Figures S7I and S7J).
To investigate whether the observed changes in the immune composition could be translated into a better response to check- point therapy, we applied diclofenac or aspirin as a COX inhibitor control in combination with checkpoint therapy also in the 4T1 model. Checkpoint inhibitors were administered every third day for 1 week according to a previously developed protocol (Selby et al., 2016), and NSAIDs were administered for 14 days. In mice receiving checkpoint inhibitors, tumor growth was monitored for 30 days. Checkpoint blockade initially limited tumor growth in 11 of 14 mice, and yet, tumor outgrowth was observed after cessation of the drug in two more mice (Fig- ure 7K). Aspirin had no positive impact on checkpoint blockade in this model (Figure 7L). Notably, in the cohort receiving diclofe- nac in combination with checkpoint blockade, tumor growth was inhibited in all mice even after cessation of checkpoint blockade as long as diclofenac was applied; only one tumor grew out after termination of diclofenac treatment (Figure 7M). However, some
mice were found dead in the diclofenac treatment groups early on, the basis of which is unknown as no necropsies were per- formed in the first set of experiments. Due to these results, we investigated toxicity in the B16 (C57BL/6) model from all treat- ment groups. General histological analyses of lung, pancreas, liver, kidney, bone marrow, and stomach were performed in 42 tumor-bearing animals from all treatment groups. Signs of toxicity were detected in 2 out of 7 diclofenac-plus-check- point-treated mice and 1 of these mice had to be terminated.
All other mice showed no signs of damage or inflammation in the examined organs (Figures S7K and S7L). Furthermore, we repeated the diclofenac treatment in the 4T1 model and no mice had to be terminated in the new set of experiments. Taken together, NSAIDs are known to induce gastrointestinal toxicity, which is in line with the observed local bowel inflammation in one mouse in the B16 model. This could be counteracted by the administration of proton-pump inhibitors as pantoprazole.
DISCUSSION
Targeting the glycolytic phenotype of tumor cells represents a promising approach from different perspectives. First, disabling glucose catabolism can compromise tumor growth and survival (Michelakis et al., 2008; Pedersen, 2012; Tennant et al., 2010).
Second, restricting glycolytic activity of tumor cells reduces the secretion of lactate and acidification of the tumor milieu, which impairs the anti-tumor immune response of T and NK cells (Brand et al., 2016; Calcinotto et al., 2012; M€ uller et al., 2000).
Accordingly, reducing intratumoral lactate levels and acidifica- tion promotes immunosurveillance and augments the efficacy of cancer immunotherapeutics (Brand et al., 2016; Calcinotto et al., 2012; Cascone et al., 2018; Long et al., 2018; Pilon- Thomas et al., 2016). In further support of this notion, Cascone et al. (2018) showed improved efficacy of adoptive T cell transfer in the presence of a glycolytic inhibitor. Our analyses of mela- noma patients suggest a direct link between the response rate to checkpoint therapy and the glycolytic activity of tumors. In line with this, a negative correlation between overexpression of metabolic genes and response to anti-PD-1 therapy has been re- ported for renal cell carcinoma (Ascierto et al., 2016).
(H) B16.SIY WT cells and SIY-specific 2C CD8
+T cells were cocultured for 24 h in the presence or absence of 0.1 mM diclofenac, anti-PD-1 antibody, or the respective isotype control. IFNg levels were determined in supernatants by ELISA (one-way ANOVA, Tukey’s multiple comparisons test, **p < 0.01, median, each symbol represents an independent experiment).
(I) 1.0 3 10
5B16 WT cells were injected subcutaneously into the flank of C57BL/6 mice. Treatment was started when tumors were palpable. Diclofenac was applied intraperitoneally (i.p.) daily (7.5 mg/kg); anti-PD-1 antibody (20 mg/kg body weight) was administered i.p. every third day. Tumor volume was monitored over time (median, n = 7 for vehicle and anti-PD-1, n = 8 for diclofenac and diclofenac + anti-PD-1).
(J) 0.3 3 10
5B16 WT cells were injected subcutaneously into the flank of C57BL/6 mice, and treatment was started when tumors were palpable. Diclofenac and lumiracoxib were applied i.p. daily (both 15 mg/kg); anti-PD-1 and anti-CTLA-4 (CP, both 10 mg/kg body weight) were administered i.p. Tumor volume was monitored over time (median, n = 9 for vehicle, n = 10 for checkpoint inhibitors combined with NSAIDs, n = 4 for diclofenac, n = 5 for lumiracoxib).
(K and L) Tumor pH was measured using a pH meter either at 1 or 2 mm depth (median, each symbol represents one individual tumor).
(K) pH of B16 WT tumors in vehicle-, diclofenac-, or lumiracoxib-treated mice was determined.
(L) pH in B16 LDH
/tumors was measured.
(M) Glycolytic activity was determined in vivo by PET scan in B16 WT and LDH
/tumors and injected into the right and left flank (shown is one representative image).
(N) 0.3 3 10
5B16 LDH
/cells were injected subcutaneously into the flank of C57BL/6 mice, and treatment was started when tumors were palpable. Anti-PD-1 and anti-CTLA-4 antibodies (CP, 10 mg/kg body weight) were administered i.p. every third day (median, n = 10).
(O) Percentage of CD3
+IFNg
+T cells in B16 WT or LDH
/tumors under indicated conditions (V, vehicle;, CP, anti-PD-1 and anti-CTLA-4; D, diclofenac;
L, lumiracoxib) was measured by flow cytometry (median, each symbol represents one individual tumor).
See also Figures S5, S6, and S7.
A B C D
E F
G H I J
K L M
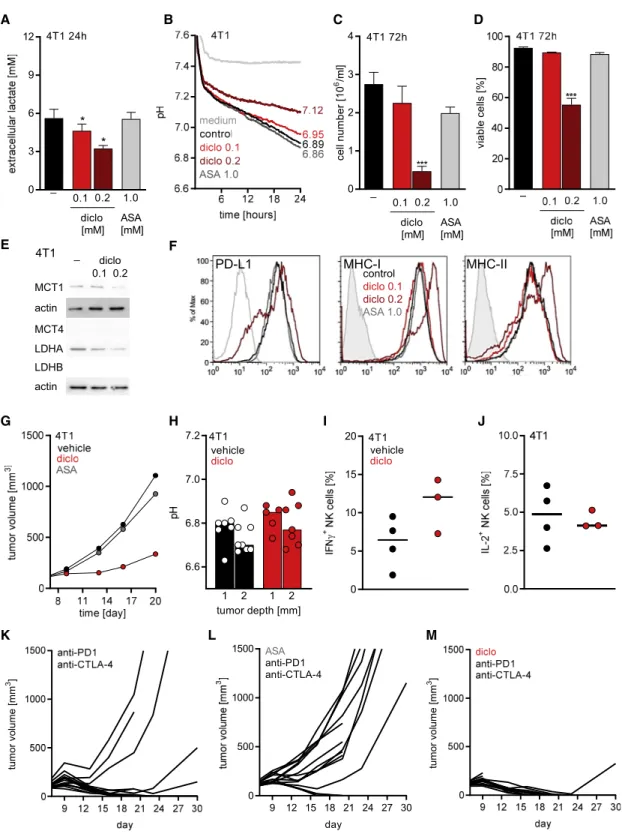
Figure 7. Diclofenac Augments the Efficacy of Checkpoint Inhibition in 4T1 Tumors
(A) Lactate levels were measured in supernatants of diclofenac- or aspirin-treated 4T1 cells (mean + SEM, n = 4, one-way ANOVA, Dunnet’s multiple com- parisons, *p < 0.05).
(B) Medium pH was monitored with the PreSens technology in supernatants of 4T1 cells under indicated conditions (mean of n = 3).
(C) Cell number was analyzed using the CASY system (one-way ANOVA, Dunnett’s multiple comparisons test, ***p < 0.001, mean + SEM, n = 3).
(D) Viability was determined (one-way ANOVA, Dunnett’s multiple comparisons test, ***p < 0.001, mean + SEM, n = 3).
(E) MCT1, MCT4, LDHA, and LDHB protein expression was determined by western blot after 72 h. One representative blot is shown.
(legend continued on next page)
MCTs are of crucial importance for glycolytic cells, as they remove lactate from the cells and, thereby, guarantee glycolytic flux, which is needed to supply metabolic intermediates for the highly anabolic tumor cells. The importance of MCTs in sustain- ing glycolysis, proliferation, and survival of tumor cells has been demonstrated in a variety of mouse models including mela- noma and breast cancer (Baenke et al., 2015; Long et al., 2018; Morais-Santos et al., 2015). Elevated expression of MCT1 and MCT4 is also associated with poor prognosis in pa- tients with breast cancer and melanoma (Baenke et al., 2015;
Pinheiro et al., 2016). Thus, MCTs are attractive targets to limit glucose metabolism.
Currently, a limited number of clinically applicable drugs tar- geting MCTs are available. A MCT1/2 inhibitor is currently tested in a clinical trial (NCT01791595) as well as thalidomide, and its derivatives are feasible agents, as they destabilize the CD147- MCT1 complex (Eichner et al., 2016). Recently, Benjamin et al.
(2018) showed that the anti-hypertensive drug syrosingopine is a dual MCT1 and MCT4 inhibitor. Another potential way to meet this need is the use of NSAIDs, which have been shown to impair lactate efflux and glucose metabolism (Emoto et al., 2002; Gottfried et al., 2013). In accordance with our studies, Sa- saki et al. (2016) investigated the impact of diclofenac on MCT activity in oocytes expressing either MCT1 or MCT4. Here, we compared the impact of diclofenac, lumiracoxib, ketoprofen, and aspirin in Xenopus oocytes expressing either MCT1 or MCT4 and calculated their IC
50values. Among the tested NSAIDs, diclofenac had the lowest IC
50value, followed by lumi- racoxib. In accordance with our oocyte experiments, diclofenac blocked MCT1 and MCT4 activity and lactate secretion in all tu- mor cell lines and primary T cells analyzed independently of their MCT1 and MCT4 expression profile and with an IC
50comparable to those reported for COX inhibition (Laneuville et al., 1994). In line with published data, the efficacy of MCT1/2 inhibition in our studies was limited by MCT4 expression (Baek et al., 2014;
Doherty et al., 2014; Marchiq et al., 2015).
As glycolysis is accelerated in activated T cells, anti-glycolytic drugs might also impede their functions. Notably, although MCT inhibition by diclofenac or lumiracoxib lowered the glycolytic ac- tivity of T cells, effector functions and viability were preserved in our in vitro experiments. Indeed, even a complete block of MCT1, MCT2, and MCT4 did not block secretion of IFNg in mu- rine T cells; however, a reduction was observed. These findings are in accordance with in vitro studies showing that T cell func- tions are preserved under low glucose conditions, most likely due to their metabolic flexibility shifting from glycolysis to oxida- tive phosphorylation (Dziurla et al., 2010; Renner et al., 2015). In
line with this, diclofenac shifted glucose flux into TCA metabo- lites and enhanced respiration. Metabolic flexibility was also observed in vivo in a murine mouse melanoma model. Here, tumor-infiltrating CD8
+T cells subjected to hypoglycemia switched to fatty acid catabolism, resulting in preserved effector functions (Zhang et al., 2017).
Glycolysis has been demonstrated to be important for T cell effector functions for the following two reasons: (1) LDHA activ- ity allows acetyl-coenzyme A (CoA) generation in the cyto- plasm, which is necessary to enhance histone acetylation and, thereby, transcription of IFNg (Peng et al., 2016); and (2) glycolytic activity hinders glyceraldehyde-3-phosphate dehy- drogenase (GAPDH) binding to the 3
0UTR of IFNg mRNA, thereby allowing translation (Chang et al., 2013). Targeting MCTs does not necessarily interfere with those two pathways, as glucose is still converted by GAPDH and LDHA to lactate, although to a lower extent.
Finally, diclofenac treatment of tumor cells augmented anti- PD-1-mediated T cell killing of melanoma cells in vitro. In line with this, diclofenac was capable of increasing the response to single anti-PD-1 blockade in B16 melanoma in vivo but only slightly and transiently improved dual-checkpoint therapy with anti-PD-1 and anti-CTLA-4. The same effect was observed for lumiracoxib. As already suggested by our in vitro results, NSAIDs did not negatively affect T cell infiltration and activation, as higher numbers of PD-1
+CD8
+T cells and IFNg expressing CD3
+T cells were detected under checkpoint therapy. Moreover, the number of NK cells was increased.
Both NSAIDs partially increased the intratumoral pH but not to the level detected in a genetic model displaying low glycolysis and PET activity due to LDHA and LDHB knockout. In this B16 LDH
/model, checkpoint blockade controlled tumor growth and the number and activity of effector T cells was significantly increased compared to checkpoint-treated B16 WT tumors.
Similar results were obtained with single-LDHA knockdown (Da- neshmandi et al., 2019). These data suggest that PET activity might represent a feasible biomarker to stratify patients for checkpoint therapy. Patients with high glycolytic activity could benefit from a combination therapy including anti-glycolytic treatment plus checkpoint inhibition.
The combination of diclofenac with dual anti-PD-1 and anti- CTLA-4 therapy was even more effective in 4T1 tumors. Diclofe- nac alone impaired tumor growth and augmented the response to checkpoint inhibition. As observed in B16 WT tumors diclofe- nac treatment increased intratumoral pH and elevated the portion of NK cells. Furthermore, in 4T1 tumors, diclofenac treat- ment resulted in higher levels of tumor-infiltrating CD45
+immune
(F) Representative FACS blots showing expression of PD-L1, MHC-I, and MHC-II after 72 h of treatment. Isotype staining is shown (filled gray).
(G–M) 1 3 10
64T1 cells were injected subcutaneously into BALB/c mice. NSAID and checkpoint inhibitor treatment was started on day 6. Diclofenac was applied i.p. twice a day (7.5 mg/kg) and aspirin (ASA) by addition to the drinking water at 600mg/mL for 14 d; anti-PD-1 and anti-CTLA-4 antibodies were administered i.p.
at a concentration of 10 mg/kg every 3–4 day for 1 week.
(G) Growth curves of vehicle-, diclofenac-, or aspirin-treated tumors are shown (median, n = 14).
(H) pH in 4T1 tumors was measured either at 1 or 2 mm depth (median, each symbol represents an individual tumor).
(I and J) Percentage of IFNg
+(I) and IL-2
+(J) cells among NK cells derived from 4T1 tumors was determined by flow cytometry (median, each symbol represents one individual tumor).
(K–M) Individual growth curves of 4T1 tumors treated either with (K) anti-PD1 and anti-CTLA-4 antibodies, (L) aspirin combined with anti-PD1 and anti-CTLA-4 antibodies, or (M) diclofenac in combination with anti-PD-1 and anti-CTLA-4 antibodies are shown.
See also Figure S7.
cells in vivo and reduced MCT1 and LDHA protein levels and increased MHC-I and MHC-II surface expression in vitro. This could probably contribute to the better response to checkpoint therapy under diclofenac treatment. In contrast to a previous study (Zelenay et al., 2015), single treatment with aspirin did not alter tumor growth and failed to improve the efficacy of checkpoint blockade. This could reflect the different tumor models used, while NSAIDs might have tumor-specific effects, or the differences in treatment regimens. In our study, aspirin was administered after tumors were already established, whereas Zelenay et al. (2015) administered aspirin prior to injec- tion of the tumor cells. As aspirin administration did not improve the efficacy of checkpoint therapy, COX inhibition might not be the primary cause for the positive impact of diclofenac on anti- PD1 and anti-CTLA-4 treatment.
Anti-tumor activity of diclofenac has been reported, and clin- ical trials were claimed (Pantziarka et al., 2016). We recently showed that topical administration of diclofenac in actinic kera- tosis, a pre-cancerous skin lesion, reduced lactate levels and increased IFNg expression in responders (Singer et al., 2019).
In line with this, the data of this study suggest that the main impact of diclofenac on checkpoint therapy is the upregulated IFNg expression in T and NK cells.
Taken together, our results suggest that diclofenac sup- ports an immune-cell-mediated anti-tumor response by re- programming tumor glycolysis. Drugs lowering glycolytic ac- tivity by MCT or LDH inhibition represent a promising strategy to improve the response to checkpoint therapy. Based on our results, summarized in Table S4, diclofenac might be even more potent in the human system. Murine tumor cells seem to be less susceptible to lactate lowering by diclofenac, prob- ably based on species-related structural differences in MCTs.
As diclofenac is well tolerated, especially when combined with pantoprazole, our study provides a rationale for phase 1 trials combining diclofenac with immunotherapeutics (patent pending).
STAR + METHODS
Detailed methods are provided in the online version of this paper and include the following:
d
KEY RESOURCES TABLE
d
LEAD CONTACT AND MATERIALS AVAILABILITY
d
EXPERIMENTAL MODEL AND SUBJECT DETAILS B Mice
B Human Subjects
B Cell Lines and in Vitro Cultures
d
METHOD DETAILS
B Analysis of Gene Expression in Human Melanoma Samples
B Reverse siRNA Transfection of Tumor Cells
B Generation of Flu-Antigen Specific CD8
+T Cells (FluT) B Luciferase-based Cytotoxicity Assay with Influenza-
specific CD8
+T cells B Real-time Live Cell Imaging
B Determination of MCT Transport Activity B T Cell Isolation, Stimulation and Culture
B In Vitro Analysis of CD8
+T Cells Cocultured with B16.SIY Tumor Cells
B Determination of Cell Size and Cell Number B Determination of Cytokines
B Determination of Glucose Metabolism B
13C
6-Glucose Tracer Analysis B Western Blot Analysis
B Monitoring of Oxygen Consumption and pH Develop- ment in Vitro
B Determining Tumor pH
B
18F-FDG micro-PET/magnetic Resonance Imaging B Preparation of Mouse Tissue for Flow Cytometry B Flow Cytometry
B Syngeneic Tumor Models B Histology
B Synthesis of tert-butyl 2-(2-((2,6-dichlorophenyl) amino)phenyl)acetate (Diclofenac tert-butyl ester, DtBE)
B Chemicals
d
QUANTIFICATION AND STATISTICAL ANALYSIS
d
![Figure 2. Diclofenac and Lumiracoxib Inhibit MCT1 and MCT4 Transport Activity (A and B) Indicated concentrations of diclofenac were washed in for 10 min, and relative rate of change in [H + ] i (D[H + ] i /Dt) was determined as induced by application of (A](https://thumb-eu.123doks.com/thumbv2/1library_info/3844048.1514473/5.904.88.574.146.966/diclofenac-lumiracoxib-transport-indicated-concentrations-diclofenac-determined-application.webp)