The potential of high resolution regional reanalyses COSMO-REA for renewable
energy applications
Inaugural-Dissertation
zur
Erlangung des Doktorgrades
der Mathematisch-Naturwissenschaftlichen Fakultät der Universität zu Köln
vorgelegt von
Christopher W. Frank
aus Bad Honnef
Köln, 2019
Prof. Dr. Roel A.J. Neggers
Tag der mündlichen Prüfung: 15.01.2020
Für meinen Sohn Leonas Lars, seine Generation und alle Folgenden.
Contents
1 Introduction 1
1.1 Motivation . . . . 1
1.2 Contribution within this thesis . . . . 2
2 Material and methods 7 2.1 Regional reanalyses COSMO-REA6 and COSMO-REA2 . . . . 7
2.2 PV simulation chain . . . . 9
2.2.1 Module orientation estimate . . . . 9
2.2.2 Transposition model to plane of array . . . . 12
2.2.3 PV simulation model . . . . 14
3 Bias correction of a novel European reanalysis data set for solar energy applications 17 3.1 Introduction . . . . 18
3.2 Data sets . . . . 20
3.2.1 COSMO-REA6 . . . . 20
3.2.2 ERA-Interim . . . . 22
3.2.3 MERRA-2 . . . . 23
3.2.4 Surface measurements . . . . 23
3.3 Assessment of COSMO-REA6 GHI . . . . 26
3.4 GHI post-processing . . . . 29
3.5 Evaluation of the new GHI data set . . . . 32
3.5.1 Marginal distribution . . . . 33
3.5.1.1 Separate evaluation for clear sky and cloudy conditions . . . . . 33
3.5.2 Joint distribution . . . . 34
3.5.3 Cross-validation of the new GHI data set . . . . 35
3.5.4 Daily mean values . . . . 37
3.5.4.1 Comparison to previous studies . . . . 37
3.5.5 Spatio-temporal representation . . . . 38
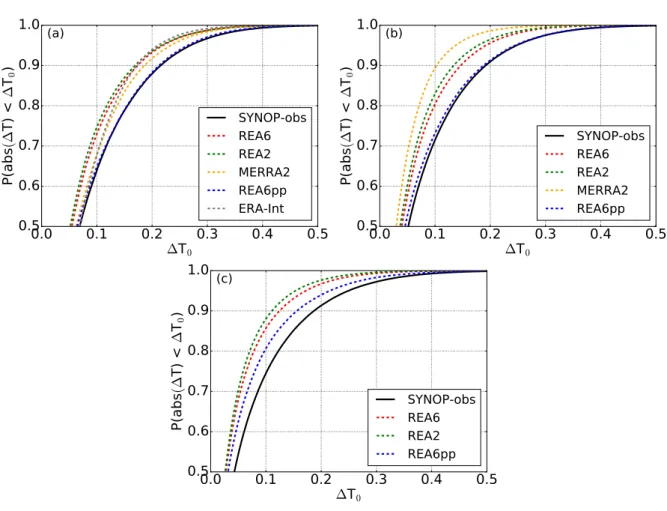
3.5.6 Ramp rates . . . . 40
3.6 Summary . . . . 41
3.7 Conclusion . . . . 43
4 The added value of high resolution regional reanalyses for wind power applications 45 4.1 Introduction . . . . 46
4.2 Reanalyses and observations . . . . 48
4.2.1 High resolution regional reanalyses . . . . 48
4.2.2 Global reanalyses . . . . 49
4.3 Methods . . . . 52
4.3.1 Matching of model and measurements . . . . 52
4.3.2 Uncertainty estimates . . . . 53
4.3.3 Vertical extrapolation of measurements . . . . 55
4.3.3.1 Wind extrapolation set-up . . . . 56
4.4 Results . . . . 57
4.4.1 Marginal distributions . . . . 57
4.4.1.1 Wind speed . . . . 57
4.4.1.2 Temporal wind speed changes . . . . 58
4.4.1.3 Vertical wind speed gradients . . . . 60
4.4.1.4 Low wind persistence . . . . 62
4.4.2 Joint distributions . . . . 65
4.4.2.1 Bias and bias corrected MAE . . . . 65
4.4.2.2 Correlations . . . . 65
4.4.2.3 Stability dependent validation . . . . 66
4.4.3 Accumulated relative power estimates . . . . 71
4.5 Discussion . . . . 73
4.6 Conclusion . . . . 74
4.7 Annex . . . . 76
5 Hybrid wind-solar balancing effects: An European study using post-processed re- gional reanalysis 79 5.1 Introduction . . . . 79
5.2 Material and methods . . . . 83
5.2.1 Regional reanalysis for PV and wind power estimates . . . . 83
5.2.2 Post-processing of COSMO-REA6 direct and diffuse radiation components 84 5.2.3 PV reference data . . . . 87
5.2.4 PV fleet information . . . . 87
5.2.5 PV simulation set-ups . . . . 88
5.3 Results . . . . 89
5.3.1 The added value of post-processed irradiance for PV power estimates . . 89
5.3.1.1 Assessment of post-processed radiation components . . . . 91
5.3.1.2 PV estimates with and without post-processed radiation compo- nents . . . . 95
5.3.1.3 Summary and discussion . . . . 96
5.3.2 Assessment and calibration of real fleet PV power simulations . . . . 98
5.3.2.1 Assessment with Open Power System Data . . . . 99
5.3.2.2 Calibration . . . 100
5.3.2.3 Variability assessment . . . 103
5.3.2.4 Summary and discussion . . . 104
5.3.3 Balancing effects and potentials of hybrid wind-solar production . . . 106
5.3.3.1 Inland balancing . . . 107
5.3.3.2 Cross-border balancing . . . 111
5.3.4 Discussion . . . 116
5.4 Conclusion . . . 117
5.5 Annex . . . 120
6 Conclusions and Outlook 123 6.1 Conclusions . . . 123
6.2 Overall picture and outlook . . . 127
Bibliography 129
Danksagung 141
Atmospheric reanalyses, a synthesis of meteorological observations and weather models, provide best estimates of past weather information in a physically consistent way on a temporal and spatial grid. These characteristics make reanalyses an established tool for a variety of weather related applications. In the field of renewable energies reanalyses are used to simulate production variabilities of existing or theoretical power plants and their impact on the energy system, which leads to a steadily growing interest in such products.
However, the application potential of reanalyses depends highly on their ability to describe at- mospheric phenomena accurately. Thus, with each new reanalysis product assessment studies of its potential for specific applications becomes necessary. At this point, the thesis at hand contributes to assess the accuracy of reanalyses with respect to renewable energy applications.
Herein, the novel high resolution regional reanalyses COSMO-REA6 and COSMO-REA2 de- veloped within the Hans-Ertel-Centre for weather research at the German weather service are assessed, post-processed, and further exploited for renewable energy related applications.
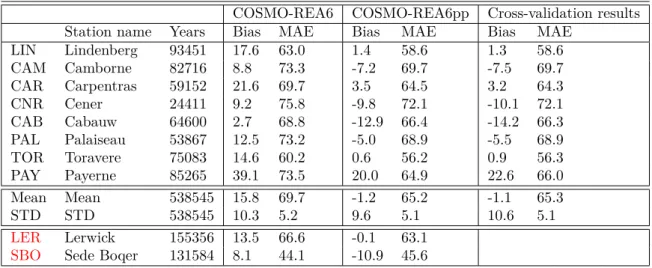
The first part investigates global horizontal irradiance (GHI), which is relevant for photovoltaics (PV). In order to assess which reanalysis provides best estimates of GHI, the two regional reanalyses are compared comprehensively to measurements as well as to the frequently used global reanalyses ERA-Interim and MERRA-2. Here, multiple validation metrics like the bias, the root mean square error and the correlation show that the COSMO reanalyses significantly outperform the global reanalyses. For instance, the median bias of daily average GHI is shown to be improved from about 10 Wm
−2for global reanalyses to roughly 3 Wm
−2in COSMO- REA6. Beside the bias, in particular variance related scores are found to be improved in the higher resolved products. Especially a spatio-temporal representativity study which investigates the representation of spatial cloud distributions shows significant improvements regarding the regional products.
However, the comparisons of the GHI from the COSMO reanalyses to measurements reveal sys-
tematic shortcomings in the reanalyses: (1) an underestimation of GHI in clear sky situations
and (2) an overestimation of GHI in cloudy sky situations. Motivated by the need for reliable
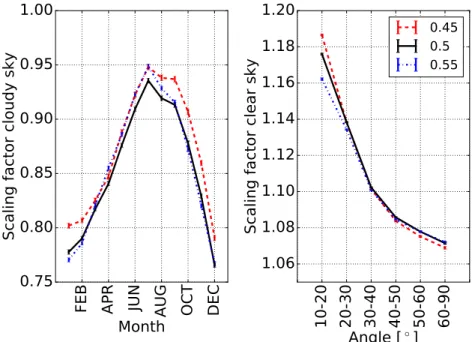
radiation information in the PV sector a cloud dependent post-processing is developed. Therein,
GHI values are scaled by either clear or cloudy sky specific adjustment factors. The factors are
determined by applying orthogonal distance regressions between modeled and measured GHI
for the two different cloud regimes. With systematic bias improvements by the post-processing
in clear sky from roughly -47 Wm
−2to -2 Wm
−2and in cloudy sky from 15 Wm
−2to -1 Wm
−2significant improvements are achieved. Further, the post-processed GHI significantly improves
temporal ramp rates which are of special interest for the energy sector in order to estimate power
variations over time. A central advantage of the developed post-processing method is its appli- cability to the entire reanalysis domain. A cross-validation exhibits a significant improvement of the post-processed GHI also at independent locations.
The second main study of this thesis complements the radiation assessment by a wind speed assessment. A comprehensive evaluation of wind speed from regional reanalyses compared to global reanalyses is conducted. Here, reference measurements of wind speed obtained from four wind towers with maximum measurement heights up to 280 m in Central Europe are used. Main improvements from the global to the regional reanalyses are found for the representation of ramp rate- and vertical wind gradient distributions. Considering joint distribution scores like the bias, mean absolute error, and the correlations most significant improvements are found close to the ground or at sites where surface effects are more prominent.
With the confidence gained from the first two parts, that the regional reanalyses add information to the global reanalyses products, the third study focuses on European wide balancing potentials of wind and solar power by using COSMO-REA6. The central goal is to determine to which extend decorrelations of wind and PV can balance extreme situations on a country-wise level, but also across different countries in Europe. Therefore, fixed fleet distributions of wind- and PV plants are simulated for the time period 1995-2014. An additional scaling of the installed capacities of the different technologies gives the opportunity to further investigate balancing potentials in an optimized PV to wind allocation ratio scenario. The simulations show that the potential of variability reductions of hybrid wind-PV production caused by decorrelations of wind and PV power varies between 29 and 42% per country, with a slight tendency to higher potentials for northern than for southern countries. The corresponding optimized ratios of installed capacity between wind and PV are found to vary between 32-42% for the former and 58-68% for the latter technology. Moreover, a simultaneous extreme production analysis of wind and PV from country to country showed high cross-border balancing potentials in Europe.
Highest probabilities of simultaneous wind and PV extremes between countries are mainly less than 10%.
To summarize, all studies in this work show that the novel regional reanalyses bring an additional
value for the renewable energy sector compared to global reanalyses products. Thus, this thesis
provides a solid basis for the user community of reanalyses to decide which reanalysis might be
the best for the particular application.
Atmosphärische Reanalysen, eine Synthese aus meteorologischen Beobachtungen und Wetter- modellen, liefern beste Schätzungen vergangener Wetterinformationen auf physikalisch konsis- tente Weise in einem zeitlichen und räumlichen Raster. Diese Eigenschaft macht Reanalysen zu einem etablierten Werkzeug für eine Vielzahl von wetterbezogenen Anwendungen. Im Bereich der erneuerbaren Energien, welcher ein stetig wachsendes Interesse an Reanalysen zeigt, wer- den Reanalysen beispielsweise zur Simulation von Produktionsvariabilitäten bestehender oder theoretischer Kraftwerke sowie deren Auswirkungen auf das Energiesystem genutzt.
Das Anwendungspotenzial von Reanalysen hängt jedoch von ihrer Fähigkeit ab, atmosphärische Phänomene genau zu beschreiben. So werden mit jeder neuen Reanalyse Produktbewertungsstu- dien über ihr Potenzial für spezifische Anwendungen notwendig. An dieser Stelle setzt die vor- liegende Arbeit an. Die aktuellen hochauflösenden und regionalen Reanalysen COSMO-REA6 und COSMO-REA2, die im Hans-Ertel-Zentrum für Wetterforschung beim Deutschen Wetter- dienst entwickelt wurden, werden bewertet, post-prozessiert und für Anwendungen im Bereich der erneuerbaren Energien genutzt.
Der erste Teil untersucht die für die Photovoltaik (PV) relevante globale horizontale Bestrahlungsstärke (GHI). Um zu beurteilen, welche Reanalyse die besten Schätzungen des GHI liefert, werden die regionalen Reanalysen umfassend mit Messungen sowie mit den etablierten globalen Reanalysen ERA-Interim und MERRA-2 verglichen. Hier zeigen mehrere Validierungsmetriken wie der Bias, der Root Mean Square Error und die Korrelation, dass die COSMO-Reanalysen die globalen Re- analysen deutlich übertreffen. Der Bias von GHI Tagesmitteln beispielsweise verbesserte sich von ca. 10 Wm
−2in den globalen auf etwa 3 Wm
−2in den regionalen Reanalysen. Neben dem Bias werden vor allem varianzbezogene Scores in den höher aufgelösten Produkten verbessert.
Insbesondere eine raumzeitliche Repräsentativitätsstudie, die basierend auf GHI-Korrelationen die Darstellung räumlicher Wolkenverteilungen untersucht, zeigte signifikante Verbesserungen von den globalen zu den regionalen Produkten.
Die Evaluierung des GHI der COSMO-Reanalysen mit Messungen zeigt jedoch verbleibende systematische Mängel: (1) eine Unterschätzung des GHI in Situationen mit "wolkenfreiem"
Himmel und (2) eine Überschätzung des GHI in Situationen mit "bewölktem" Himmel. Mo-
tiviert durch den Bedarf an zuverlässigen Strahlungsinformationen, insbesondere im PV-Bereich,
wird hier eine wolkenabhängiges post-processing entwickelt. Darin werden die GHI-Werte mit
einstrahlungsabhängigen Anpassungsfaktoren skaliert. Die Faktoren werden durch die Anwen-
dung orthogonaler Distanzregression zwischen modelliertem und gemessenem GHI für die bei-
den verschiedenen Wolkenregime bestimmt. Mit systematischen Bias-Verbesserungen durch die
Nachbearbeitung von ca. -47 Wm
−2auf -2 Wm
−2im Falle klarer Himmelssituationen und von
15 Wm
−2auf -1 Wm
−2in bewölkten Situationen werden signifikante Verbesserungen erzielt.
Darüber hinaus zeigt die nachbearbeitete GHI auch eine signifikante Verbesserung zeitlicher Variabilität, die für den Energiesektor von besonderem Interesse ist, um Erzeugungsschwankun- gen abzuschätzen. Ein zentraler Vorteil der entwickelten Nachbearbeitungsmethode ist ihre Anwendbarkeit auf die gesamte Reanalysedomäne. Eine Kreuz-Validierung zeigt, dass die Nach- bearbeitung des GHI auch an unabhängigen Standorten signifikante Verbesserung erzielt.
Im zweiten Hauptteil dieser Arbeit wird eine umfassende Bewertung der Windgeschwindigkeit aus regionalen Reanalysen im Vergleich zu globalen Reanalysen durchgeführt. Hierbei werden Referenzmessungen der Windgeschwindigkeit von vier etablierten Windtürmen mit maximalen Messhöhen von bis zu 280 m in Mitteleuropa verwendet. Im Vergleich zu den globalen Reanal- ysen zeigen die regionalen Reanalysen, insbesondere in den Verteilungen von zeitlichen Win- drampen und vertikalen Windgradienten, signifikante Verbesserungen. Unter Berücksichtigung gemeinsamer Verteilungskennzahlen wie dem Bias, mittlerer absoluter Fehler und Korrelationen zeigen sich die signifikantesten Verbesserungen vor allem in Bodennähe und in Gebieten mit vergleichsweise komplexen Oberflächeneffekten.
Mit den Erkenntnissen der ersten beiden Teile, dass die regionalen Reanalysen im Vergleich zu den globalen Reanalysen einen signifikanten Mehrwert liefern, konzentriert sich die dritte Studie auf europaweite Ausgleichspotenziale der Wind- und Sonnenenergie unter Verwendung von COSMO-REA6. Zentrales Ziel ist es, festzustellen, inwieweit Dekorrelationen von Wind und PV Extremsituationen auf Länderebene, aber auch zwischen verschiedenen Ländern in Eu- ropa ausgleichen können. Hierzu werden für den Zeitraum 1995-2014 feste Flottenverteilungen von Wind- und PV Anlagen auf Länderebene simuliert. Eine Skalierung der Installationska- pazitäten der einzelnen Technologien bietet die Möglichkeit, die Ausgleichspotenziale in einem optimierten PV/Wind Installationsverhältnis zu untersuchen. Die Simulationen zeigen, dass das Potenzial von Variabilitätsreduktionen der hybriden Wind-PV-Produktion durch Dekorrelatio- nen von Wind und PV-Leistung zwischen 29 und 42% pro Land liegt, mit einer leichten Tendenz zu höheren Ausgleichspotenzialen in nördlichen im Vergleich zu südlichen europäischen Ländern.
Die entsprechenden optimierten Installationsverhältnisse zwischen Wind und PV variieren zwis- chen 58-68% für Solar und 32-42% für Wind. Darüber hinaus zeigt eine Produktionsanalyse von Wind und PV hohe grenzüberschreitende Ausgleichspotenziale von Land zu Land in Eu- ropa. Die höchsten Wahrscheinlichkeiten für gleichzeitige Wind- und PV-Extreme zwischen den Ländern liegen in der Regel unter 10%.
Zusammenfassend lässt sich sagen, dass alle Studien in dieser Arbeit zeigen, dass die neuartigen
regionalen Reanalysen einen Mehrwert für den Sektor der erneuerbaren Energien im Vergleich
zu globalen Reanalyseprodukten darstellen. So bietet diese Arbeit eine solide Grundlage für die
Anwender-Community von Reanalysen um zu entscheiden, welche Reanalyse die beste für die
jeweilige Anwendung sein könnte.
1
1 Introduction
1.1 Motivation
Reanalyses represent the synthesis of state-of-art numerical weather prediction (NWP) models with weather observations and provide best estimates of the past weather. Herein, the NWP model combines a multitude of arbitrarily distributed observations in a physically consistent way and complements the observations by all other meteorological relevant variables on an ho- mogeneous spatial and temporal grid. With this characteristic reanalyses provide a prerequisite for a variety of climate related questions. Examples are: How do global temperature, precipita- tion or weather characteristics change over time and how are these changes spatially distributed [e.g. Simmons et al., 2017; Lan et al., 2019]. But when thinking one step further, reanalyses also provide a profound basis for many more weather related application questions. Of special interest for this thesis is the potential of reanalyses to answer questions related to renewable energies. With novel reanalyses products, namely COSMO-REA6 [Bollmeyer et al., 2015] and COSMO-REA2 [Wahl et al., 2017], these particularly high resolved products are investigated with respect to their added information for the energy sector (PV and wind) in comparison to already existing reanalyses and observations. Moreover, the new product COSMO-REA6 is exploited in terms of European balancing potentials of wind and photovoltaic (PV) power.
COSMO-REA6 and COSMO-REA2 are novel high resolution regional reanalyses developed within the Hans-Ertel-Centre (HErZ) for weather research [Simmer et al., 2016]. Compared to conventional reanalyses, so called global reanalyses which come at relatively coarse resolu- tion (30-100 km), the novel regional reanalyses are developed with significantly reduced grid spaces of 6 km and 2 km, respectively. The advantage of the finer resolution is the potential to resolve weather phenomena on smaller scales (especially mesoscale) and therefore to estimate realistic local atmospheric conditions with improved reliability. The assessment of this expected improvement is one central objective of this work.
With the release of first European regional reanalyses products only a few years ago in 2014
[Bollmeyer et al., 2015], most studies today still rely on the well established global reanalyses,
at least in the wind power sector [e.g. Staffell and Pfenninger, 2016; Ritter et al., 2015; Cannon
et al., 2014]. The reason for the excessive use of reanalyses for wind power estimates is the need
for spatially resolved wind information at typical hub-heights (50-150 m above ground) which
is up to now only covered by reanalyses products. Thus, with reanalyses spatially resolved site
assessment studies for wind turbines become possible. In the field of solar power reanalyses
have been less often used [e.g. Boilley and Wald, 2015]. The reason for this is the availability
of alternative products, i.e. gridded radiation estimates derived from satellite observations.
Different studies showed by direct comparison with ground based observations that satellite products are more reliable than global reanalyses estimates [Jia et al., 2013]. Yet, with the availability of new regional reanalyses it has to be investigated whether this conclusion holds also for these higher resolved products.
Beside site assessment studies, a central reason for the interest of the energy sector in reanalyses is the problem of destabilizing effects on the electricity system by highly variable renewable energies [VRE, Graabak and Korpås, 2016]. The basic prerequisite for a reliable energy supply is the steadily guaranteed balance between power supply and power demand. Thus, when replacing steerable energy suppliers by weather dependent VRE technologies the power system needs to be adapted towards the possibility to balance VRE induced over- and under supplies.
While for current shares this issue is a manageable problem, further expansions of VRE are expected to aggravate the risk of destabilizing and therefore enforces the need for technical adaptations like storage expansions or improved exploitation of balancing potentials of the VRE technologies [Graabak and Korpås, 2016]. Especially, potential studies of balancing effects of wind and solar forced power are expected to benefit from reanalyses as they are the only source providing physically consistent time-series of VRE relevant variables. Thus, reanalyses provide the opportunity to simulate and investigate consistent wind and PV power scenarios.
The central aim of the thesis at hand is to supply fundamental information on renewable energy characteristics based on regional reanalyses. Therein three conducted studies act in principle three fold. They provide...
• new insights of the applicability of the reanalyses. That means by analyzing the quality of wind and solar radiation provided by the COSMO reanalyses, new insights in terms of their application potential to solve VRE related problems is generated.
• improvements . Meaning, radiation estimates from the newest regional reanalyses are post- processed in order to improve the reliability of future PV studies based on reanalyses.
• hints on the balancing potentials of wind and solar power on an European scale.
1.2 Contribution within this thesis
To address the overall aim three studies presented in three chapters were conducted. While
the first two studies focus on the quality assessment and on the post-processing of VRE related
variables of COSMO-REA6 and COSMO-REA2 the third exploits the post-processed reanalyses
in terms of wind and PV power balancing potentials in Europe. The following Sections provide
an overview and detailed introduction of the individual studies.
1.2 Contribution within this thesis 3
Study I - Radiation study
The first study (Frank et al. [2018], Ch. 3) deals with the comprehensive assessment and post-processing of the global horizontal irradiance (GHI) provided by both COSMO reanalyses.
Therein, the regional as well as global reanalyses are compared to high quality ground measure- ments obtained from the baseline surface radiation network [BSRN, Ohmura et al., 1998], and from SYNOP stations of the German weather service.
The assessment of regional reanalyses compared to global reanalyses is conducted by the use of the well established global reanalyses ERA-Interim [Dee et al., 2011] and MERRA-2 [Molod et al., 2015]. With horizontal resolutions of about 80 km and 50 km, respectively, these reanal- yses are much coarser resolved than the COSMO reanalyses and therefore not able to resolve mesoscale processes that are relevant for cloud simulations and therefore for PV simulations.
ERA-Interim is of special interest as it is the product which provides boundary conditions for the limited area reanalysis COSMO-REA6. Thus, in comparison to ERA-Interim the added value can only be caused by the changed resolution or by different data assimilation methods.
MERRA-2 is used as it is one of the most established reanalyses in the energy sector [e.g. Zhang et al., 2018; Pfenninger and Staffell, 2016].
By investigating the performance of the COSMO reanalyses, systematic deficits in GHI due to clouds and aerosols were found that lead to the development of a post-processing scheme for GHI provided by COSMO-REA6. The focus on COSMO-REA6 is motivated by its coverage of whole Europe and the goal to study European wide balancing potentials of wind and PV power.
For the validation of the performance of the post-processed GHI fields compared to the original reanalyses product a cross-validation assessment is applied. Moreover, the global reanalyses as well as the regional reanalyses and the post-processed product are assessed and discussed in their potential to answer energy related questions. Especially the reanalyses potential to represent temporal GHI changes (ramp rates) are in detail investigated and discussed.
The central questions addressed in this study can be summarized to:
1. How accurate is COSMO-REA6 GHI with respect to ground observations?
2. Does COSMO-REA6 GHI improve compared to global reanalyses, i.e. ERA-Interim and MERRA-2, in bias and variability metrics?
3. Can the systematic biases found in COSMO-REA6 be corrected with a post-processing
algorithm?
Study II - Wind study
The second study (Frank et al. [2019], Ch. 4) assesses wind speed profiles provided by the COSMO reanalyses and compares its performance to that of the global reanalyses ERA-Interim and MERRA-2. A second central point of the study is to assesses the application potentials of the COSMO-REA products in the field of site assessment for wind power plants.
Similar to study I, one of the main goals of this study is to investigate whether the COSMO reanalyses better represent already existing and well established reanalyses products. Therefore, vertically resolved wind speed measurements obtained from four well established meteorological towers in central Europe are used as reference. Like in study I, the COSMO reanalyses are compared to the reanalysis providing boundary conditions (ERA) which gives the opportunity to investigate the added value of resolution. The comparison of the COSMO-REA products to MERRA-2 is of special interest as MERRA-2 is one of the most often used reanalyses in wind power related studies [e.g. Pfenninger, 2017; Cannon et al., 2014]. The reason for the frequent use of MERRA-2 in VRE studies can be found in the unique characteristic of MERRA- 2 compared to other global reanalyses to provide wind information with hourly resolution, at least for the specific heights of 10 m and 50 m above ground level. Other global reanalyses provide the meteorological output fields in intervals of six or three hours which is also the case for the general output of MERRA-2. Note, the general output interval of the COSMO reanalyses is hourly (3D fields) down to quarter hourly (2D fields) [Bollmeyer, 2015].
For the assessment of the reanalyses products typical statistical wind power metrics are applied.
In addition to common metrics, the study also comprises investigations on the ability of reanal- yses to represent ramp rates (i.e. wind speed changes in defined time windows), persistent low wind situations, and vertical wind gradients. These three metrics are in particular motivated by the wind sector as they are closely related to power generation extremes.
A second focus of the study is the potential of the COSMO reanalyses for site assessment studies.
Economically accepted uncertainties in wind information used for site assessment correspond to that of vertically extrapolated wind measurements obtained from a tower with a minimum height of at least 2/3 of the target height [Fördergesellschaft Windenergie und andere Erneuerbare Energien, 2011]. This results in a minimum requirement for the quality of the reanalyses, which should at least correspond to that of the extrapolated estimates.
The main questions of this study can be summarized to:
1. How accurately do COSMO-REA6 and COSMO-REA2 reproduce realistic wind charac- teristics relevant for the energy sector?
2. Do regional reanalyses perform better in representing hub-height wind characteristics than
global reanalyses?
1.2 Contribution within this thesis 5 3. What is the application potential of reanalyses, especially for site assessment studies?
Study III - Balancing study of wind and PV power
Increasing shares of renewable energy come with destabilizing effects for the electricity system.
One possibility to reduce the destabilizing effect of wind and PV power is to adapt the electricity grid and the installed power fleet in order to exploit spatial but also wind-to-PV related balancing potentials in an optimal way. At this point, reanalyses become of special interest, as they have up to now been the only source providing both, wind and irradiance physically and spatially consistent. Thus, by applying conversion models to convert COSMO-REA output to wind and PV power, conclusions with respect to wind-PV balancing potentials can be drawn.
Given the lack of European hybrid wind-PV balancing potential studies with a focus on natural balancing effects based on one consistent reanalysis only, here the regional reanalysis COSMO- REA6 is exploited and used to tackle this issue (Cha. 5). Motivated by the structure of the electricity market and questions of practicability, conducted investigations are based on country level. A first necessary step to investigate balancing potentials of power quantities is the estimation of the respective quantities. Concerning wind power, the power estimates based on COSMO-REA6 conducted by Henckes et al. [2018] can be easily applied. In the case of PV, a new power data set for PV power plants distributed all over Europe is generated. For this issue a PV modeling chain based on the power conversion scheme developed by Huld et al. [2011] is applied (for details see Sec. 2.2).
By aiming to use most realistic irradiance estimates for PV power derivations used in the bal- ancing analysis, the first part of study III is concerned with the development of a post-processing of the radiation components, direct and diffuse radiation. As a result the components allow a precise estimation of the radiation on inclined PV module surfaces. With the development and application of the post-processed radiation components in the balancing potential investigation the central questions tackled in study III are:
1. Do PV power simulations profit from the developed post-processing of the COSMO-REA6 radiation components?
2. How do extremes smooth out per country when considering hybrid wind-solar production compared to individual source productions?
3. Do specific countries benefit more from hybrid production than other countries?
4. Which countries are particularly suited to balance the extremes of other countries?
7
2 Material and methods
This chapter serves to introduce the central reanalyses products COSMO-REA and to present the simulation chain to estimate PV power. While the individual approximations and applied models are already published methods, the specific assembly of the models and its application to COSMO-REA data is new.
2.1 Regional reanalyses COSMO-REA6 and COSMO-REA2
In this chapter the two regional reanalyses COSMO-REA6 [Bollmeyer et al., 2015] and COSMO- REA2 [Wahl et al., 2017] are introduced. The development of these two reanalyses was carried out within the "Hans-Ertel Centre for Weather Research - Climate Monitoring Branch" which is funded by the Federal Ministry of Transport and Digital Infrastructure (BMVI) of Germany.
The fixed model used for the developement of the two regional reanalyses are the COSMO forecast models operated at the DWD. In case of COSMO-REA6 the model COSMO-EU version 4.25.2 is used. In case of COSMO-REA2 version number 5.00.2 of the NWP model COSMO- DE is used. While the area covered by COSMO-REA6 comprises in principle whole Europe (CORDEX EUR-11), COSMO-REA2 is developed for an area covering generally Germany and border lands (extended COSMO-DE domain). The grid spacing of COSMO-REA6 is 6 km in horizontal and 40 layers in vertical direction. COSMO-REA2 comes with a 2 km horizontal resolution and 50 vertical layers. Temporally, COSMO-REA6 covers 23 years from 1995-2017 with continuous extension and COSMO-REA2 seven years from 2007-2013. Both reanalyses provide roughly 150 variables with hourly (3D variables) or quarter hourly (2D variables) output frequency.
Boundary conditions - spatial weather information to start and feed the regional models with boundary weather - are as typically provided by global or big brother reanalyses products. In case of COSMO-REA6 the initial- and boundary conditions are provided by the global reanalysis ERA-INTERIM [∼ 80 km horizontal resolution, 60 vertical layer Dee et al., 2011]. For COSMO- REA2 the initial- and boundary conditions are given by COSMO-REA6.
The synthesis of NWP forecasts with observations is conducted by the application of the so called nudging approach. Nudging is a continuous four dimensional data assimilation scheme which ad- justs the model state during the model integrations towards the observations (see Schraff [1997]).
Assimilated variables in COSMO-REA6 and COSMO-REA2 are the pressure, the temperature,
the wind, and the humidity. Observations sources are SYNOP stations, aircrafts, buoys, ra-
diosondes, wind profiler and ships (descending order). COSMO-REA2 contains an additional
latent heat nudging of weather radar measurements [Bollmeyer et al., 2015].
2.2 PV simulation chain 9
2.2 PV simulation chain
Estimating the power generation of PV modules is a multi-step procedure. The procedure varies with the given input variables, starting with horizontal direct radiation (Q
dir), horizontal diffuse radiation (Q
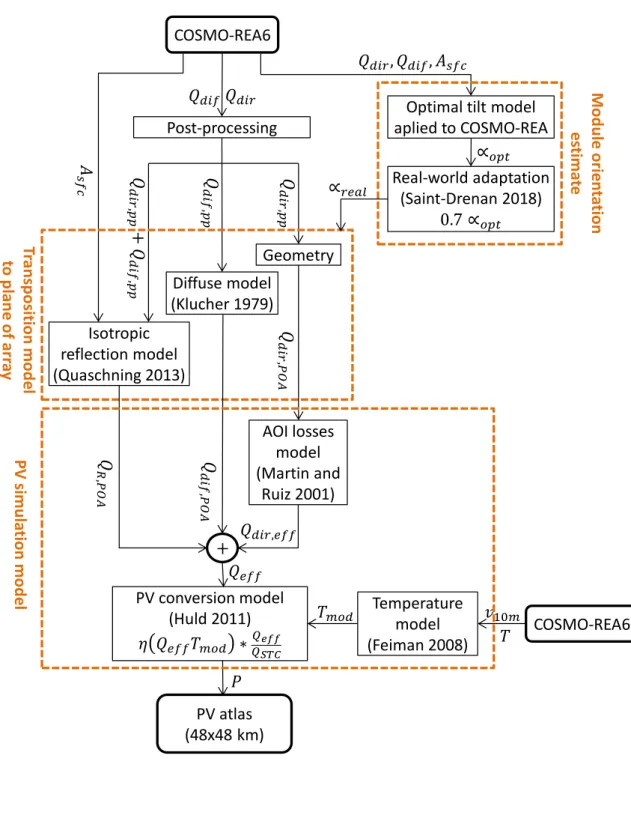
dif), and unknown metadata of PV module orientation the central steps can be split into three main parts: (1) Estimating real world module orientation, (2) transposing the horizontal radiation to the plane of array (POA) orientation, (3) simulating the power generation of the PV module (see Fig. 2.1). The following describes the individual steps in detail. In this respect, additionally, simple studies are presented in order to motivate applied assumptions and to assess related uncertainties.
2.2.1 Module orientation estimate
Aiming to simulate realistic power generation of PV modules at any place in Europe needs assumptions on the installation orientation of the PV modules. Even if power register data are given they often do not contain information about orientation. Especially, on European scale uniform collections with comprehensive information are difficult to access.
A first guess for realistic module orientations is the orientation which maximizes the incidental radiation at the POA. Recently, some studies compared these optimized orientation estimates with real world installations. Saint-Drenan et al. [2018] found the optimal real world tilt an- gles α
realto be significantly smaller than optimized orientation estimates α
opt. With detailed installation information of about 2% of the total number of PV plants in Germany they found a mean deviation of
α
real= 0.7 ∗ α
opt. (2.1)
Saint-Drenan et al. [2018] explained this deviation by an economic reason: Investors aim to maximize the power generation per unit of surface. Here, mainly caused by less shadow effects modules installed with decreased tilt angles are found to increase the total power production.
However, with a variety of dependencies like the land price, the solar resource and architectural characteristics the estimated factor 0.7 is known to vary from plant to plant [Saint-Drenan et al., 2018]. Therefore, recent studies started to estimate whole orientation distributions of real world installed PV modules [Saint-Drenan et al., 2018; Killinger et al., 2018]. However, due to the lack of studies examining the deviation factor and its variations at the European scale, here, as in [Saint-Drenan et al., 2018], a constant deviation factor of 0.7 is assumed.
Assumptions and methods applied in this thesis to estimate the optimal orientation are as
follows. With respect to the azimuth angle, motivated by simplicity, constantly southwards-
facing PV modules are assumed. The optimal tilt angle is estimated by maximizing the PV
generation. Therein, caused by computational efforts only the year 2014 of COSMO-REA6
𝑣
10𝑚𝑄
𝑒𝑓𝑓Post-processing
Optimal tilt model aplied to COSMO-REA Real-world adaptation (Saint-Drenan 2018)
0.7 ∝
𝑜𝑝𝑡Geometry
Diffuse model (Klucher 1979) Isotropic
reflection model (Quaschning 2013)
𝑄
𝑑𝑖𝑟𝑄
𝑑𝑖𝑓𝐴
𝑠𝑓𝑐𝑄
𝑑𝑖𝑟, 𝑄
𝑑𝑖𝑓, 𝐴
𝑠𝑓𝑐𝑄
𝑑𝑖𝑟,𝑝𝑝+ 𝑄
𝑑𝑖𝑓,𝑝𝑝𝑄
𝑑𝑖𝑓,𝑝𝑝𝑄
𝑑𝑖𝑟,𝑝𝑝Tr an sp o sit io n mo d el to p la n e o f arr ay Mod u le o rie n ta tio n e st ima te
∝
𝑜𝑝𝑡∝
𝑟𝑒𝑎𝑙𝑄
𝑑𝑖𝑟,𝑃𝑂𝐴𝑄
𝑑𝑖𝑓,𝑃𝑂𝐴AOI losses model (Martin and
Ruiz 2001) +
𝑄
𝑅,𝑃𝑂𝐴𝑄
𝑑𝑖𝑟,𝑒𝑓𝑓PV conversion model (Huld 2011) 𝜂 𝑄
𝑒𝑓𝑓𝑇
𝑚𝑜𝑑∗
𝑄𝑄𝑒𝑓𝑓𝑆𝑇𝐶
𝑃
P V s imu la tio n m o d e l
COSMO-REA6 COSMO-REA6
Temperature model
(Feiman 2008) 𝑇 𝑇
𝑚𝑜𝑑PV atlas (48x48 km)
Figure 2.1: Modeling chain to estimate PV power based on reanalysis data.
2.2 PV simulation chain 11
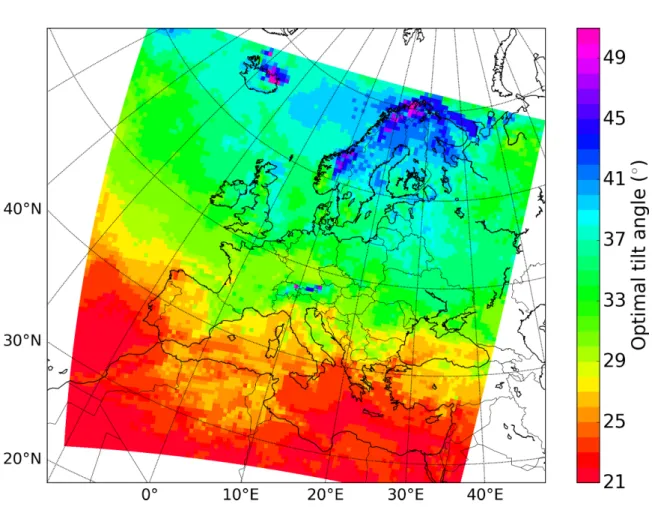
Figure 2.2: European distribution of optimal tilt angles estimated based on hourly radiation values of the year 2014 provided by COSMO-REA6.
radiation is used. Resulting optimal tilt angles vary between 21° and 50° (Fig. 2.2) in whole Europe which is in good accordance with the optimal tilt angles as available on the PV-GIS website (http://re.jrc.ec.europa.eu/pvgis/, illustrated by Saint-Drenan et al. [2018]). Also the general spatial distribution fits well. Larger differences only occur in the Asian area, where COSMO-REA6 derived optimal tilt angles are about 10° smaller.
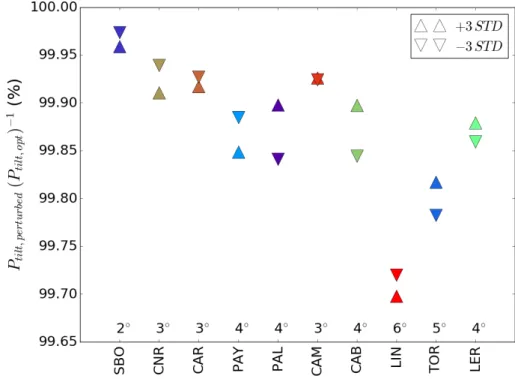
In order to estimate the error of power estimates when using optimal tilt angles derived from just one year (2014) instead of using multiple year derived optimal tilt angles a sensitivity study is performed at ten exemplary BSRN stations in Europe (for the exact locations see Fig. 3.1).
Therefore, three PV simulation runs are conducted: (1) A reference run with optimized tilt
angles estimated based on 20 year time-series, (2) a positive perturbed run with the 20 year
optimized angles perturbed by the simulated variation of single year optimal tilt estimates, and
(3) a related negative perturbed run. For simplicity the surface albedo is set to 0.2 and the wind
effects are ignored in this specific sensitivity study. Results show, maximum errors of aggregated
power estimates due to the consideration of just one year of data when estimating the optimal
tilt are below 0.35% (Fig. 2.3).
Figure 2.3: Relative aggregated power generation by using positive and negative perturbed optimal tilt angles with respect to the optimal tilt power generation at 10 BSRN sites. The sites are sorted by latitude from south to north. The numbers give the perturbation (three times the yearly standard deviation) per site in degree.
2.2.2 Transposition model to plane of array
The driving source of PV power is the irradiance on the tilted plane of the PV array. Thus, with radiation provided by reanalyses being typically the direct and diffuse radiation on the horizontal plain conversion models to tilted plains are necessary.
The irradiance to an arbitrary orientated plane Q
P OAcan be split in three parts
Q
P OA= Q
dir,P OA+ Q
dif,P OA+ Q
R,P OA(2.2) with Q
dir,P OAthe direct radiation, Q
dif,P OAthe diffuse radiation, and Q
R,P OAthe at the ground and surroundings reflected radiation to the plane of array. The following describes how the individual parts can be calculated or estimated, respectively.
The direct radiation component propagates in a ray, thus the POA component can be calculated geometrically. For further information see e.g. Quaschning [2013].
A variety of different models exist to calculate the diffuse radiation on the inclined plane. Here
the analytic model proposed by [Klucher, 1979] is used. The advantage of this model compared to
alternative models like those developed by Perez et al. [1986] (Perez-model) or Muneer [1990] is
its computational efficiency. All mentioned models follow the anisotropic assumption. Meaning
2.2 PV simulation chain 13
s n
Zenit
𝛾
𝑆𝜃
𝑔𝑒𝑛𝛼
𝛼
Nord
Figure 2.4: Angle overview of a tilted plane.
they assume for the upper hemisphere radiation a direction dependent distribution. Using the definition
F = 1 − ( Q
difQ
GHI)
2(2.3)
Klucher [1979] estimates the diffuse radiation on a plane tilted by the angle α by Q
dif,P OA= 1
2 Q
dif(1 + cos α)(1 + F sin
3α
2 )(1 + F cos
2θ
gencos
3γ
s) (2.4) with γ
sthe sun elevation, and θ
genthe angle between the normal POA vector (n) and the vector pointing to the sun (s, see Fig. 2.4).
In order to estimate the uncertainty of power estimates when using the more simple model from Klucher [1979] compared to the significant more complex model from Perez et al. [1986]
a sensitivity study was carried out by Henckes et al. [2019]. A full PV power simulation model was implemented twice, once by using the Klucher- and once by using the Perez scheme. The results showed temporally aggregated power estimates differing less than 1% when using either the one or the other model.
The radiation reflected from the ground is estimated by following Quaschning [2013] by using an isotropic approach which assumes an equal distributed radiation flux from all upper hemisphere directions. Thus, the radiation reflected from the ground which reaches the tilted plane is a function of the tilt angle α, the GHI and the surface albedo A
sf c:
Q
R,P OA= 0.5 Q
GHIA
sf c(1 − cos(α)). (2.5)
Note, that the albedo varies considerably with the environmental characteristic. Therefore,
considering domain averaged albedo (6x6 km in case of COSMO-REA6 input) might result in
significant simulation errors for individual modules. Nevertheless, the effect is expected to be negligible if a sufficient number of power plants are aggregated.
2.2.3 PV simulation model
Besides the dependency on the incidental irradiance, the final power generation of a PV module also depends on module specific characteristics. Here, three models are used to deal with these effects. The first model treats irradiance reflections at the module’s surface, the second estimates the temperature of the PV module as function of wind speed and ambient temperature, and the third model estimates the final power generation of the module considering technology dependent efficiency. Here, we focus on the silicon technology only, as they comprise the largest market share. Not considered are effects like spectral losses, shadow losses, snow losses, and dust or dirt losses. In accordance to Pfenninger and Staffell [2016], subsequent losses due to electricity components which are dominated by converter losses are roughly considered by assuming a constant electricity yield loss of 10%. The following describes the applied models to derive PV power estimates in detail.
In order to estimate the reflection losses at the module’s surface the so called angle of incidence (AOI) model proposed by Martin and Ruiz [2001] is used. Therein, reflection losses (AL) of the direct radiation component are estimated by
AL(θ
gen) = 1 −
1 − exp(−cos θ
gen/a
r) 1 − exp(−1/a
r)
(2.6) with a
rbeing an empirical dimensionless parameter describing the surface characteristic of the individual module. A comprehensive investigation conducted by Martin and Ruiz [2001] showed this coefficient (a
r) just slightly varying for different silicon modules. A rough value for typical silicon modules is a
r= 0.16 (see Tab. 1 in Martin and Ruiz [2001]). In accordance with Urraca et al. [2018] for the thesis on hand this value is assumed to be constant. Given the reflection losses as estimated in eq. 2.6, the effective radiation Q
ef fwhich is finally available for the photoelectric effect can be estimated by:
Q
ef f= (1 − AL) Q
P OA. (2.7)
A further module specific characteristic is the temperature dependent efficiency. To account for
this effect a first step is to estimate the modules temperature (T
mod). T
modis a function of the
ambient temperature, the incident irradiance and the wind speed. Given the wind speed v
10min
2.2 PV simulation chain 15 10 m above ground level (h
10m) wind speeds v
modat the module’s height h
modcan be estimated by (in accordance with Huld and Gracia Amillo [2015]):
v
mod=
h
modh
10m0.2
v
10m. (2.8)
Using the model of Faiman [2008] the modules temperature can be calculated as T
mod= T
amb+ Q
ef fU
0+ U
1∗ v
mod. (2.9)
Koehl et al. [2011] find the coefficients U
0and U
1just slightly varying with technology. For crystalline silicon modules they report values of U
0and U
1of 26.9 Wm
−2K
−1and 6.2 Wm
−3sK
−1, respectively.
The PV conversion model describes the performance of the PV module and estimates the ideal generated power P
idealas a function of the incident irradiance Q
ef fand the module’s tempera- ture T
mod. Here, the empirical model proposed by Huld et al. [2011] is used. The authors show good model performance for several different crystalline silicon PV technologies. Dittmann et al.
[2010] shows the model to be more accurate than alternative PV conversion models. The idea of the model is to multiply the theoretical power generation of the module under standard test conditions (STC) by factors which describe the instant deviation from the power production under STC conditions. The model has the form:
P
ideal(Q
0, T
0) = P
ST CQ
0η(Q
0, T
0) = P
ST CQ
0[1 + k
1ln(Q
0) + k
2(ln(Q
0))
2+k
3T
0+ k
4T
0ln(Q
0) + k
5T
0(ln(Q
0))
2+ k
6T
02]
(2.10) with
Q
0= Q
ef fQ
ST Cwith Q
ST C= 1000 W m
−2(2.11) and
T
0= T
mod− T
ST Cwith T
ST C= 25
◦C. (2.12) The coefficients k
1, k
2,..., and k
6are estimated by a least-square optimization of the model with real world observations of 18 crystalline silicon modules (see Table 2.1).
In a last step subsequent electricity component losses dominated by converter losses are con-
sidered by reducing P
idealby 10% [Pfenninger and Staffell, 2016]. According to Pfenninger and
Staffell [2016] this assumption is rather conservative, since the PV systems used for the converter
loss estimate are about 18 years old. Newer converter might work more efficient.
Table 2.1: For crystalline silicon modules optimized coefficients k
1to k
6used in Eq. 2.10 [Huld and Gracia Amillo, 2015]
k
1-0.17237
k
2-0.040465
k
3-0.004702
k
40.000149
k
50.000170
k
60.000005
17
3 Bias correction of a novel European reanalysis data set for solar energy applications
This chapter is based on: Frank, C. W., S. Wahl, J.D. Keller, B. Pospichal, A. Hense, S.
Crewell, 2018: Bias correction of a novel European reanalysis data set for solar energy applica- tions, Solar Energy, 164, 12-24, doi.org/10.1016/j.solener.2018.02.012
One of the major challenges during the transition phase of the energy system is to maintain the
balance between energy supply and demand. Rising questions are often related to site mapping,
variability, extremes and compensation effects for example. A fundamental source of information
to answer these questions are high quality data sets of renewable energy related variables. As
reanalyses provide all relevant data to assess wind and solar power generation over a long period
of time (decades) in a gridded consistent way, they exhibit great potential in the field of renew-
able energy. A new regional reanalysis is COSMO-REA6, which covers the European domain
over the years 1995-2014 with a horizontal resolution of about 6 km and a temporal resolution of
15 minutes. In this paper, we first assess the quality of the Global Horizontal Irradiance (GHI)
provided by COSMO-REA6. High quality GHI measurements obtained through the Baseline Sur-
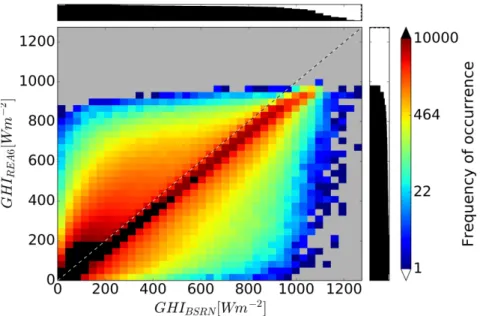
face Radiation Network (BSRN) are used as reference and reveal systematic short comings in
the reanalysis: (1) an underestimation of GHI in clear sky situations and (2) an overestimation
of GHI in cloudy sky situations. In order to reduce these systematic regime dependent biases, a
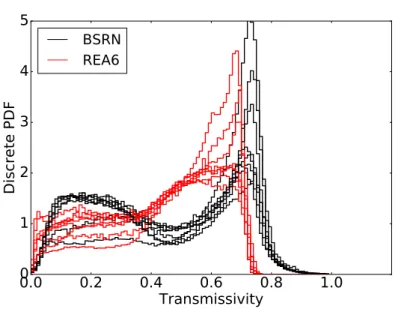
post-processing is developed. The applied post-processing method is a scaling based on orthogonal
distance regressions for two different regimes, i.e., "clear sky" and "cloudy sky". The two regimes
are distinguished by the use of a transmissivity threshold. The post-processed GHI shows a sig-
nificant reduction of the systematic biases and an improvement in representing the marginal
distributions. A spatial cross-validation shows the applicability to the whole model domain of
COSMO-REA6. Moreover, COSMO-REA6 as well as the post-processed GHI data reveal an
added-value when compared to global reanalysis ERA-Interim and MERRA-2. The higher res-
olution reanalysis exhibits a significantly better performance of representing GHI variability, as
well as biases, RMSE and other conventional scores. The post-processed GHI data are freely
available for download.
3.1 Introduction
For a sustainable planning of the transition towards renewable energy production, the assessment of the solar energy potential and its variability has become more and more important [Kleissl, 2013]. Due to the high spatial and temporal variability of solar radiation long-term data over large domains are necessary to identify potentials for the production of renewable energy and risks regarding the growing dependency on this form of power generation. In this respect also the co-variability of solar and wind energy becomes more important, as its anticorrelation is expected to balance the volatility of the individual sources to some extent [e.g. Bett and Thornton, 2016; Santos-Alamillos et al., 2012; Grams et al., 2017]. More extensive studies simulate the electricity network in order to study the electricity grid as a whole system. In this context, realistic meteorological data allow studying for example the future need of storage and/or back- up capacity [e.g. Heide et al., 2010; Mulder, 2014].
Traditionally, solar energy potential has been assessed from measured time-series of solar irradi- ance at ground level. This is limited in its geographical distribution especially if high temporal resolution (< 1 hour) and high quality measurements are concerned. Most frequently, the Global Horizontal Irradiance (GHI) also called Surface Solar Irradiance (SSI), is measured within the networks of meteorological services. A spatially extended view is provided by satellite estimates like the HelioClim project by MINES ParisTech [Blanc et al., 2011] or the SARAH (Solar sur- fAce RAdiation Heliosat) data set [Müller et al., 2015] produced by the Satellite Application Facility on Climate Monitoring (CM-SAF). They exploit geostationary satellite measurements to derive GHI for the full disk with up to hourly temporal and 0.05 degree spatial resolution.
Atmospheric reanalyses compiled from observations and numerical weather prediction models provide not only GHI but rather the complete state of the atmosphere including the vertical profiles of wind, temperature etc. in a physically consistent way. Therefore, these multi-year data sets which continually improve in resolution allow for a joint investigation of renewable energy resources [Bett and Thornton, 2016].
Global reanalyses that come at relatively coarse horizontal resolutions (40-100 km) are frequently
used for investigating wind power generation [e.g. Staffell and Pfenninger, 2016; Ritter et al.,
2015; Cannon et al., 2014; Kubik et al., 2013; Bett et al., 2013], but rarely for solar energy
application [e.g. Boilley and Wald, 2015; Richardson and Andrews, 2014]. One of the first
applications by Lohmann et al. [2006] revealed large differences among two global reanalyses
for monthly mean values at horizontal resolutions of about 200 km. When comparing two
state-of-the-art reanalyses and satellite derived (Helio-Clim-1) daily solar irradiance with surface
measurements across the globe Boilley and Wald [2015] find that a large part of the variability in
surface radiation is not captured by the reanalyses. A reason for the deviation between reanalysis
and measurements might arise from the difficulty to parameterize small scale processes related
to clouds and aerosols including interaction with solar radiation.
3.1 Introduction 19 The work of Richardson and Andrews [2014] indicated the potential of reanalyses in PV applica- tions. For Ontario, Canada, Richardson and Andrews [2014] evaluated the use of NASA’s global reanalyses MERRA [Rienecker et al., 2011] as input for PV modeling. They found that the mod- eled PV yields driven by MERRA results in just slightly higher errors than ground-measured driven results, despite relatively larger errors in the MERRA GHI data. Later, Pfenninger and Staffell [2016] showed a comparable performance of PV output simulations based on MERRA and MERRA-2 [Molod et al., 2015] compared to satellite estimates when aggregated to country- level.
One reason for the few studies using radiation from reanalyses for solar energy applications is the availability of the high quality satellite products. Many publications in the past are based on either solar or wind energy which caused the use of different data sources in the two fields. In the field of wind energy reanalyses products are frequently used [Rose and Apt, 2015] while for solar energy satellite products are found to be most accurate [Jia et al., 2013], at least compared to global reanalyses. To our best knowledge up to now high resolution regional reanalyses are not considered in the solar energy community. In recent times the question of co-variability and compensation effects of wind and solar energy become more and more important. Thus, the need of a common data source for both variables increased. Reanalyses provide wind and radiation in a physically consistent way in space and time. This is crucial for studying joint distributions, otherwise results and interpretation might be distorted due to physical inconsistencies. Using both variables from one source causes the question which reanalysis performs best in representing wind speed and radiation? This study addresses this question concerning the radiation part and takes regional reanalyses into account.
While global reanalyses mainly resolve clouds associated with synoptic disturbances, high reso- lution regional reanalyses have the potential to better describe smaller scale clouds associated with mesoscale processes like thunderstorms or orographic circulations and therefore are more suitable for solar energy applications. This paper investigates the quality of the novel European regional reanalysis COSMO-REA6 [Bollmeyer et al., 2015] available with a horizontal resolution of 6 km over a time period of 20 years and a temporal resolution of 15 minutes. Evaluation of COSMO-REA6 meteorological variables such as precipitation, temperature and wind speed [Wahl et al., 2017; Bollmeyer et al., 2015; Kaiser-Weiss et al., 2015; Borsche et al., 2016; Henckes et al., 2018] has already shown a superior performance with respect to the European Centre for Medium-range Weather Forecasting (ECMWF) Re-Analysis Interim data set [ERA-Interim, Dee et al., 2011] but the representation of radiation has not been addressed so far.
An even higher resolution data set is available for Central Europe with a horizontal grid spacing
of 2 km [COSMO-REA2, Wahl et al., 2017] albeit for a much shorter time period of seven years
(2007 to 2013). However, due to its larger range of applicability, e.g., cross-country energy
trading, we focus on the long-term European data set COSMO-REA6.
With this paper we focus on the following questions:
1. How accurate is COSMO-REA6 GHI compared to ground observations?
2. Does COSMO-REA6 GHI improve upon global reanalyses, i.e. ERA-Interim and MERRA- 2, in bias and variability metrics?
3. Can the expected biases and deviations be corrected with a post-processing algorithm?
In order to address these questions the paper is structured as follows. Section 2 describes the reanalysis and observational data sets. A quality assessment of GHI from reanalyses is given in Section 3 which reveals some systematic deficits under clear and cloudy conditions. Therefore a post-processing procedure to correct these issues is developed in Section 4. An evaluation, including a cross-validation, of the post-processed radiation fields is presented in Section 5.
Section 6 summarizes our findings followed by the conclusions in section 7.
3.2 Data sets
3.2.1 COSMO-REA6
COSMO-REA6 has been developed and produced within the Climate Monitoring Branch of the Hans-Ertel-Centre for Weather Research
1and is based on the COnsortium for Small-Scale Modelling (COSMO) limited-area model [Schättler and Doms, 2011], which is part of the opera- tional NWP model chain of the German Meteorological Service (DWD). It is a 20-year regional atmospheric reanalysis covering the European CORDEX EUR-11 domain with a horizontal res- olution of 0.055
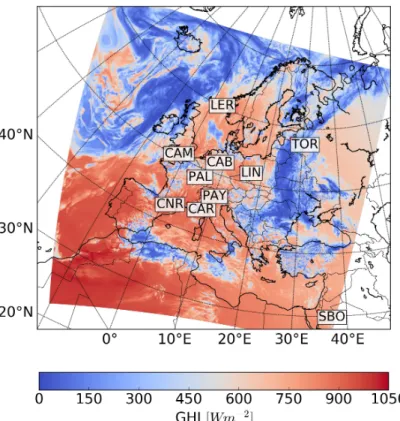
◦(approximately 6 km, see Fig. 3.1) and 40 vertical levels in terrain following coordinates. 3D model variables are archived every hour and 2D variables every 15 minutes.
The most important variables, e.g. GHI, wind speed at the six lowest model level, can be down- loaded via ftp (http://reanalysis.meteo.uni-bonn.de). In the reanalysis, a continuous nudging scheme is used to assimilate a wealth of observations into the model allowing for a detailed but temporally smooth representation of the prognostic variables [for further information the reader is referred to Bollmeyer et al., 2015].
The COSMO reanalyses uses the radiation scheme by Ritter and Geleyn [1992] based on the δ- two-stream approximation. The scheme is called every 15 min and calculates how solar radiation is modified in the atmosphere due to scattering and absorption by atmospheric gases, aerosol and clouds. The one dimensional radiative transfer is solved separately, once for the clear sky and once for the cloudy column which are subsequently combined according to cloud fraction.
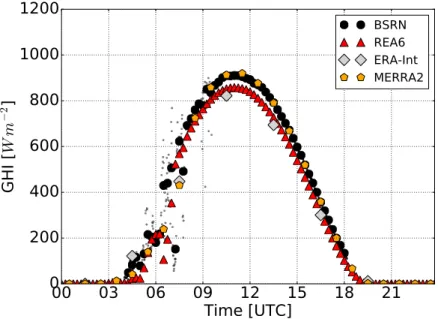
As the instantaneous distribution of clouds and water vapor are input to the radiation scheme, GHI reflects the strong dynamic variability of the atmosphere (Fig. 3.1).
1https://www.herz-tb4.uni-bonn.de