Conditional inactivation of the ubiquitin protein ligase Itch of the mouse
Inaugural-Dissertation zur
Erlangung des Doktorgrades
der Mathematisch-Naturwissenschaftlichen Fakultät der Universität zu Köln
vorgelegt von
Kristina Jönsson
aus Svedala, Schweden
September 2002
Berichterstatter: Prof. Dr. Alexander Tarakhovsky Prof. Dr. Thomas Langer
Tag der müntlichen Prüfung: 25 November 2002
To my parents Annagreta och Börge,
whose love and support made this work possible
A. INTRODUCTION... 3
A.1. REGULATION OF PROTEIN LEVEL BY DEGRADATION... 4
A.2. THE UBIQUITIN-PROTEASOME DEGRADATION PATHWAY... 5
A.3. UBIQUITIN PROTEIN LIGASES (E3)... 6
A.4. THE ITCH GENE AND PROTEIN... 8
A.5. POTENTIAL SUBSTRATES OF ITCH... 9
A.6. THE IMMUNE RESPONSE... 11
A.7. ACTIVATION OF TH CELLS IN THE IMMUNE RESPONSE... 13
A.8. TH1 VERSUS TH2 RESPONSE... 14
A.9. AUTOIMMUNITY AND SYSTEMIC INFLAMMATION... 15
A.10. CONDITIONAL GENE INACTIVATION... 17
A.11. AIMS OF THIS STUDY... 18
B. MATERIAL AND METHODS ... 19
B.1. BACTERIAL TRANSFORMATION... 19
B.2. ISOLATION OF PLASMID/BAC DNA ... 19
B.3. CLONING OF GENOMIC DNA ... 20
B.4. RESTRICTION ENZYME ANALYSIS... 20
B.6. SYNTHETIC OLIGONUCLEOTIDES... 20
B.7. PURIFICATION OF DNA FRAGMENTS... 20
B.8. DNA SEQUENCING... 20
B.9. ISOLATION OF GENOMIC DNA... 21
B.10. SOUTHERN BLOT ANALYSIS... 21
B.11. AMPLIFICATION AND PURIFICATION OF PROBES USED FOR SOUTHERN BLOT ANALYSIS... 22
B.12. RADIOACTIVE LABELING OF PROBES... 22
B.13. POLYMERASE CHAIN REACTION (PCR) ... 22
B.14. ISOLATION OF RNA ... 23
B.15. CDNA SYNTHESIS... 24
B.16. REVERSE TRANSCRIPT-PCR USING THE LIGHT CYCLER... 24
B.17. AMPLIFICATION OF ITCH CDNA FOR CLONING OF THE ITCH EXPRESSION VECTOR... 25
B.18. EXPRESSION AND PURIFICATION OF RECOMBINANT GST- ITCH FUSION PROTEIN... 25
B.19. WESTERN BLOT ANALYSIS... 25
B.20. IMMUNOHISTOCHEMISTRY... 26
B.21. ELISA ... 27
B.21.1. Isotype ELISA ... 27
B.21.2. Anti-DNA ELISA... 27
B.21.3. IFNg ELISA for serum... 27
B.21.4. IFNg and IL-4 ELISA for cell culture supernatant... 27
B.22. GENERATION OF MUTANT MICE... 28
B.22.1. Embyonic Stem Cell Culture ... 28
B.22.2. Transfection of Embyonic Stem Cells ... 28
B.22.3. Generation of mutant mice... 29
B. 23. GENERATION OF ITCH POLYCLONAL ANTIBODIES... 29
B.24. PREPARATION OF SINGLE CELL SUSPENSIONS FROM MOUSE ORGANS... 29
B.25. CYTOFLUOROMETRIC ANALYSIS AND CELL SORTING... 30
B.26. INTRACELLULAR STAINING OF CYTOKINES... 31
B.27. PURIFICATION OF LYMPHOCYTE SUBPOPULATIONS USING MAGNETIC CELL SORTING (MACS)... 31
B.28. TH1 VERSUS TH2 POLARIZATION IN VITRO... 31
C. RESULTS... 33
C.1. ANALYSIS OF ITCH MRNA EXPRESSION IN LYMPHOCYTE POPULATIONS... 33
C.2. GENERATION OF MICE HARBORING A LOXP-FLANKED ITCH GENE... 35
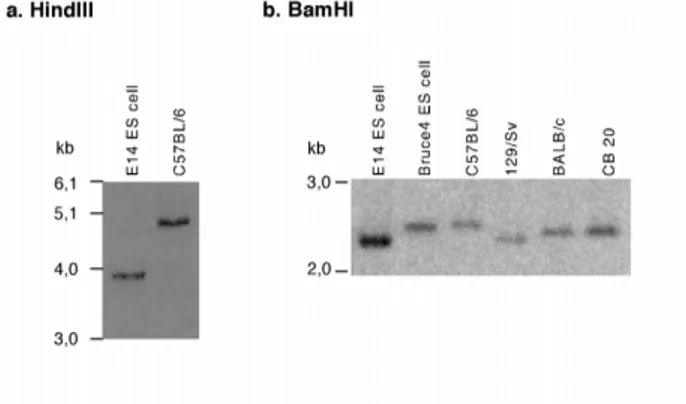
C.2.1. Polymorphism in the itchy locus... 35
C.2.2. Sub-cloning and sequencing of the itchy genomic locus ... 36
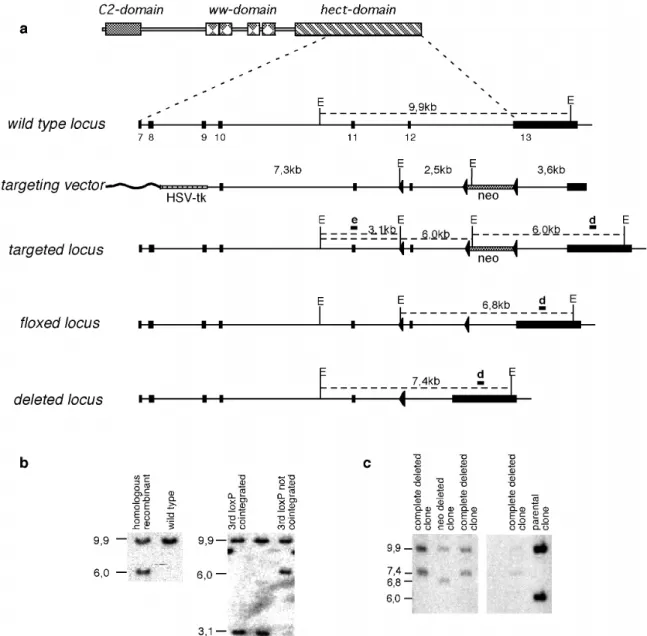
C.2.3. Construction of the itch targeting vector for homologous recombination in ES cells ... 37
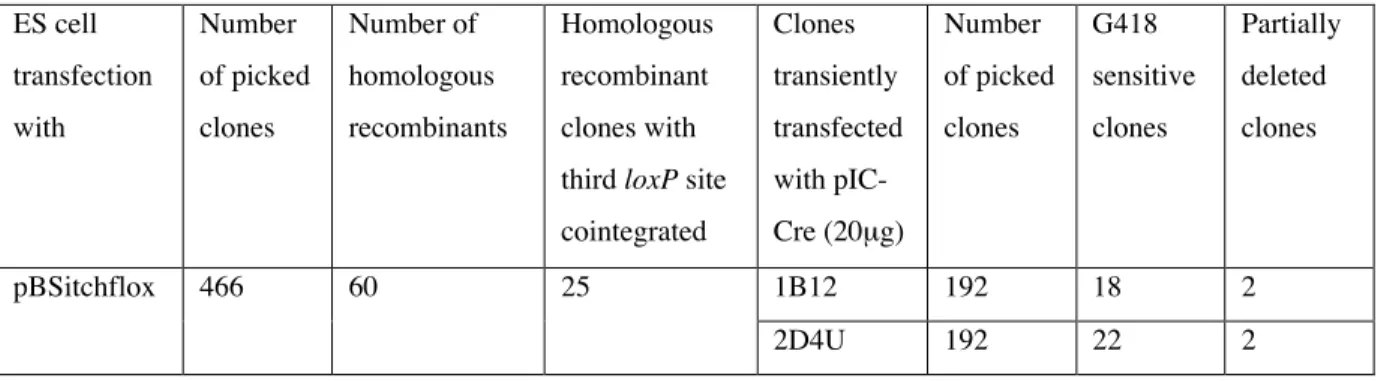
C.2.4. Transfection of ES cells and identification of homologous recombinant clones ... 38
C.3. GENERATION OF MOUSE STRAINS WITH UBIQUITOUS OR CELL TYPE SPECIFIC INACTIVATION OF THE ITCH GENE... 42
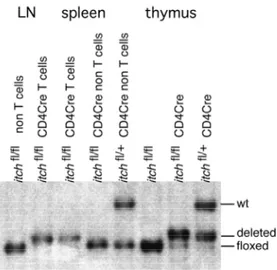
C.3.1. Generation of mice with ubiquitous deletion of itch ... 42
C.3.2. Cell type specific inactivation of the itch gene... 42
C.4. EXPRESSION OF ITCH PROTEIN IN ITCH MUTANT MICE... 44
C.4.1. Generation of anti-Itch polyclonal antibodies ... 44
C.4.2. Expression of Itch protein in itch mutant mice ... 47
C.5. PHENOTYPICAL ANALYSIS OF ITCH MUTANT MICE... 50
C.5.1. Systemic inflammation in itch mutant mice... 50
C.5.2. Elevated levels of blood eosinophils and basophils and signs of anemia in itch fl/fl CD4 Cre+/- mice ... 56
C.5.3 Cell numbers in lymphoid organs of itch mutants ... 58
C.5.4. No impairment of the T cell development or B and T cell ratio in itch fl/fl CD4 Cre+/- mice ... 59
C.5.5. Changed ratios of thymocyte subsets in old itch-CD4Cre mutants... 63
C.5.6. Serum titers of different immunoglobulin isotypes in mice with T-cell specific and ubiquitous deletion of itch ... 65
C.5.7. In vitro Th1-Th2 differentiation of itch deleted naïve CD4 single positive peripheral T cells ... 67
D. DISCUSSION... 71
D.1. THE ROLE OF ITCH IN THE DEVELOPMENT OF SYSTEMIC INFLAMMATORY DISEASE OF A18H MICE... 71
D.2. EXPRESSION OF ITCH IS INCREASED IN MATURE B CELLS AND T CELLS... 71
D.3. POLYMORPHISM IN THE ITCHY LOCUS... 71
D.4. GENERATION OF MOUSE STRAINS WITH UBIQUITOUS OR CELL TYPE SPECIFIC INACTIVATION OF THE ITCH GENE... 72
D.5. THE T CELLS, BUT NOT B CELLS, IN ITCH MUTANT MICE ARE RESPONSIBLE FOR THE SYSTEMIC INFLAMMATORY DISEASE... 72
D.6. NO DOMINANT NEGATIVE EFFECT OF THE MUTATED ITCH PROTEIN... 73
D.7 INACTIVATION OF THE ITCH GENE IN T CELLS INDUCES INFLAMMATION IN MICE... 74
D.8. SPLENOMEGALY AND LYMPHODENOPATHY IN ITCH FL/FLCD4 CRE+/- MICE IS DUE TO AN INCREASE OF LYMPHOCYTES AS WELL AS OTHER CELL TYPES... 74
D.9. MUTANT ITCH MICE HAVE INCREASED LEVELS OF SERUM IMMUNOGLOBULIN IGM, IGG1, IGA AND IGE ... 75
D.10. DISRUPTED SPLENIC ARCHITECTURE IN ITCH FL/FLCD4 CRE MICE... 75
D.11. ITCH IS NOT REQUIRED FOR NORMAL LYMPHOCYTE DEVELOPMENT... 76
D.12. ALTERATIONS OF CELL POPULATIONS IN THE THYMUS AND ACTIVATED PHENOTYPE OF T CELLS... 76
D.13. TH2 VERSUS TH1 BIASED IMMUNE RESPONSE IN ITCH FL/FLCD4CRE MICE... 78
D.14. OLD ITCH FL/FL CD4 CRE MICE SHOW SIGNS OF ANEMIA... 79
D.15. THE PHENOTYPE OF ITCH FL/FLCD4CRE MICE RESEMBLES THAT OF A18H MICE ON C57BL/6 GENETIC BACKGROUND... 79
D.16. THE POSSIBLE ROLE OF INFECTIOUS AGENTS OR PATHOGENS IN THE INDUCTION OF DISEASE... 80
D.17. POTENTIAL MECHANISM(S) UNDERLYING THE DEVELOPMENT OF THE SYSTEMIC INFLAMMATION DISEASE IN ITCH FL/FLCD4CRE MICE... 81
E. ABSTRACT... 88
F. KURZE ZUSAMMENFASSUNG... 89
G. SUMMARY... 90
I. REFERENCES ... 92
J. ACKNOWLEDGEMENT... 111
L. ERKLÄRUNG ... 112
K. LEBENSLAUF ... 113
A. Introduction
Incorrect activation or lack of regulation of signaling cascades in the immune system can induce severe immune disease, such as autoimmunity and inflammatory diseases (for review see (Strober et al., 2002). It has for example, been observed that mice lacking PD-1, an immunoinhibitory receptor, develop autoimmune disorders characterized by production of high titers of autoantibodies (Freeman et al., 2000). In addition, transgenic mice expressing the T cell costimmulatory molecule CD40L, develop a chronic inflammatory disease (Clegg et al., 1997).
Signaling pathways are complex networks of proteins, where biological functions can be regulated by different mechanisms, examples are activation and deactivation of proteins by phoshorylation/dephosphorylation, restriction of protein localization to promote or inhibit protein interactions as well as complete abolishment of activated proteins by degradation. A good example of this is signaling regulation of the transcription factor nuclear factor k B (NFkB), which involves all these three mechanisms. NFkB is inactive when bound to the inhibitors of NFkB (IkB) in the cytosol. Phosphorylation of IkB leads to its ubiquitination and degradation in the proteasome, thereby releasing NFkB which can be translocated to the nucleus where it can act in transcription (Chen et al., 1995; DiDonato et al., 1996; Li et al., 1995).
Duration of signaling pathways are normally tightly controlled by a negative feedback loop.
In its simplest form a signal induces its own negative regulator leading to a decrease of
signaling after the signal has reached a threshold. An example of this is the control of
cytokine signaling through the Janus kinase (JAK)/signal transducer and activator of
transcription (STAT) pathway, where the intracellular protein tyrosine kinases, JAKs, are
recruited to the cytokine receptors and transduce the signal through STATs. This signaling
induces the expression of suppressors of cytokine signaling-1 (SOCS-1), which inturn
interacts with the receptor-bound activated JAKs, resulting in inhibition of tyrosine kinase
activity (Endo et al., 1997; Naka et al., 1997; Nicholson et al., 1999). In addition, SOCS-1 has
been shown to interact with the ubiquitination machinery and is thought to target associated
signaling molecules to proteasomal degradation (Kamura et al., 1998; Zhang et al., 1999).
A.1. Regulation of protein level by degradation
Degradation of cellular proteins is an important process to control the levels of specific proteins as well as to eliminate damaged or misfolded proteins. There are two main pathways of protein degradation in the cell, lysosomal degradation of mainly membranal proteins and degradation by proteasomes of polyubiquitinated intracellular proteins. Polyubiquitination of substrates is usually needed for recognition by the proteasome, while mono- or di- ubiquitinated proteins can be recognized by and directed to the endocytotic pathway reviewed in (Dunn and Hicke, 2001; Hicke, 1999; Hicke, 1997; Lemmon and Traub, 2000).
Poly-ubiquitinated substrates, which are recognized and degraded in the proteasome, include cell cycle regulators as M-phase cyclins and G1 cyclins (King et al., 1994; Won and Reed, 1996), transcription factors such as, STAT1 (Kim and Maniatis, 1996) and c-Jun (Treier et al., 1994), signal transducers such as Protein kinase C (Lee et al., 1996), and protein tyrosin kinase Src (Hakak and Martin, 1999; Harris et al., 1999) as well as abnormal proteins, which have to be removed from the cells. This pathway is also involved in the regulation of signaling cascades by degradation of inhibitory proteins as observed for the activation of the NFkB transcription factor, upon IkB-a ubiquitination and degradation (Chen et al., 1995;
DiDonato et al., 1996; Li et al., 1995).
Identified ubiquitinated substrates degraded in the lysosome are receptors or receptor subunits such as, platelet-derived Growth factor b-receptor (PDGF b-receptor), (Mori et al., 1993).
Thus, ubiquitin-mediated degradation of proteins plays an important role in regulation of
signal transduction and in contrast to other mechanisms, for example
phosphorylation/dephosphorylation, leads to an irreversible end of the signaling cascade.
A.2. The ubiquitin-proteasome degradation pathway
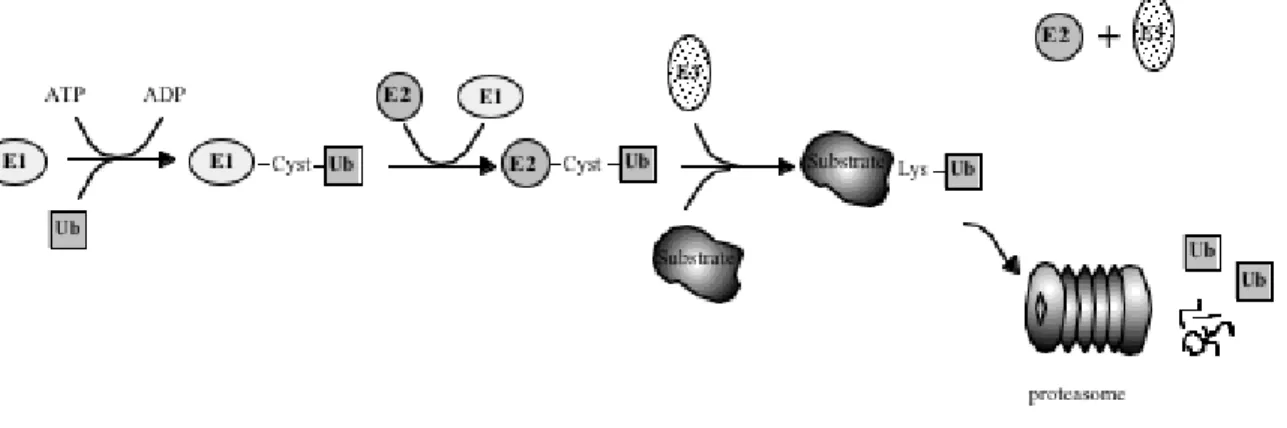
Ubiquitin-dependent degradation of cellular proteins operates as a two step mechanism. The first step includes attachment of an ubiquitin molecule, a highly conserved 76-amino acid polypeptide, to a substrate. Ubiquitin can then serve as its own substrate for ubiquitin conjugation (ubiquitination), which results in the formation of polyubiquitin chains. The second step of the process includes recognition of the polyubiquitinated protein and its degradation by the 26S proteasome, or internalisation and degradation by the lysosomal pathway, as has been shown for some monoubiquitination membranal proteins, for review see (Dunn and Hicke, 2001; Hicke, 1999; Lemmon and Traub, 2000). Ubiquitination of cellular proteins is a highly regulated process (Fig.1). In this process, ubiquitin, is bound to an ubiquitin activating enzyme also called E1, in an ATP- dependent process resulting in a high energy thiol ester bond between a cysteine in the E1 and the ubiquitin molecule. In the next step of the cascade, the ubiquitin molecule is transferred to an ubiquitin conjugating enzyme also called ubiquitin carrier protein or E2, where it is covalently linked to a conserved cysteine in the E2. Finally, the ubiquitin is transferred to the substrate molecule with the help of a third class of enzymes, the ubiqitin protein ligases or E3s (Hershko and Ciechanover, 1998;
Hershko and Ciechanover, 1992; Jentsch, 1992). Ubiquitin can then serve as a substrate itself in the formation of polyubiquitin chains, possibly with the aid of an E4 (Koegl et al., 1999).
The ubiquitin system appear to be a hierarchic system with only one functional E1 known so
far, several E2s (between 20-30 estimated in mammals) and a large number of E3s (more then
hundered revealed by database searches).
Figure 1. The ubiquitination pathway.
Shown is the specific enzymatic reaction of ubiquitin (Ub) conjugation to a substrate molecule, which involves three types of enzymes, the ubiquitin-activating enzyme (E1), the ubiquitin-conjugating enzyme (E2) and the ubiquitin-protein ligase (E3). The conjugation of Ub to a cysteine in the E1 is an ATP dependent processs, the Ub is then transferred to a conserved cysteine in the E2 and, finally, in interaction with an E3, the Ub is transferred to lysine residues in the substrate molecule. After polyubiquitination, the substrate is degraded in the proteasome leaving Ub and peptides as end products.
A.3. Ubiquitin protein ligases (E3)
E3s have loosely been defined as proteins participating together with E1 and E2s in the ubiquitination of proteins, which cannot be recognized and ubiquitinated by E2 alone (Ciechanover, 1994; Hershko and Ciechanover, 1992). A common feature of all known E3s is that each E3 appears to specifically interact with distinct E2s or distinct subsets of E2s (Feldman et al., 1997; Huibregtse et al., 1995; Kumar et al., 1997; Lisztwan et al., 1998;
Moynihan et al., 1999; Nuber et al., 1996; Scheffner et al., 1994; Schwarz et al., 1998). The
substrate recognition of the ubiquitination system is achieved by direct interaction between the
substrate and the E3 or with E3 as part of a complex with an E2. The interaction between the
substrate and the E3 is likely to contribute to the high substrate specificity in the system.
Based on the domain essential for E3 activity, two types of E3s have been defined, the ring finger E3s and the homology to E6-AP C-terminus (hect) domain E3s (Huibregtse et al., 1995;
Joazeiro and Weissman, 2000).
The family of ring finger domain E3s can be devided into four different groups, examples of E3s from these groups are the Rbx1, UBR1, Apc11p and c-Cbl. The Rbx1 (or Hrt1/Roc1) protein, is an essential component of the large combinatorial Skp1-cullin-F-box (SCF) E3 complexes, acting in the ubiquitination of phosphorylated proteins (Kamura et al., 1999;
Skowyra et al., 1999), reviewed in (Elledge and Harper, 1998). The ring finger protein UBR 1 also named E3a, is the E3 of the N-end rule family and is responsible for ubiquitination of N- end rule substrates (Bachmair et al., 1986; Bachmair and Varshavsky, 1989; Bartel et al., 1990; Kwon et al., 1998). The Apc11p is an essential component of the Anaphase Promoting Complex (APC), which is responsible for ubiquitination of cell cycle regulators (Gmachl et al., 2000; Leverson et al., 2000). Finally, the ring finger proteins c-Cbl and Mdm2 are involved in ubiquitination of activated receptor protein tyrosine kinases (RPTKs) and p53 respectively (Fang et al., 2000; Honda and Yasuda, 2000; Waterman et al., 1999).
Mammalian genomes encode several hundreds of ring finger proteins, which can potentially act as ubiquitin protein ligases. The number of potential E3s is further enhanced by combinatorial association of some ring finger proteins with proteins providing docking sites for different substrates (Joazeiro and Weissman, 2000).
In contrast to the ring finger domain E3s, the hect domain E3s can directly bind ubiquitin.
Hect domain E3s are large enzymes ranging from 90 kDa to more than 500 kDa, which are found in all eukaryotic organisms examined so far. These include yeast, Arabidopsis, C.
elegance, Drosophila and mammmals (Huibregtse et al., 1995). Database searches suggest
that the human genome encodes for around 50 different hect domain proteins. These enzymes
all contain the characteristic hect domain of approximately 350 amino acids situated in the C
terminus of the protein, for review see (Pickart et al., 2001). This domain harbors the
enzymatic ligase activity and for the mammalian E3, E6-AP, it was shown that the hect
domain by itself can form a thiol ester intermediate, indicating that the hect domain is
sufficient for recognition and activation by the E1 and E2 (Schwarz et al., 1998). The conserved cysteine in the hect domain has been shown to be essential for ubiquitin ligase activity. A point mutation of this cysteine completely abolishes the ligase activity of the mammalian hect domain E3 E6-AP (Schwarz et al., 1998) and the yeast E3 RSP5 (Wang et al., 1999). Some of the hect domain E3 ligases also contain ww-domains, protein interaction domains, which interact with small proline rich sequences. These are called PY motifs, of which the most common is PPxY, where x being any amino acid, reviewed in (Einbond and Sudol, 1996; Staub and Rotin, 1996). The ww-domain seems to be the site of interaction between the E3 and its substrate, as shown for some E3-substrate interactions e.g the hect domain E3 Nedd4 and its substrate epithelial sodium channel (Harvey et al., 1999; Staub et al., 1996) and RSP5 and its substrate Rpb1 (the large subunit of RNA polymerase II) (Wang et al., 1999). Some of the hect domain E3s contains a N-terminal C2 domain, a domain found in some proteins functioning in signal transduction or membrane traffic. The C2 domain binds Ca
2+and phospholipids and is therefore believed to recruit proteins to membranes reviewed in (Nalefski and Falke, 1996). In fact, it has been demonstrated that the Nedd4 C2 domain is responsible for the Ca
2+dependent translocation of the protein to the plasma membrane (Plant et al., 2000; Plant et al., 1997). The ubiquitin conjugating enzymes (E2), which have been shown to act together with the mammalian hect domain E3s are UBCh5 and the E2 UBCh7 (Schwarz et al., 1998).
A.4. The itch gene and protein
The itch gene was first discovered in 1998 by Copeland and coworkes, when revealing the
genetic defect underlying the auto-immune phenotype in a
18Hmice (Perry et al., 1998). On
C57BL/6 genetic background the a
18Hmice developed interstitial inflammation of the lung,
hematopoeitic cell proliferation in the spleen, hyperplasia of the thymus and lymph nodes as
well as ulcers and inflammatory processes on the ears and skin, leading to death of the animals
after 4-6 month. On a different genetic background, JU/Ct, the mutation gave rise to a partly
different phenotype. These mice developed an interstitial inflammation of the lung and
inflammation of the large intestine (Hustad et al., 1995). The phenotype difference seen in
a
18Hmice on the two different genetic backgrounds could be due to the influence of other genes modifying the effect of the mutation causing immune dysfunction. The genetic defect identified in these mice was an inversion between the agouti locus and the itchy locus (Perry et al., 1998). The proximal breakpoint of the inversion is situated between the untranslated agouti exons one and two and the distal break is located in the intronic sequence between exon 1 and 2 of the itch gene (Perry et al., 1998). The inversion is predicted to produce an itch null allele by separating the promoter from the coding region of the itch gene. This leads to a complete abolishment of the Itch expression and to a ten fold reduction of the agouti expression (Hustad et al., 1995; Perry et al., 1998).
Since mutation in the agouti locus had previously not shown induce an auto-immune phenotype, it was believed that the disruption of the itch gene was responsible for the auto- immune like phenotype developed by a
18Hmice (Perry et al., 1998). It is also possible that additional genes located in the inverted segment are affected in these mice and thereby influence the phenotype. The itch gene is situated on the mouse chromosome 2 and contains thirteen exons. The cDNA is 5122-bp long, with an open reading frame of 2562-bp, which encodes a 854 amino acid large protein with the predicted molecular weight of 113 kDa and which is ubiquitiously expressed (Perry et al., 1998). A prediction of the amino acid sequence revealed a protein with high homology to the family of hect domain ubiquitin-protein ligases (Perry et al., 1998). The domain structure of Itch resembles a N-terminal C2 domain, followed by four ww protein interaction domains and a C-terminal hect domain encoded by the last 336 amino acids. The conserved cysteine on amino acid position 822 of the hect domain, binds ubiquitin covalently and the capability of Itch to act as an E3 has now also been demonstrated in vitro (Qiu et al., 2000).
A.5. Potential substrates of Itch
Potential substrates of Itch have been perposed, but it is still questionable if these are the real
substrates of Itch. Several substrates have so far been suggested and there are probably still
more to be discovered. A recently proposed substrate of Itch is JunB. It was shown that JunB
degradation in a
18HT cells was delayed compared to wild type cells. In addition,
ubiquitination of JunB in Jurkat cells transfected with plasmids expressing JunB and ubiquitin was promoted by cotransfection of an Itch expressing vector but not by a vector expressing anenzymatically inactive Itch (Fang et al., 2002). The transcription factor JunB has been shown to be involved in the regulation of the interleukin-4 (IL-4) expression during T helper cell differentiation (Li et al., 1999). JunB upregulates expression of Th2 cytokines in transgenic mice and synergizes with c-Maf to activate the IL-4 promoter (Li et al., 1999).
Notch-1 is another protein, which may represent a substrate of Itch. The Drosophila protein suppressor of Deltex, is a negative regulator of the Notch signaling pathway (Fostier et al., 1998) and was found to be a hect domain ubiquitin-protein ligase with high homology to the murine E3 ligase, Itch and its human homologue AIP4 and the human proteins WWP2 and WWP1 (Cornell et al., 1999). Moreover, it was shown that recombinant Itch can ubiquitinate Notch-1 in vitro (Qiu et al., 2000). Notch-1 has been shown to play a role in the lineage commitment between B and T cells (Pui et al., 1999; Radtke et al., 1999) and the lineage commitment between abT cells versus gdT cells (Washburn et al., 1997). Its involvement in the lineage commitment between CD4 single positive versus CD8 single positive thymocytes, however, has been disputed (Robey et al., 1996; Wolfer et al., 2001).
It has been shown that the Epstein-Barr Virus protein Latent Membrane protein 2A (LMP2A)
enhances the ubiquitination of the non receptor protein tyrosine kinase Lyn in vivo in a
manner dependent on the activity of Nedd-4 family E3 ligases such as AIP4 the human
homologue of Itch. In addition, a C830A mutant of the AIP4 protein, harbouring a point
mutation in the conserved cysteine essential for ubiquitin binding, can inhibit Lyn and Syk
ubiquitination in vitro (Ikeda et al., 2000; Winberg et al., 2000). In this study, LMP2A itself
was also identified to act as a substrate of AIP4/Itch, leading to its ubiquitination. The region
of the interaction between the two proteins was identified to be the PPPPY motifs in the
LMP2A molecule and the ww domains of the AIP4/Itch (Ikeda et al., 2000; Winberg et al.,
2000). Both Lyn and Syk are involved in the signaling pathway downstream of the B cell
receptor, for review see (Hubbard and Till, 2000). However it is debatable whether Lyn and
Syk are natural substrates of Itch since ubiquitination of these two proteins is only observed in
the presence of LMP2a. Similarly, viral proteins with the ability to connect E3 ligases to none
natural substrates have also been identified previously for the hect domain ubiquitin protein ligase E6AP. In this case, the papillomavirus protein E6 can connect the E6AP to the p53 protein, which leads to ubiquitination followed by degradation of the p53 protein (Scheffner et al., 1993). No ubiquitination of the protein p53 could be shown in the absence of E6, indicating that the p53 protein is not a natural substrate of E6AP.
A.6. The immune response
Immunity is the state of protection against infectious diseases and has an innate and an acquired component. It is thought that innate defense mechanisms provide the first line of host defense against invading pathogens until an acquired immune response develops. The main players of the innate defense are the monocytes, neutrophils and macrophages, which endocytose foreign macromolecules as well as kill and digest whole microorganisms such as yeast or bacteria. In contrast to adaptive immune responses, innate immune responses are antigen receptor-independent and induced via pattern-recognition receptors like the large Toll like receptor (TLR) family. It is now known that in mammals there are about 10 TLRs and each of them has a specific ligand like gram-negative or gram-positive bacterial cell wall components, or dsRNA from viruses, reviewed in (Kaisho and Akira, 2000).
The acquired immune defense on the other hand, is based on the ability of B and T
lymphocytes to specifically recognize and selectively eliminate foreign molecules and
microorganisms. The acquired immune defense can further be divided into humoral and cell-
mediated immune responses. In the humoral response, the microbial antigens are endocytosed
by antigen presenting cells (APC), processed and presented preferentially by class II MHC
molecules to CD4+ T helper (Th) cells. Th cells collaborate with B lymphocytes for the
production of specific antibodies which can eliminate the pathogen or neutralize their soluble
toxic products. The cell-mediated immune response involves various subpopulations of T
cells that recognize antigens presented on self-cells. CD4+ Th cells respond to antigen by
producing cytokines and CD8+ cytotoxic T (Tc) cells respond to antigen by developing into
cytotoxic T lymphocytes (CTLs), which mediate killing of altered self–cells. Defense against
infectious intracellular organisms, as viruses and some type of bacteria and protozoans, are
usually dominated by a cell-mediated immunity characterized by cytolytic activity. On the
other hand, humoral responses are involved in the destruction of most extracellular pathogens, where large amount of pathogen-specific immunoglobulins are produced in an attempt to neutralize the foreign organism, for review see (Kuby, 1997; Constant, 1997; Glimcher, 2000).
Most immune responses involve both humoral and cell-mediated immunity acting in concert, but under some conditions, the two types of effector reaction may be exclusive.
a
b
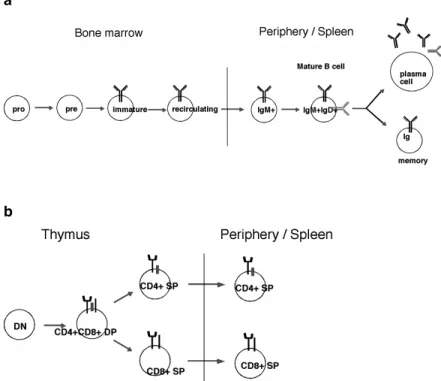
Figure 2. B and T cell development
a Sceme of the different stages of B cell development in the bone marrow, from pro-B to pre-B, to immature- and to recycling-B cells. In the periphery mature-B cell develop to either plasma cell or memory-B cell after antigen stimulation. b Sceme of T cell development in the thymus, from double negative (DN) to doubel positive (DP) to CD4 or CD8 single positive (SP) thymocytes, which leave to the periphery and become CD4 SP or CD8 SP T cells.
A.7. Activation of Th cells in the immune response
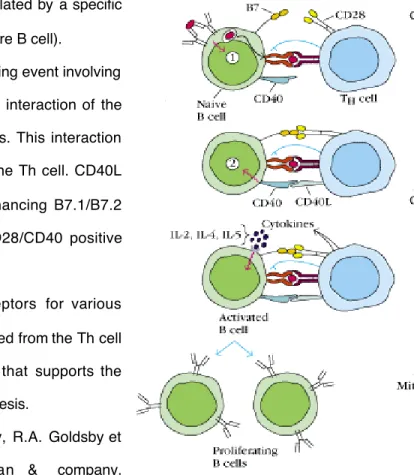
Figure 3. T cell activation
Two signals are required for optimal activation of T cells. In the initial stage of T cell activation, the T cell receptor (TCR) is stimulated by a specific peptide-MHC complex on the APC, this is followed by a second signaling event involving co-stimulatory molecules to achieve full T cell activation. The co-stimulatory signals include interaction of the T cell CD28 molecule with B7.1 and/or B7.2, which are expressed at low levels on the APC. This interaction induces up-regulation of CD40L on the T cell. CD40L then binds CD40 on the APC, enhancing B7.1/B7.2 expression and reinforcing the CD28/CD40 positive feedback loop (Fig.3). Activation of CD28 also induces up-regulation of the co-stimulatory molecule ICOS on the T cell, which interacts with its ligand B7h on the APC. CTLA4, which binds B7
a) The T cell receptor (TCR) is stimulated by a specific
peptide-MHC complex on the APC (here B cell).
b) This is f ollowed by a second signaling event involving
co-stimulatory signal provided by th e interaction of the APC B7 and Th c ell CD28 molecules. This interaction induces up-regulation of CD40L on the Th cell. CD40L then binds CD40 on the APC, enhancing B7.1/B7.2 expression and reinforcing the CD28/CD40 positive feedback loop.
c) B cell begins to express receptors for various
cytokines. Binding of cytokines released from the Th cell in a d irected fashion send signals that supports the progression of the B cell to DNA sy nthesis.
Figure taken from Kuby Immunology, R.A. Goldsby et al., 2000, 4th edition, Freeman & company.
with a higher affinity than CD28, is induced after T cell activation and is involved in down- regulating T cell responses, for review see (Miceli et al., 2001; Oosterwegel et al., 1999;
Thompson and Allison, 1997).
A.8. Th1 versus Th2 response
Upon receiving an antigenic stimulus, the CD4+ T helper lymphocytes differentiate into one of two distinct effector subsets, T helper 1 (Th1) and T helper 2 (Th2), which are defined both by their function and by their unique cytokine profile. The hallmark cytokine of the Th1 subset is IFNg, but Th1 cells also secrete interleukin-2 (IL-2), Tumor necroses factor (TNF) and Lymphotoxin (LT). These cytokines induce cell-mediated immune responses including recruitment and activation of macrophages and other non-specific inflammatory cells. The signature cytokine of the Th2 subset is IL-4, but Th2 cells also secrete the cytokines IL-5, IL- 9, IL-10 and IL-13, cytokines which can help to induce B cell proliferation and differentiation and are critical in the allergic response (Arthur and Mason, 1986; McKenzie et al., 1998;
Mosmann and Coffman, 1989; Paliard et al., 1988; Paul and Seder, 1994). The cell specific
response of Th1 effector cells and the humoral response of Th2 effector cells are thereby
specialized to protect the organism from different types of pathogens. Both genetic and
environmental factors are responsible for the Th1 or Th2 differentiation, although the
mechanisms by which the genetic background controls Th-cell differentiation remain elusive
(Hsieh et al., 1995). Environmental factors proposed to influence Th1 and Th2 lineage
commitment are the nature and strength of the interaction between the TCR/CD3 complex
with peptide bound MHC class II molecule as well as the nature of the costimulation (Paul and
Seder, 1994). However, neither of these signals is as potent a determinant as the cytokine
environment itself. The two critical cytokines in the Th1 and Th2 polarization are IL-12 and
IL-4 respectively (Hsieh et al., 1993; Macatonia et al., 1993; Maggi et al., 1992; Manetti et al.,
1993; Parronchi et al., 1992; Scott, 1991; Seder et al., 1993; Wu et al., 1993). The
requirement for these cytokines has been demonstrated by the phenotype of mice lacking these
cytokines, cytokine receptors or downstream effector molecules of these receptors. IL-12 is
secreted by APC and activates the Stat4 signaling pathway and mutant mice for one of these
molecules can not develop Th1 cells (Kaplan et al., 1996; Magram et al., 1996). On the other
hand mice lacking IL-4, IL-4 receptor or its downstream signaling molecule Stat6, fail to support Th2 differentiation in response to most stimuli (Kühn, 1991; Kopf, 1993; Kaplan, 1996; Shimoda, 1996; Takeda, 1996).
A.9. Autoimmunity and systemic inflammation
The term autoimmunity describes the response of the immune system against self-components.
Healthy individuals normally also posses self-reactive lymphocytes, which normally does not result in autoimmune reactions. The activity of these lymphocytes are normally regulated by anergy or suppression, whereas a breakdown of this regulation can lead to activation of self reactive clones of T or B cells and generation of humoral or cell-mediated responses against self antigens. Both host genes and the environment seem to play a role in the development of autoimmune diseases and can both influence the susceptibility to autoimmunity by influencing the over all reactivity. Organ damage in autoimmune diseases can be mediated by T cells as in multiple sclerosis (MS) and type I diabetes, where both CD4+ and CD8+ T cells play crucial roles in disease development (Haskins and McDuffie, 1990; Hutchings et al., 1992; Steinman, 1996; Wong et al., 1996). In other autoimmune diseases such as systemic lupus erythematosus (SLE) and rheumatoid arthritis (RA), the damage is mediated by autoantibodies and requires CD4+ T helper cells (Kotzin, 1996; Kotzin et al., 2000).
The balance between Th1 versus Th2 cells seems to play an important role in several autoimmune diseases. Multiple sclerosis (MS) is presumed to be an autoimmune disease of the central nervous system. In a mouse model for MS, called experimental autoimmune encephalomyelitis (EAE), most T cells exhibit a Th1 phenotype based on the analysis of IFN- g/IL-2 production versus IL-4/IL-10 production (Kuchroo et al., 1992; Renno et al., 1995;
Renno et al., 1994; van der Veen et al., 1993; Zamvil and Steinman, 1990). In animals with
EAE treatment with IL-4 induce leads to polarization of T cells to Th2 and results in a
diminution of disease symptoms (Racke et al., 1994; Racke et al., 1995). A polarization
towards Th1 also seems to play an important role in the development of other autoimmune
diseases, such as Hashimoto’s thyroiditis and Crohn’s disease. Hashimoto’s thyroiditis , being
an autoimmune disease characterized by histological changes in the thyroid, including massive
infiltration of lymphoid cells and parenchymal destruction and Crohn’s disease, characterized by chronic inflammation of the alimentary canal from mouth to rectum. (Sugihara et al., 1995;
Sugihara et al., 1993)
Systemic lupus erythematosus (SLE) is an autoimmune disorder characterized by overproduction of a wide range of autoantibodies and pathological abnormalities involving the kidney, skin, brain, lungs and other organs (Mills, 1994). In SLE patients, there is an inbalance between Th1 and Th2 cytokines in favor of Th2 cytokines, which may be critical for disease induction (Dueymes et al., 1993; Hagiwara et al., 1996; Klinman and Steinberg, 1995). Other results obtained with lupus prone mice, MRL-lpr/lpr, suggests that both Th1 and Th2 cytokines may play a pathogenic role, since the disease is attenuated by administration of anti- IFNg or anti-IL10 antibody but accelerated by administration of IL-10 (Ishida et al., 1994;
Ozmen et al., 1995).
Thus the majority of autoimmune diseases studied, especially organ specific autoimmune diseases, appear to be mediated by Th1 cells. However there are also autoimmune diseases where a Th1/Th2 polarization is not apparent or in which Th2 responses predominate.
Deficiency or overexpression of genes regulating the reactivity of the immune system have
been shown to be involved in the development of autoimmune diseases. Examples of gene
defects or overexpression affecting the overall immunoreactivity and thereby inducing
autoimmune disease are, Fas and Fas ligand knock-out as well as Bcl-2 transgene (Griffith et
al., 1995; Strasser et al., 1991; Strasser et al., 1991), which act by inhibiting apoptosis, genes
involved in B cell activation such as FcgRIIb, the phosphatase SHP-1, CD22, protein tyrosine
kinase Lyn (Cornall et al., 1998), genes involved in T cell activation and regulation, as TGFb,
TGFbR, PD-1 knock-out and CD40L transgene (Boivin et al., 1997; Christ et al., 1994; Clegg
et al., 1997; Gorham et al., 2001; Larsson et al., 2001; Nishimura et al., 1998). In addition,
genes affecting T cell recognition of peptides, dictating which antigen will be the target of
autoimmune disease and thereby which organs will be attacked as well as genes involved in
cytokine signaling. In addition, transgenes of IL-4, IFNg, TNFa, IL-10 and IL-2 deletion
(Bessis et al., 1998; Butler et al., 1997; Horak et al., 1995; Moritani et al., 1994; Sarvetnick et al., 1988; Tepper et al., 1990), thereby inducing inflammatory responses, has also been shown to be involved in autoimmune disease development.
A.10. Conditional gene inactivation
One way to study a gene function in vivo, is the usage of specific mutagenesis of the gene in mice. In this way conclusions about the gene function can be drawn from the phenotype seen in the mutated mice. The prerequisite of such gene targeting experiments is the establishment of embryonic stem (ES) cell and mutation of the ES cells in culture by homologous recombination (Thomas and Capecchi, 1987). This method is based on the ability of the bacteriophage P1 Cre enzyme to recognize and excise a DNA segment between two loxP sequences (a specific 34bp sequence), when directed in the same orientation (Gu et al., 1993;
Sternberg and Hamilton, 1981). This method can be used to induce the gene mutation in
either an inducible or a cell specific manner, by breeding of mice harboring a loxP flanked
gene with a mouse expressing Cre under the control of an inducible or a cell type specific
promoter (Rajewsky et al., 1996).
A.11. Aims of this study
The itch gene encodes a hect domain E3, which ubiquitin ligase activity has been demonstrated in vitro. It has been shown that in the a
18Hmouse strain the itch gene is disrupted due to a large inversion of DNA segment between the itch locus and the agouti locus. The disease in a
18Hmice take different form on different genetic backgrounds, were the disease on a C57BL/6 background show prominent effects on the immune system and systemic inflammation (Perry et al., 1998).
It is likely that the loss of Itch in a
18Hmice is the reason for the development of inflammatory disease. However, it is possible that other genes located in the inverted gene segment are also affected and participate in the disease development. In addition, the cell type involved in the initiation of disease and the mechanistic features behind the disease development remain unknown.
The inflammatory/auto-immune like phenotype observed in a
18Hmice strongly suggests that lymphocytes have a primary role in the initiation of disease (Hustad et al., 1995; Perry et al., 1998). Lack of down-regulation of one or more signaling proteins involved in the activation of lymphocytes, in the absence of Itch may account for the observed phenotype.
The aim of this study was to show whether disruption of the itch gene can lead to the development of an auto-immune like or inflammatory disease in mice and if so identify the cell type responsible for the initiation of the disease. We also hope to shred some light on the mechanism underlying this dysfunction.
In order to address these questions, we generated a mouse strain, which allowed us to
conditionally inactivate the itch gene. Using the Cre/LoxP recombination technology, the itch
gene could be disrupted specifically in different lymphocyte populations.
B. Material and Methods
B.1. Bacterial transformation
Heat-shock competent E. coli DH5a were used for transformation in all experiments. Bacteria were thawed and incubated with plasmid DNA for 30 minutes on ice, subjected to heat-shock at 42°C for 45 seconds and incubation on ice for 2 minutes. Subsequently, 1 ml SOC medium (2% bacto tryptone, 0.5% yeast extract, 10 mM NaCl, 2.5 mM KCl, 10 mM MgCl
210 mM MgSO
4, 20 mM glucose) was added. Cells were incubated for 30 minutes at 37°C before plating on LB agar plates with proper antibiotics and incubated at 37°C for 12-16 h.
B.2. Isolation of plasmid/BAC DNA
Plasmid DNA was prepared according to the alcaline lysis method descriebed by (Sambrook, 1989). Briefly, Bacteria pellet was resuspended in solution I (50 mM glucose, 25 mM Tris- HCl pH 8.0, 10 mM EDTA pH 8.0), vortexed and lysed in Solution II (0.2N NaOH, 1% SDS).
The lysis reaction was neutralized in ice cold Solution III (5 M potassium acetate, 11.5%
glacial acetic acid) by inversion. The DNA was precipitated by propanol and washed in 70%
EtOH before resuspention in TE pH 7.5 (10 mM Tris, 1 mM EDTA) Plasmid DNA
preparation for sequencing was isolated using GFX
TMMicro Plasmid Prep Kit (Amersham
Pharmacia Biotech Inc.). Large amount of plasmid DNA was isolated by midi or maxi prep kit
(Qiagen). All according to the manufactures protocol. The BAC clone received from
GenomeSystemsInc, harbored C57BL/6 mouse genomic DNA inserted into the pBeloBAC 11
vector. The BAC clone DNA was isolated as follows, BAC transformed bacteria were grown
12-14 h in LB 12.5 mg/ml chloramphenicol. Pellet was resuspended in GTE buffer (50 mM
glucose, 10 mM EDTA, 0.1 M NaCl)+ 100 mg/ml lysozyme, incubated for 5 minutes at RT
and lysed in 0.2 M NaOH, 1% SDS and incubated on ice for 5 minutes. The lysis reaction was
neutralized in 3 M KAc buffer (3 M KAc, 11.5% acetic acid) by inversion and 5 minutes
incubation on ice. After centrifugation the RNA was removed from the supernatant by
addition of 50 m g/ml RNAseA and incubation for1 hour at 37°C. The solution was then
extracted with phenol/chloroform (1:1) to remove proteins. DNA was precipitated with propanol, washed in 70% EtOH and resuspended in TE pH 7.5.
B.3. Cloning of genomic DNA
Cloning was preformed by using DNA ligation kit (Takara) according to the manufacture’s instruction or T4 DNA ligase (Gibco BRL) according to the methods of (Sambrook, 1989).
Filling of incompatible 3’ termini was done with Klenow fragment of E.coli DNA polymeraseI (Boehringer Mannheim), for removal of protruding 3’ termini bacteriphage T4 DNA polymerase was used. The vector was dephosphorylated with calf intestinal phosphatase (CIP), followed by extraction with Phenol/Chloroform, precipitated with 2 volumes of EtOH and diluted in H
2O before ligation.
B.4. Restriction enzyme analysis
Restriction enzyme (Boeringer, Gibco, Takara, New England BioLabs) were used according to the manufacture’s instruction.
B.6. Synthetic oligonucleotides
Oligonucleotides used for PCR reactions and DNA sequencing were purchased from Sigma ARK or Eurogentec. Oligonucleotides used for PCR on the Light Cycler (Roche) were designed and purchased from mol TIBbiol.
B.7. Purification of DNA fragments
DNA fragments were cut out from agarose gels and purified using JETsorb solutions (Genomed) or QIAquick gel extraction kit (Qiagen) according to the manufacture’s instruction.
B.8. DNA sequencing
Agarose gel purified Plasmid DNA (0.5-1 mg) or PCR fragments (0.05-0.2 mg) was used per
sequencing reaction using “Tay Dye Deoxy Terminator Cycle Sequencing Kit” (Applied
Biosystems) according to the manufacturer’s instructions. The method is based on the dideoxy-chain termination reaction (Sanger et al., 1977). The products were precipitated with 120 mM Sodium acetate in 95% EtOH and washed in 70% EtOH. Sequencing reactions were resolved and analysed on an automated sequencer (A373, Applied Biosystems), according to the manufacture’s protocol.
B.9. Isolation of genomic DNA
Genomic DNA was isolated from mouse tail tips. 0.5-1 cm tail tips were digested in 0.5 ml Tail lysis buffer (10 mM Tris(hydroxymetyl)aminoethan (Tris)/HCL pH 8.5, 5 mM ethylene- diamine-tetraacetic-acid (EDTA), 0.2% sodium dodecyl sulfate (SDS), 200 mM NaCl, 100 mg/ml proteinase K) O/N at 56°C and 1000 rpm. Genomic DNA was isolated from ES cells grown to confluence in 96 well plates and washed once with PBS, by O/N digestion in ES cell lysis buffer (10 mM NaCl, 10 mM Tris-HCl pH 7.5, 10 mM EDTA, 0.5% Sarcosyl, 0.4 mg/ml freshly added proteinase K) at 56°C at humid condition according to protocol by (Pasparakis and Kollias, 1995).
B.10. Southern blot analysis
Approximatly 10 m g of genomic DNA was digested 14-16 hours using 150 units of appropriate restriction enzyme. The digested genomic DNA was resolved on a 0.8% agarose gel. Capillary transfer of DNA to nitrocellulose membrane (Hybond-N, Amersham or genescreen Plus, Dupont) was preformed by standard procedures following (Southern, 1975).
The DNA was fixed to membranes by UV-crosslinking using a photo-crosslinker (BioLink
BLX-254, LTF Labortechnic). Membrane was blocked ON at 65°C in hybridization buffer
(50 mM Tris-CL pH 7.5, 1 M NaCl, 1% SDS, 10% dextran sulfate, 300 mg/ml sonicated
salomon sperm DNA). The labeled probe was added to the hybridization buffer and incubated
at 65°C ON. Finally, the membrane was washed with 0.5-2x SSC (150 mM NaCl, 15 mM tri-
sodium citrate) and 0.1-1% SDS, followed by exposure for autoradiography.
B.11. Amplification and purification of probes used for Southern blot analysis The probe d was amplified from the subcloned genomic itch sequence by PCR using primers d2 forward and d2 reversed. Probe e was amplified using the same template and primers e reverse and e forward. The probes were sequenced before use.
B.12. Radioactive labeling of probes
The radioactive labeling of probes were preformed by random primed (Feinberg and Vogelstein, 1983). 50 ng of DNA template and random hexamers in the final volume of 10 ml were denatured at 100°C for 3 minutes and chilled on ice for 5 minutes. Addition of 2.5 ml BCA10x buffer, 3 ml 0.2 mM dNTP (dCTP, dGTP, dTTP), 25 mCi a
32P-dATP (Amersham) in the final volume of 24 ml and 1 ml BCAbest DNA polymerase (Takara). The labeling reaction was preformed at 55°C for 50 minutes.
B.13. Polymerase Chain Reaction (PCR)
The polymerase chain reaction was used for the routine genotype screening of mutant mice,
amplification of probes for Southern blot analysis and amplification of cDNA for cloning. All
PCR reactions were carried out in 30 ml reactions and either Klentherm (Genecraft) or Taq
polymerase (home made) was used.
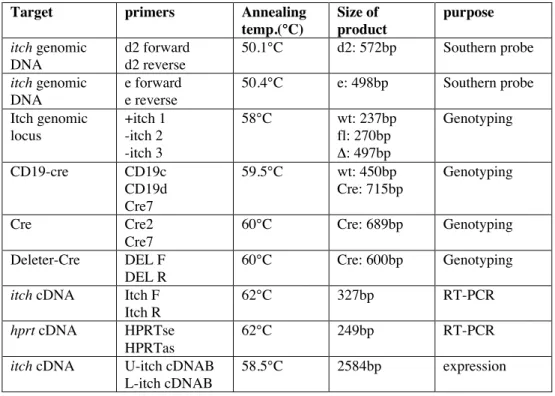
Table 1. shows the PCR conditions of different PCR reactions.
Target primers Annealing
temp.(°C)
Size of product
purpose itch genomic
DNA
d2 forward d2 reverse
50.1°C d2: 572bp Southern probe
itch genomic DNA
e forward e reverse
50.4°C e: 498bp Southern probe
Itch genomic locus
+itch 1 -itch 2 -itch 3
58°C wt: 237bp
fl: 270bp D: 497bp
Genotyping
CD19-cre CD19c
CD19d Cre7
59.5°C wt: 450bp
Cre: 715bp
Genotyping
Cre Cre2
Cre7
60°C Cre: 689bp Genotyping
Deleter-Cre DEL F
DEL R
60°C Cre: 600bp Genotyping
itch cDNA Itch F
Itch R
62°C 327bp RT-PCR
hprt cDNA HPRTse
HPRTas
62°C 249bp RT-PCR
itch cDNA U-itch cDNAB
L-itch cDNAB
58.5°C 2584bp expression
Table 2. Primer sequences
PCR primer sequence
d2 forward 5’ AGC ACT GTG GTT CCT TC 3’
d2 reverse 5’ AGG TCC CCA TTA GAG AA 3’
e forward 5’ GCT TGA TTT GAT TTG GTT 3’
e reverse 5’ TAT CTC ACA GCA GCA AGG 3’
+a probe 5’ GAG CCT ATT TGA TTG TCT GC 3’
-a probe 5’ CTA CCA TGA GAC CCT ACC TT 3’
+itch 1 5’ACA AGA GGT AGG AGA CAA GCA TT 3’
-itch 2 5’ TGC AGC TTA TTT ATC ATT CCT TA 3’
-itch 3 5’ TGG TTA CTT TAT TTG GCTTTgACTC3’
CD19-Cre d 5’ CCA GAC TAG ATA CAG ACC AG 3’
CD19-Cre c 5’ AAC CAG TCA ACA CCC TTC C 3’
Cre7 5’ TCA GCT ACA CCA GAG ACGGG 3’
Cre2 5’ CAA TTT ACT GAC CGT ACA 3’
U-itch cDNAB 5’ CGC GGA TCC GGT AGT CTG ACC ATG 3’
L-itch cDNAB 5’ CGG GAT CCC GCA ATT ACT CTT GTC C 3’
B.14. Isolation of RNA
Total RNA was isolated from organs or sorted lymphocyte populations using Trizol reagent
(Gibco BRL) according to the manufacture’s protocol.
B.15. cDNA synthesis
cDNA was synthesized from total RNA using ”First Strand cDNA synthesis kit” (Gibco BRL). RNA from 5 x 10
5sorted cells or from 6 mg RNA isolated from organ was incubated with random hexamers (Boeringer) in a total volume of 11 ml at 70°C for 10 minutes.
Samples were chilled on ice before addition of the reaction master mix (2 ml 0.1 M DTT, 1 ml 10 mM dNTP, 4 ml 5x first strand buffer, 0.5 ml RNAsin ribonuclease inhibitor (Promega)) to the samples. After 2 minutes of pre heating 1 ml (200 units) Superscript reverse transcriptase was added. Samples were incubated at 42°C for 90 minutes followed by inactivation at 95°
for 5 minutes.
B.16. Reverse Transcript-PCR using the Light Cycler
As control template for hprt cDNA the EST clone 1007097 (2512-p10) from HGMP Resource Center was used and the itch control template was the itch cDNA clone, a kind gift from Prof.
Neal G. Copeland.
Table 3. Primers and probes used for RT-PCR
cDNA primers Probe LC Probe FL Annealing temp.
(°C)
itch Itch F
Itch R
Itch LC Itch FL 62°C
HPRT HPRT se
HPRT as
HPRT 640 HPRT FL 62°C
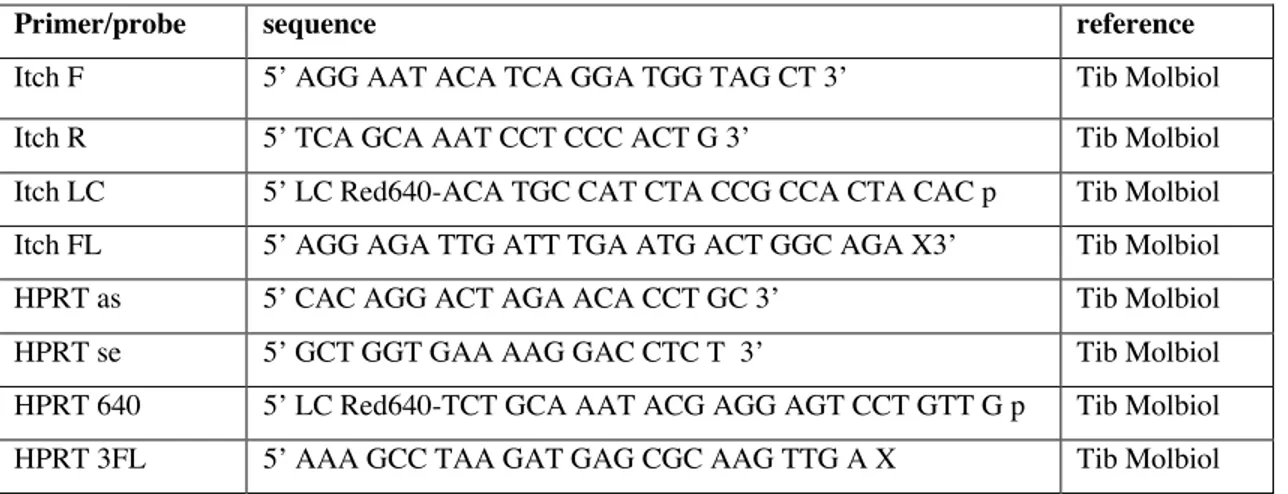
Table 4. Sequence and reference of RT-PCR primers and probes
Primer/probe sequence reference
Itch F 5’ AGG AAT ACA TCA GGA TGG TAG CT 3’ Tib Molbiol
Itch R 5’ TCA GCA AAT CCT CCC ACT G 3’ Tib Molbiol
Itch LC 5’ LC Red640-ACA TGC CAT CTA CCG CCA CTA CAC p Tib Molbiol
Itch FL 5’ AGG AGA TTG ATT TGA ATG ACT GGC AGA X3’ Tib Molbiol
HPRT as 5’ CAC AGG ACT AGA ACA CCT GC 3’ Tib Molbiol
HPRT se 5’ GCT GGT GAA AAG GAC CTC T 3’ Tib Molbiol
HPRT 640 5’ LC Red640-TCT GCA AAT ACG AGG AGT CCT GTT G p Tib Molbiol
HPRT 3FL 5’ AAA GCC TAA GAT GAG CGC AAG TTG A X Tib Molbiol
B.17. Amplification of itch cDNA for cloning of the Itch expression vector
The itch coding sequence was amplified from the itch cDNA containing vector by PCR using primers U-itch cDNAB and L-itch cDNAB. A BamHI restriction enzyme site was introduced in the 5’ and 3’ of the primers respectively, which enabled for digest of the PCR product with BamHI and in frame cloning into the BamHI site of the pGEX-4T-1 expression vector (Pharmacia biotech). The L-itch cDNAB primer also codes for an in frame stop codon.
B.18. Expression and purification of recombinant GST- Itch fusion protein
The open reading frame of the itch cDNA was cloned in frame in the pGEX-4T-1 expression vector (Pharmacia biotech). DX5a bacteria were transformed with the GST-Itch expression vector and cultures were grown in LB medium at RT. At OD
6000.4 the culture was induced with 0.1 mM IPTG and grown for additional 2 hours. The bacteria pellet was washed once with PBS and resuspended in PBS/0.1 mg/ml lysozyme/1% Trition X-100 and incubated at RT for 5 min and then sonificated. After centrifugation the supernatant was incubated with
Glutathione Sepharose 4B (Pharmacia Biotech) ON at 4°C. The next day the Glutathione Sepharose beads were washed 3x with PBS and the bound GST-Itch fusion protein was eluted with elution buffer (10 mM reduced glutathione, 50 mM Tris pH 8.0). Protein was stored at –20°C in protein freezing buffer (50 mM KCl, 10 mM Tris-HCl pH 7.5, 0.1 mM EDTA, 1 mM DTT, 50% Glycerol).
B.19. Western Blot Analysis
Lysates from organs were prepared by dounzing the organs together with 3 ml lysis buffer (50
mM Tris-HCL, 150 mM NaCl, 4 mM EDTA, 10% glycerol, 1% NP-40, 0.2 mg/ml aprotenin,
0.1 mg/ml leupeptin, 1 mM PMSF)/g tissue in a dounzer. From lymphoid organs, lysates were
prepared from single cells. One ml lysis buffer/10
8cells was used. Total protein
concentration of lysates was determined by Bicinchoninic Acid (BCA) assay (Pierce) against a
bovine serum albumine (BSA) standard according to the manufacture’s protocol. Lysates
were resolved by SDS-poly-acrylamid-gel electrophoresis (SDS-PAGE) and transferred to
nitrocellulose (Schleicher & Schuell) or polyvinylidene-difluorid (PVDF) membrane
Immobilon-P, Millipore). To confirm equal loading and to identify the size marker (Bio-Rad),
the membranes were stained with Ponceau-Red solution (Sigma). To block unspecific binding, membranes were blocked with 5%BSA fraction V (Boehringer Mannheim) in 1 x TBS-T (100 mM Tris-HCl pH 7.6, 140 mM NaCl, 0.02% Tween 20) ON at 4°C. Membranes were incubated with the primary anti-body for 1-2 hours at RT washed in TBS-T and incubated with Horseradish peroxidase (HRP) conjugated secondary antibody for 1 hour at RT, washed in TBS-T and detected by chemiluminescence system (super-ECL, pharmacia biotech) according to the manufactures protocol.
Table 5. Antibodies used for Western blotting
Antibody Peptid specificity or clone name Antigen size
Anti-Itch-N-terminus SAKLKENKKNWFGPC 113 kDa
Anti-Itch-N-terminus CLFAIEETEGFGQE 113 kDa
Anti-Tubulin DM1A 55 kDa