LagBox – Measuring the Latency of USB-Connected Input Devices
Abstract
High latency in an interactive system limits its usability.
In order to reduce end-to-end latency of such systems, it is necessary to analyze and optimize the latency of individual contributors, such as input devices, applica- tions, or displays. We present a simple tool for measur- ing the latency of USB-connected input devices with sub-millisecond accuracy. The tool, based on a Rasp- berry Pi 2 microcomputer, repeatedly toggles a button of a game controller, mouse, or keyboard via an opto- coupler soldered to the button and measures the time until the input event arrives. This helps researchers, developers and users to identify and characterize sources of input lag. An initial comparison of multiple input devices shows differences not only in average latency but also in its variance.
Author Keywords
Latency; input devices; interaction; measurements;
hardware; open-source;
ACM Classification Keywords
H.5.2 User Interfaces: Input devices and strategies
Introduction and Motivation
The amount of latency or lag in human-computer inter- faces affects how effectively, efficiently, and satisfacto- rily users interact with a computer system. As shown by Ng et al. [11], users are able to detect the effects of Permission to make digital or hard copies of part or all of this work for
personal or classroom use is granted without fee provided that copies are not made or distributed for profit or commercial advantage and that copies bear this notice and the full citation on the first page. Copyrights for third-party components of this work must be honored. For all other uses, contact the Owner/Author.
CHI'18 Extended Abstracts, April 21–26, 2018, Montreal, QC, Canada
© 2018 Copyright is held by the owner/author(s).
ACM ISBN 978-1-4503-5621-3/18/04.
https://doi.org/10.1145/3170427.3188632 Florian Bockes
University of Regensburg Franz-Mayer-Straße 1 93053 Regensburg, Germany florian.bockes@ur.de
Raphael Wimmer University of Regensburg Franz-Mayer-Straße 1 93053 Regensburg, Germany raphael.wimmer@ur.de
Andreas Schmid University of Regensburg Franz-Mayer-Straße 1 93053 Regensburg, Germany andreas1.schmid@stud.uni- regensburg.de
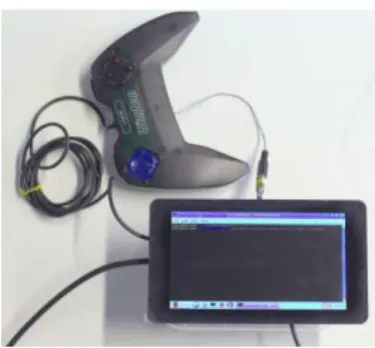
latency in a user interface, down to an overall latency of 2 ms. In practice, a maximum latency of 20 ms for touch input and 2 ms for dragging actions is desirable [5]. High latency disproportionally increases task com- pletion time for pointing tasks by slowing down feed- back loops [10, 13]. In certain computer games, such as first-person shooters or real-time strategy games, the amount of latency a user experiences decides over virtual life or death [8]. When controlling surgical ro- bots or vehicles, high latency may cause critical situa- tions. Thus, finding ways to reduce latency is of great importance for designers of interactive systems. In order to reduce the overall latency of a system, it is necessary to isolate and measure individual sources of latency. We present an approach for precisely and ac- curately measuring the latency of common input devic- es, such as computer mice, keyboards, joysticks and gamepads. As many of these devices are connected to a host computer via the Universal Serial Bus (USB) [15], we focus on them and exclude devices connected via wireless (Bluetooth) or embedded interfaces (I2C, SPI). Furthermore, we limit our investigation to the latency of (binary) button presses and do not measure latency of non-binary input channels, such as mouse movement or joystick axes. This makes it easier to define, measure, and compare latency measurements for different device classes. For conducting the meas- urements, we implemented LagBox (Figure 1), a simple Raspberry-Pi-based tool that measures latency of USB- connected input devices by repeatedly electrically trig- gering a button on the device and detecting the input event on the Raspberry Pi. By automatically conducting hundreds of latency measurements per input device, our approach allows for reproducibly collecting more data in a shorter time period and with higher accuracy than manual approaches.
In the following, we present an overview of previous approaches to measuring the latency of input devices, describe the implementation of LagBox, show initial measurements, and discuss limitations and future work.
Related Work
Traditionally, researchers and gamers have been em- ploying two different approaches for measuring the latency of input devices. Many previously presented approaches measure end-to-end latency, i.e. the time difference between an input event (e.g., the user pressing a button) and an output event (e.g., a change of screen contents). This is often done using a video camera. Kaaresoja and Brewster deliver one good ex- ample for this approach [6]. By varying only one part of the processing pipeline – such as the input device that is being used - one may indirectly determine latency differences caused by these changes.
Teather et al. measured the input latency of eight com- puter mice, a keyboard, and a response box connected to a computer via the serial port, PS/2 or USB [13]. An oscilloscope was used to measure the delay between a (simulated) button press on the device and a signal being emitted to the computer. Casiez et al. - who also give a good overview of related work - present a non- destructive approach for measuring absolute end-to- end latency for different computer mice [1]. Further- more, they developed a low cost method to measure and characterize the end-to-end latency of a touch system (tap latency) or an input device equipped with a physical button [2]. In the method used by Casiez et al., the time of touch is detected by a vibration sensor, whereas the time of response is detected by a photodi- ode affixed to the display. Researchers at Google measure touch screen latency with a similar approach using a laser sensor to detect touches [7]. A commonly Figure 1 – The LagBox measures
latency of input devices by rapidly closing the electrical contact of a button on an input device and measuring the time it takes for the corresponding USB packet to arrive from the input device.
Figure 2 – Simplified circuit diagram of the lagbox.
used approach used by hobbyists is to measure the difference in latency of two computer mice by smashing both together so that their mouse buttons are clicked at the same time. Software running on a PC captures the timestamps of the two button events and prints out the difference [14].
Deber et al. [4] present Hammer Time, a tool for measuring the latency of capacitive touch screens.
Their approach allows for rapidly generating touch events and measuring system response using a light sensor. While the tool offers high precision due to re- peated measurements, it is only capable of measuring end-to-end latency, too.
In summary, common approaches for measuring laten- cy are: 1) measuring end-to-end latency by visual means, 2) building custom circuits to capture touch input and system response, and 3) simultaneously pressing buttons on two input devices in order to measure the difference in their latencies. The first two approaches only allow capturing end-to-end latency, thereby hiding the partial latencies of individual com- ponents. The latter approach is inherently imprecise and does not scale.
Implementation
With LagBox we contribute an approach that allows for conducting rapid, repeated measurements of the laten- cy of USB-connected input devices. In order to simplify device design and make the device affordable for a wide audience, we use a Raspberry Pi 2 (abbreviated RPi2 in the following) as the core of LagBox. As button mechanics make it inherently hard to define a precise point in time for the input, we define the start time as the point of time when electrical connection is made by the button. Therefore, all USB devices under test have to be prepared by soldering two wires to one of the
button pads on the device. These wires are then con- nected via a 3.5mm audio jack to the phototransistor side of an LTV817 optocoupler (Figure 2). The optocou- pler is connected to one GPIO pin and ground on the RPi2. A resistor protects the optocoupler’s LED against overcurrent (Figure 2). When the GPIO pin is activated, the optocoupler electrically connects both wires, there- by simulating a button press on the tested device. A low-latency C application running on the RPi2 repeated- ly triggers the optocoupler and measures the time it takes for an USB packet to arrive from the device. The inherent latency of our measurement setup is in the low microseconds range and therefore has little effect on the measured device latencies which are in the milli- seconds range.
Limitations
Currently, the system is limited to reading input events from the Linux kernel’s device interface instead of di- rectly detecting USB traffic. As USB devices are polled by the host computer in intervals of 1, 2, 4, 8, etc.
milliseconds – depending on the configuration they report – polling rate has a major effect on actual laten- cy. First measurements where we enforced a higher polling rate, indicate that some devices do offer signifi- cantly lower latency in this case. A further limitation of our current approach is that it currently requires physi- cally modifying an input device. While the wires can be desoldered again from the device, our approach is not suitable for testing devices e.g., in a store. Extending our system so that it mechanically presses buttons would allow non-invasive measurements.
First results and discussion
To validate our prototype, several experiments were conducted during the development process where we
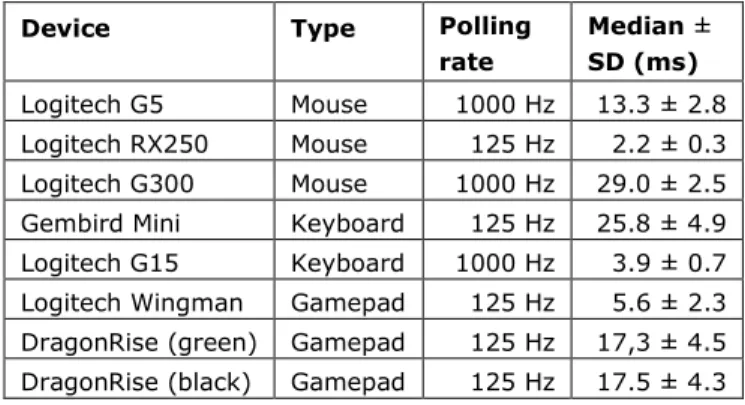
tested a small number of input devices. The following devices were tested: three gamepads (Logitech Wing- man and two different no-name gamepads using the same DragonRise controller IC), two keyboards (Logitech G15 and Gembird Mini USB Keyboard), and three mice (Logitech G5, G300, and RX250). For each device, we collected 5000 samples. Delays between individual measurements were randomized between 0.1 and 10 ms with an even distribution in order to avoid accidental synchronization between measurement in- terval and USB polling interval. Great differences exist between devices regarding both latency and consisten- cy (Table 1). Moreover, plotting the kernel density es- timates for the latency distributions reveals further peculiarities of certain devices (Figure 3). For example, the Logitech G15 keyboard has a bimodal distribution of latencies.
Device Type Polling
rate
Median ± SD (ms) Logitech G5 Mouse 1000 Hz 13.3 ± 2.8 Logitech RX250 Mouse 125 Hz 2.2 ± 0.3 Logitech G300 Mouse 1000 Hz 29.0 ± 2.5 Gembird Mini Keyboard
K
125 Hz 25.8 ± 4.9 Logitech G15 Keyboard 1000 Hz 3.9 ± 0.7 Logitech Wingman Gamepad 125 Hz 5.6 ± 2.3 DragonRise (green) Gamepad 125 Hz 17,3 ± 4.5 DragonRise (black) Gamepad 125 Hz 17.5 ± 4.3
Table 1 – Results of initial latency measurements.
Figure 3 – Latency distribution for various USB-connected mice, gamepads and keyboards measured by our implementa-
tion
Conclusion and outlook
In summary, we have presented a versatile open- source system which currently supports an automat- ed/destructive mode for measuring latency of USB devices, such as mice, keyboards, and game control- lers. It can be augmented with non-destructive meas- urement modes. For example, using an accelerometer similar to Google WALT [7] supplementary to or instead of a force-sensitive resistor might offer greater flexibil- ity. In the future we want to add the approach demon- strated by Casiez et al. [2] and furthermore measure exact timing of “button-pressed” events with a piezoe- lectric sensor. A mechanical actuator for pressing but- tons would allow for automated standardized testing.
The preliminary results indicate that devices differ not only in average latency, but that also great differences in the latency distributions exist. These might warrant further investigation.
Acknowledgements
Simon Fürnstein, Oliver Pieper, and Mark Engerißer implemented earlier versions of the prototype and con- ducted initial latency measurements for their bachelor’s theses.
This project is funded by the Bavarian State Ministry of Education, Science and the Arts in the framework of the Centre Digitisation.Bavaria (ZD.B)
References
[1] Casiez, G., Conversy, S., Falce, M., Huot, S. and Roussel, N. 2015. Looking through the eye of the mouse: A simple method for measuring end-to-end latency using an optical mouse. In Proc. UIST ‘15, 629–
636.
[2] Casiez, G., Pietrzak, T., Marchal, D., Poulmane, S., Falce, M., & Roussel, N. (2017). Characterizing Latency in Touch and Button-Equipped Interactive Systems. In Proc. UIST’17 29–39. New York, NY, USA: ACM.
[3] Damian, M.F. 2010. Does variability in human per- formance outweigh imprecision in response devices such as computer keyboards? Behavior Research Meth- ods. 42, 1 (2010), 205–211.
[4] Deber, J., Araujo, B., Jota, R., Forlines, C., Leigh, D., Sanders, S., and Wigdor, D. 2016. Hammer time!:
A low-cost, high precision, high accuracy tool to meas- ure the latency of touchscreen devices. In Proc. CHI
’16. 2857-2868. ACM.
[5] Jota, R., Ng, A., Dietz, P. and Wigdor, D. 2013. How fast is fast enough? : A study of the effects of latency in direct touch pointing tasks. In Proc. CHI ’13, 2291–
2300.
[6] Kaaresoja, T. and Brewster, S. 2010. Feedback is…
Late: Measuring multimodal delays in mobile device touchscreen interaction. International conference on multimodal interfaces and the workshop on machine learning for multimodal interaction (2010), 2.
[7] Koudritsky, M., Jahin, S., Quinn, P. and Fair, B.
(2017). WALT latency timer. Retrieved from:
https://github.com/google/walt [13.1.2018]
[8] Lampe, U., Wu, Q., Hans, R., Miede, A. and Steinmetz, R. 2013. To frag or to be fragged-an empiri- cal assessment of latency in cloud gaming. CLOSER (2013), 5–12.
[9] Luu, D. 2017. Keyboard Latency. Retrieved from:
http://danluu.com/keyboard-latency/ [15.1.2018]
[10] MacKenzie, I.S. and Ware, C. 1993. Lag as a de- terminant of human performance in interactive sys- tems. In Proc. INTERACT ’93 and CHI ’93, 488–493.
[11] Ng, A., Lepinski, J., Wigdor, D., Sanders, S. and Dietz, P.2012. Designing for low-latency direct-touch input. Proceedings of the 25th annual ACM symposium on user interface software and technology (2012), 453–
464.
[12] Plant, R.R., Hammond, N. and Whitehouse, T.
2003. How choice of mouse may affect response timing in psychological studies. Behavior Research Methods, Instruments, & Computers. 35, 2 (2003), 276–284.
[13] Teather, R.J., Pavlovych, A., Stuerzlinger, W. and MacKenzie, S.I. 2009. Effects of tracking technology, latency, and spatial jitter on object movement. 3D user interfaces, 2009. 3DUI 2009. IEEE symposium on (2009), 43–50.
[14] The measurement of gaming mouse button lag.
2013. Retrieved from:
http://web.archive.org/web/20160224102835/https://
utmalesoldiers.blogspot.de/2013/02/114.html [15.1.2018]
[15] USB Implementers Forum 2000. Universal serial bus specification rev. 2.0. (2000).