On the Latency of USB-Connected Input Devices
Raphael Wimmer University of Regensburg
Germany raphael.wimmer@ur.de
Andreas Schmid University of Regensburg
Germany andreas.schmid@ur.de
Florian Bockes University of Regensburg
Germany florian.bockes@ur.de ABSTRACT
We propose a method for accurately and precisely measur- ing the intrinsic latency of input devices and document mea- surements for 36 keyboards, mice and gamepads connected via USB. Our research shows that devices differ not only in average latency, but also in the distribution of their laten- cies, and that forced polling at 1000 Hz decreases latency for some but not all devices. Existing practices - measuring end-to-end latency as a proxy of input latency and report- ing only mean values and standard deviations - hide these characteristic latency distributions caused by device intrin- sics and polling rates. A probabilistic model of input device latency demonstrates these issues and matches our measure- ments. Thus, our work offers guidance for researchers, en- gineers, and hobbyists who want to measure the latency of input devices or select devices with low latency.
CCS CONCEPTS
• Human-centered computing → Interaction devices; Lab- oratory experiments; • Hardware → Communication hard- ware, interfaces and storage.
KEYWORDS
latency, lag, USB, input, input devices, model ACM Reference Format:
Raphael Wimmer, Andreas Schmid, and Florian Bockes. 2019. On the Latency of USB-Connected Input Devices. In CHI Conference on Human Factors in Computing Systems Proceedings (CHI 2019), May 4–9, 2019, Glasgow, Scotland UK. ACM, New York, NY, USA, 12 pages. https://doi.org/10.1145/3290605.3300650
1 INTRODUCTION
The amount of latency (or lag) in human-computer inter- faces affects how effectively, efficiently, and satisfactorily users interact with a computer system. As shown by Ng et al. [21], users are able to detect the effects of latency in a
CHI 2019, May 4–9, 2019, Glasgow, Scotland UK
© 2019 Copyright held by the owner/author(s). Publication rights licensed to ACM.
This is the author’s version of the work. It is posted here for your per- sonal use. Not for redistribution. The definitive Version of Record was pub- lished in CHI Conference on Human Factors in Computing Systems Proceed- ings (CHI 2019), May 4–9, 2019, Glasgow, Scotland UK, https://doi.org/10.
1145/3290605.3300650.
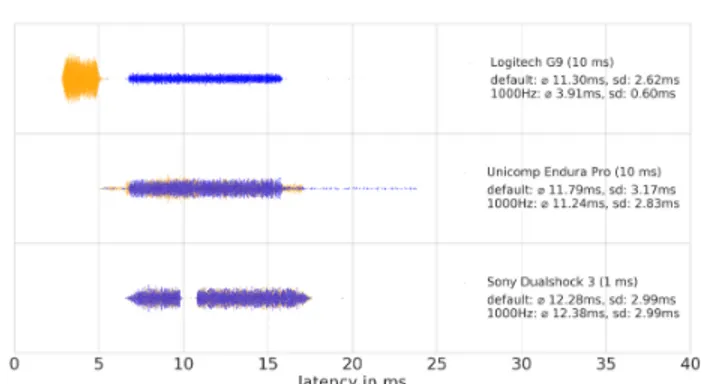
Figure 1: Latency of input devices varies significantly between devices. This becomes especially obvious when plotting the la- tency distributions gained from multiple measurements (blue).
Reporting such latency distributions instead of average latency exposes individual quirks and common patterns (bottom). When forcing a 1000 Hz USB polling rate (orange), average latency and latency variance shrinks for most (top) but not all devices (mid- dle).
user interface, down to an overall latency of 2 ms. In prac- tice, a maximum latency of 20 ms for touch input and 2 ms for dragging actions is desirable [9]. High latency dis- proportionally increases task completion time for pointing tasks by slowing down feedback loops [18]. In certain com- puter games, such as first-person shooters or real-time strat- egy games, the amount of latency a user experiences de- cides over virtual life or death [12]. In experimental psychol- ogy, researchers conducting reaction time studies are con- cerned about the latency of computers tainting the results [24]. When controlling surgical robots or vehicles, spikes of high latency may cause critical situations and real phys- ical harm [25]. Therefore, reducing and controlling latency is of great importance for designers of such systems. Attig et al. give a good overview of recent findings on the effect of latency on human performance [2].
In order to characterize or reduce the overall latency of a
system, it is necessary to isolate and measure individual
sources of latency, such as input devices, output devices,
network connections, or applications. In recent years,
several researchers and hobbyists have started measuring
the latency of input devices. However, we have found that
previous research reports imprecise or incorrect latencies,
incorrectly uses overall latency as a proxy for input latency, and neglects the important effects of polling rate and phase on latency.
We present a simple method for precisely and accurately characterizing the latency of common input devices, such as computer mice, keyboards, joysticks and gamepads. To achieve this, we explicitly choose three limitations:
Focusing only on USB-connected input devices makes it easier to compare devices and reason about technical issues.
While sensors may be connected to a computer through vari- ous interfaces (e.g., I2C, SPI, UART), the Universal Serial Bus (USB) [27] is by far most common wired peripheral interface on desktop computers, notebooks, and mobile phones at the moment. The wide choice of available input devices allows users and designers to actually choose an input device based on its latency.
Limiting latency measurements to binary button presses allows for more accurately characterizing input latency. Un- like mouse or joystick movement, button presses are easy to reproduce repeatedly, have a quite clearly defined starting point (when electrical contact is made), and have no inher- ent noise. Furthermore, mice, keyboard, and gamepads all contain buttons, allowing to compare their latency.
Ignoring the mechanical latency of a button press improves accuracy, precision and reproducibility of the measurements. The amount of time between a user pressing a button and it closing an electrical contact is undoubtedly an important characteristic of an input device. However, as Oulasvirta et al [22] show, pressing a button is an inherently complex neuromechanical process. Thus, it is conceptually hard to define at which point in time a button press is initiated. Furthermore, humans are quite bad at precisely repeating the same movement thousands of times.
For conducting the measurements, we implemented LagBox, a simple Raspberry-Pi-based tool that measures latency of USB-connected input devices by repeatedly electrically triggering a button on the device and detecting the input event on the Raspberry Pi. LagBox can automatically conduct thousands of latency measurements per input device, reproducibly collecting more data in a shorter time period and with higher accuracy than manual approaches.
Our measurements show significant differences between devices and highlight some peculiarities and commonalities (Figure 1). Most importantly, we found that latency distri- butions differ so much between devices that only reporting average latency and standard deviation may be misleading.
In order to better understand and explain how these latency distributions are generated, we developed a probabilistic simulation of input latency that allows reproducing many of the latency distributions we observed.
Our work is intended to provide guidance and tools for re- searchers, practitioners, and enthusiasts who want to mea- sure or improve latency. The main contributions in this pa- per are: a model of latency in input devices, a set of guide- lines for measuring and reporting latency, a robust method for measuring latency of USB-connected input devices with high accuracy and precision, and a collection of measure- ments illustrating important characteristics of input device latency.
This paper is organized as follows: In the next section, we shortly introduce basic concepts of Latency in Interactive Systems. Afterwards, we give an overview of Related Work, present A Model of USB Input Latency, and discuss challenges when Measuring and Reporting Input Latency.
We describe the implementation of our measuring system, LagBox, and present Latency Measurements, for 36 USB input devices gathered with LagBox. After a Discussion of limitations and general insights that can be gained from our measurements, the paper ends with a Conclusion and Outlook on future work.
2 LATENCY IN INTERACTIVE SYSTEMS
As famously described by the Card et al.’s human processor model [4], interactive systems are part of a continuous feed- back loop wherein the user performs an input action which is received and processed by the system. The system’s out- put is in turn perceived by the user who reacts to it. La- tency in an interactive system slows down these feedback loops and thus increases the time needed to perform a task.
The most important latency metric for interactive systems is end-to-end latency, also sometimes called system latency or overall latency. It usually refers to the delay between user input and perceivable system output 1 . We define end-to-end latency as the amount of time that passes between the user starting to change a physical state which is monitored by the system (e.g., pressing a button on a keyboard) and the sys- tem starting to output something in response to the user’s action (e.g., as a change of screen content on a monitor, au- ditory, or haptic feedback). In order to reduce end-to-end latency, its individual components need to be analyzed and reduced. These partial latencies can be roughly grouped into input latency, processing latency, and output latency. We de- fine input latency as the delay between the beginning of a physical state change (e.g., button press) and an application receiving notice of this state change. Processing latency is the delay between an application receiving notice of a phys- ical or digital state change and the application handing over the results of the state change to the operating system (or
1
A detailed description of the many individual steps involved when typing a search term into a web form and pressing Enter can be found at https:
//github.com/alex/what-happens-when
computer if no OS is involved). Processing latency may also typically include network latency, disk latency, etc. Output latency describes the delay between the output data being handed over to the operating system and it actually being presented to the user.
This rather crude grouping has the advantage that it mirrors the typical separation of concerns in developing, using, and studying interactive systems. Rarely do application devel- opers also implement input/output hardware, correspond- ing operation system drivers, or input/output frameworks.
As most interactive systems allow for adding or exchang- ing individual input or output devices, users interested in reducing the end-to-end latency of their system can choose appropriate input and output devices independently from the applications. As we discuss later in this paper, measur- ing just end-to-end latency does not allow inferring the ac- tual latency of a component. Only by focusing on individual parts, we are able to identify why and how latency varies. In the remainder of this paper we focus on measuring input latency.
3 RELATED WORK
Measuring input latency has been a pastime of researchers, engineers, and hobbyists for decades. The latency measure- ment methods employed in previous research can be cate- gorized in the following ways:
• directly measuring partial latency vs. using end-to-end latency as a proxy metric
• destructive vs. non-destructive rigging of input devices for latency measurements
• reporting absolute latency of a device vs. reporting rela- tive latency compared to other devices 2
3.1 End-to-End latency on Desktop Computers Many previously presented approaches measure end-to- end latency, i.e. the time difference between an input event (e.g., the user pressing a button) and an output event (e.g., a change of screen contents). By varying only one part of the processing pipeline - such as the input device that is being used - one may indirectly determine latency differences caused by these changes und thus non-destructively mea- sure relative, partial latency. This approach is often done using a video camera [10]. Industrial cameras and high-end mobile phones offer frame rates of several hundred or thousand frames per second, allowing for measuring latency with high precision. However, accuracy of such approaches is problematic. Video footage needs to be manually analyzed in order to find the point in time where
2
i.e., the difference in latency between an input device and either a refer- ence device (whose absolute latency does not need to be known) or multiple other devices.
an input event occurs. In many cases, it is not easy to precisely define the beginning of an input action. Casiez et al. [5] - who also give a good overview of related work on latency - present a non-destructive approach for measuring absolute end-to-end latency of a computing system. To this end, they place a computer mouse on a display that shows a moving pattern which stimulates the mouse into reporting movement. Measuring the time between pattern change and mouse event gives an estimate of end-to-end latency.
The authors report results of measurements with different graphical toolkits and for different computer mice. In a later publication, Casiez et al. [6] present another method for measuring end-to-end latency. They attach a piezoelectric vibration sensor to the user’s finger to capture tapping and button-pressing. An application running on a computer changes screen contents when receiving an button-press event. A photodiode is used for capturing this screen response. An Arduino board captures input from both sensors and measures the time between both events. While the authors’ focus is on presenting a measuring method, they mention that output latency makes up most of the end-to-end latency they measured 3 . Casiez et al. report an input latency of 12 ms for a computer mouse polled at 125 Hz and 2 ms for a gaming mouse polled at 1000 Hz.
3.2 End-to-End Latency on Touch Screens
Deber et al. present a similar tool for measuring the end-to- end latency of devices with touch screens [8]. Their “Latency Hammer” uses a metallic probe that is placed on a capaci- tive touch screen. When connecting the probe electrode to ground, a touch event is simulated. A photodiode connected to the “Latency Hammer” captures the screen response.
Mooney and Koudritsky, engineers at Google, have pub- lished tools for measuring input latency of touch screens - Quickstep 4 and its successor WALT 5 . Both employ simple custom hardware which senses input events in the physical domain. The difference between the timestamps of the physical input event and of the digital input event (as recorded by the operating system’s kernel) gives the latency of the touch screen. Using these tools, Mooney and Koudritsky found that typical tap latencies for touchscreens in mobile devices are in the range of 10 - 45 ms 6 .
3
Leo Bodnar Electronics sells a Video Signal Input Lag Tester which al- lows for measuring the latency of TVs and computer monitors. http://www.
leobodnar.com/shop/?main_page=product_info&products_id=212
4https://docs.google.com/document/d/1B3GfZkwAfHlQE5kAuHcn-wq8I - 7D5UF2Ap7C_CYk5co/
5
https://github.com/google/walt
6
Mark Koudritsky, personal communication, 2016-04-12.
3.3 Input Latency
While the aforementioned research allows for indirectly measuring the latency of input devices, few researchers have directly measured input latency. Most notably, Plant measured the input latency of eight computer mice, a keyboard, and a response box 7 connected to a computer via the serial port, PS/2 or USB [24] . An oscilloscope was used to measure the delay between a (simulated) button press on the device and a signal being emitted to the computer. Each measurement was repeated 80 times. Latencies recorded ranged from 6.5 ms to 60 ms for the mice. The keyboard had a latency of 28 ms, whereas the response box had a latency of only 1 ms. Plant et al. also report on previous attempts to measure mouse latency ranging back to 1990. Plant has published several other papers on this topic over the last decade, urging psychologists to measure and control input latency in their experiments [23].
Luu conducted experiments measuring the latency of mul- tiple keyboards by manually triggering keys and inspecting the output of a logic analyzer attached to the USB cable [16].
The measurements are rounded to 5 ms increments and Luu estimates an error in the 1 ms to 10 ms range. Luu also re- ports on further experiments and sources concerning gen- eral latency of computers and terminals [15,17].
In parallel to academic research, computer gaming enthu- siasts have explored ways to to measure the latency of in- put devices. Overclock.net forum member uaokkkkkkkk has compiled a comprehensive overview of these approaches 8 A very simple, non-destructive way to measure the differ- ence in latency between two computer mice is to connect both to the same computer and simultaneously press but- tons on both mice. This is usually done by placing the left mouse button of one mouse on the right mouse button of the other mouse and rapidly pressing both together. Input device manufacturer Bloody offers a Windows application for this task 9 . The same approach also works for joysticks and keyboards. While simple and non-destructive, this ap- proach requires a second mouse to be available and does not measure absolute latency. Furthermore, if the spring of the micro-switch in the first mouse is stronger than the spring in the second mouse, the second mouse button will always be depressed earlier, resulting in a systematic measurement error. In addition, the approach requires repeated manual action. This introduces additional random and systematic
7
A response box is an external computer peripheral used for reaction time experiments. It usually contains multiple buttons and/or lights and allows for low-latency, high-accuracy/-precision time measurements.
8
http://www.overclock.net/t/1572872/firmware-added-button-delay- testing -attempts-tapping-mouse-buttons-lightly (most information is hidden behind the “spoilers” links)
9
KeyResponse PK, http://www.bloody.tw/en/download.php
measurement errors depending on the user conducting the experiment.
Since 2013 the Japanese blog rafalog 10 has measured the relative latency of more than 50 mice by soldering a single push-button to the micro-switches of both a reference mouse (Logitech G300) and a mouse to be tested. Pressing this button simultaneously closes the electrical circuits of both mice, mitigating the major limitation of the aforemen- tioned Bloody approach. The rafalog approach is destructive and only reports relative latency. However, as they use a Logitech G300 as reference mouse in all tests, whose absolute latency we report in this paper, absolute latencies for the other mice can be easily calculated. A commenter on rafalog, Chou Star, seems to have implemented a system that is quite similar to our LagBox 11 . They use the GPIO pin on a Raspberry Pi to toggle the electrical circuit of a mouse button while the mouse is connected to the Raspberry Pi. A video shows latency values for the G300 which are in the 3 - 5 ms range, roughly similar to the ones we measured.
Another blogger, sousu, conducted absolute, end-to-end latency measurements for over 50 mice with another destructive method 12 . They soldered a phototransistor to the contacts of the mouse button and glued it to a computer screen. The measuring software turned the screen white causing the phototransistor to become conductive and trig- ger the mouse button. The latency between screen update and mouse event was measured. Latency values seem to be a few milliseconds higher than our measurements as end-to-end latency was measured.
Overall, we found that only few researchers and hobbyists investigated the latency of input devices so far. Most exist- ing approaches either use end-to-end latency as a proxy for input latency or measure only relative latency. In general, only average latency, and sometimes standard deviation, is reported. As discussed in the following sections, both prac- tices distort the actual latency profiles of input devices.
4 A MODEL OF USB INPUT LATENCY
When conducting preliminary latency measurements with our system, we were surprised by the latency distributions some devices exhibited (Figure 1). In order to better under- stand the observed data, we developed a simple model that helps to explain how complex latency distributions may arise from a combination of individual latency sources.
10
http://web.archive.org/web/20160224102835/
https://utmalesoldiers.blogspot.de/2013/02/114.html
11https://www.youtube.com/watch?v=u9z62MKX_Wg
12http://sousuch.web.fc2.com/DIY/mouse_latency/index.html
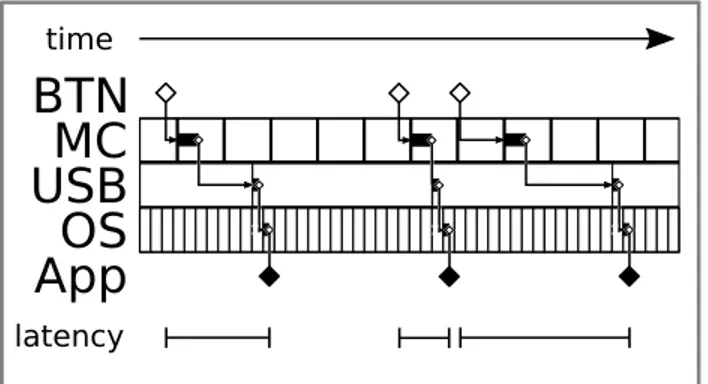
USB MC App OS BTN
latency time
Figure 2: Simplified illustration of the path an input takes from button press to the input event arriving at the application. Each step adds constant latency (black bar). The microcontroller (MC), USB, and operating system (OS) also add varying amounts of la- tency depending when an event is handed over within a scan- ning/polling interval. Overall input latency therefore varies sig- nificantly depending on when the button is pressed.
4.1 Types of Latency in a Button Press
When a user presses a button on an USB-connected input de- vice, the following individual steps happen, each with its as- sociated latency (approximate orders of magnitude in paren- theses):
1. the user first touches the input device,
2. the user overcomes activation force and triggers a me- chanical switch (~ 20 ms [11]),
3. the mechanical switch closes an electrical circuit, 4. the closed circuit is detected by the device’s controller
chip (~ 1-20 ms),
5. after processing the sensor data the chip puts data into a USB buffer (~ 1-20 ms),
6. the host computer queries the USB device for new data (~ 1-10 ms),
7. the device sends data over the wire (0.001 ms),
8. the host computer notifies the OS about new data from the USB (0.001 ms),
9. the OS has processed the data and made it available to userland libraries (0.01 ms),
10. user code has received an input event from a userland library (0.01 ms).
The overall latency of a button press is therefore in the range between 23 and 70 ms, depending on user, button, and con- text. In this paper, we focus on non-mechanical latency com- prised by steps 4 - 10. While each individual step contributes latency, the amounts and distributions of these partial laten- cies are very heterogeneous and device-specific.
Figure 2 shows a slightly simplified example of the involved latencies.
Detecting a closed switch (step 4) may be either done via a hardware interrupt in the controller or by regularly scan- ning the state of the switch. In general, hardware interrupts are consistently processed within microseconds, adding constant latency. Scanning introduces variable latency: if the button is pressed right before the controller checks its state, latency is low; if the button is pressed immediately after the controller checked its state, the controller will only find out about this the next time it scans the state of the switch. In most cases, hardware interrupts provide little benefit and add complexity to the code. As far as we know, most USB input devices sequentially scan switch state in the main loop of the controller code 13 .
Processing the input in the device’s controller (step 5) may take constant time in theory. In practice, different code paths may be taken which introduce a set of distinct con- stant latencies. For example, debouncing 14 or integrating the state of other sensors may require a variable amount of time.
These three types of latency - constant latency, variable la- tency, and a set of distinct latencies may be used to char- acterize each processing step. Of course, in reality constant latency is not perfectly constant but shows some spread due to physical noise. Variable latency may exhibit different dis- tributions, most commonly uniform or normal distributions.
While processing of USB events on the host computer (steps 8-10) usually occurs within microseconds, USB polling (steps 6-7) introduces variable latency up to several dozen milliseconds and thus warrants closer inspection.
4.2 The Role of the USB Polling Rate
HID-class USB input devices [28], such as keyboards, mice, joysticks, and gamepads, communicate with a host computer using interrupt transfers. Despite their name, interrupt transfers do not actually rely on hardware in- terrupts. Instead, the host computer periodically polls the USB device for new data or sends new data to the device [27]. In contrast to other transfer types, interrupt transfers are guaranteed a maximum upper latency limit. A device endpoint may specify a polling interval via its bInterval field which is transmitted during registration of the device with the host. This polling interval specifies how much time may pass at maximum between two polling events.
13
If an input devices has many keys, such as a keyboard, matrix scanning is employed. This implementation choice does not substantially affect latency, however.
14
The metal contacts in mechanical micro-switches tend to bounce slightly after impact, resulting in multiple short interruptions of the contact. The controller firmware has to filter out these ‘echoes’, e.g. by not accept- ing repeated button presses for a limited time. Some device manufactur- ers employ optical switches which do not require debouncing (e.g., http:
//www.bloody.tw/en/Products.php?pid=28, http://www.wooting.nl/)
According to the USB HID specification, for high-speed input devices (connected via USB 2.0) the polling interval may be in the range of 1 to 255 ms [28:69]. For low-speed input devices (USB 1.1), the minimum polling interval is 10 ms [27:51]. The actual polling interval may be shorter but is guaranteed to be not longer. On Windows, the maximum polling interval is limited to 32 ms [19]. In practice, polling intervals are rounded down to the next lower power of two, at least on Windows [19] and Linux [14]. This allows for better allocation of available bandwidth. Therefore, an USB HID device specifying a desired polling interval of 10 ms is usually polled every 8 ms, i.e. with a polling rate of 125 Hz. If the polled device does not have any new data available in its USB buffer, it sends a NAK packet. It is therefore possible and specification-conforming to poll a HID device at a higher rate than specified. For example, the usb_hid driver in the Linux kernel allows specifying a custom polling rate for HID mice and joysticks. Similar functionality is offered by vendor-provided and inoffical Windows tools. It is primarily used by gamers to reduce input latency. We investigated the effects of polling devices with the maximum rate of 1000 Hz. Results are described in the Latency Measurements section.
An important aspect of USB devices being polled at fixed in- tervals is that their latency in no small part depends on the polling rate. Even if an input device rapidly detects and pro- cesses a button press, the host computer only learns about the button press when it polls the device the next time. How- ever, a low polling rate results not only in higher overall la- tency but also in significant variance in latency. This issue is rarely acknowledged at all in studies of input latency. An- other important aspect to consider is polling phase of each latency component, i.e. the relative displacement between the scanning/polling intervals of devices within a process- ing chain. Overall input latency may vary a lot depending on the phase difference between the involved polling inter- vals. We describe both effects in more detail in the following section.
4.3 Simulating Input Device Latency
In order to verify whether our understanding of input de- vice latency is correct, we developed a simple programmatic model of input latency for USB devices. As most device man- ufacturers do not publish the source code for their firmware, input devices are essentially black boxes. However, based on the assumptions described above and example source code providedme.g., by Cypress Semiconductors 15 , one may build a model of a typical input device. Such a model has three pur- poses. First, the model allows us to validate our understand- ing of input device latency by comparing predicted latencies
15
http://www.cypress.com/file/103181/download
a) b)
c)
MC latency: 3 / 7.7 ms MC scan rate: 300 Hz USB poll rate: 1000 Hz
MC latency: 3 / 7.7 ms MC scan rate: 300 Hz USB poll rate: 125 Hz
MC latency: 4.7 / 9.4 ms MC scan rate: 200 Hz USB poll rate: 1000 Hz
Figure 3: Simulations of input latency for a controller with two code paths. Small changes in partial latencies, scanning rate, polling rate, and polling phase produce distinctly different la- tency distributions.
with empirically measured latencies. Second, the model al- lows for predicting latency distributions of input devices if components are known. Third, the model allows to find the latency properties of input devices by adjusting model pa- rameters, such as keyboard scan rate, until the predicted la- tencies match measured latencies. In this paper, we focus on the first use case, showing that a simple combination of par- tial latencies may produce complex latency distributions.
In our model, each major latency component - button, microcontroller, USB bus, and OS - is implemented as a Python object that adds intrinsic latency and polling-related latency. The intrinsic latency can be either a constant value or randomly chosen from a set of constant latencies (which may exhibit a certain distribution as described above).
Furthermore, each component has a polling/scanning rate and a polling/scanning phase. From these values, the polling-related latency is determined. When running the simulation, a randomized start time is passed to the button object which adds its intrinsic and polling-related latency and returns a new timestamp. This timestamp is in turn passed along by the microcontroller, USB, and OS objects which each add their own intrinsic and polling-related latency.
Figure 3 shows the latency distribution for 2000 simulated measurements. In this instance, the microcontroller had two
“code paths” with different latency from which one was cho-
sen at random. While the distinct latency of each code path
is clearly visible in Figure 3a - where the USB polling rate
was set to 1000 Hz / 1 ms, the latency distribution for polling
at 125 Hz / 8 ms (Figure 3b) hides the effect of different code
paths on latency. Figure 3c shows the simulated latency dis-
tribution for a controller with slightly different values for
latency and scanning rate.
Figure 4: Actual latency measurements for two gamepads visu- alized in five different ways: a) bar charts, b) box plots, c) violin plots, d) histograms with kernel density estimates and rug plots, e) swarmplots. Only swarm plots and histograms faithfully show peculiar latency characteristics.
Adding many partial latencies which have a uniform or normal distribution always leads to a more or less normal- distributed overall latency if the ranges are in the same order of magnitude. However, partial latencies that have a distribution with much higher average or variance than the other latency distributions, dominate in the overall latency distribution. Thus, a low USB polling rate smoothes and broadens the overall latency distribution.
For reporting latency distributions, we strongly suggest us- ing swarmplots which are similar to histograms but show each individual measurement as a dot. Other forms of vi- sualizations, such as bar graphs, boxplots, violin plots, or histograms may hide important characteristics (Figure 4).
5 LAGBOX
In order to accurately and precisely measure input latency, we used LagBox [3], a system for automatically triggering the buttons of input devices and measuring how much time passes until the corresponding input event is received. This device was used for conducting all measurements presented in this paper. In order to simplify device design and make the device affordable for a wide audience, LagBox is built around a Raspberry Pi 2. A shown in Figure 5, an optocou- pler is connected to a GPIO pin on the Raspberry Pi. The
input device optocoupler
150 Ω
Raspberry Pi 2
GND
GPIO22 USB
microcontroller buon probes
GND
Figure 5: The LagBox measurement circuit. Via an optocoupler (Fairchild Semiconductors H11A817) connected to a GPIO pin, the Raspberry Pi triggers the button of an input device and mea- sures the time until the USB event arrives.
switched side of the optocoupler is connected to the con- tacts of a button in the device that is to be tested. The con- nection can either be made via soldering or via micro-clips or pogo pins 16 . The device under test is also connected to the Raspberry Pi via USB. When the GPIO pin is pulled high, the optocoupler electrically connects both contacts of the button, thereby simulating a button press. This is registered by the input device’s microcontroller which stores the new value in its USB buffer and transmits it to the host computer the next time the USB endpoint is polled.
LagBox offers two user interfaces - a versatile command line interface and a graphical frontend written in Python.
A small application written in C handles measurements and logging. It is optimized for low overhead and low latency in the critical code path. The general testing algorithm is as follows:
start:
wait pseudo-random amount of time set GPIO pin to activate optocoupler record timestamp
loop:
read from Linux device
if new event of correct type available:
record timestamp
calculate and store latency goto start
else:
sleep for 10 µs goto loop
Potential latency sources in our measurement setup are the main loop of our measurement software, triggering the GPIO pin, and handling the USB packet. We have verified that all of these inherent latencies are in the low microsecond range, adding up to much less than 0.1 ms.
Thus, we are confident that our setup accurately measures latency in the millisecond range with sub-millisecond accuracy.
16
We used the Hirschmann MICRO-KLEPS clips and MPS2/0.64FT probes.
Between each two latency measurements, our code waits for a pseudo-random amount of time between 100 and 1000 ms in order to emulate button presses at random times. If one would not wait and trigger the button again directly after an USB event has been received, the next event would usually arrive exactly polling interval milliseconds later at the next time when the device is polled.
6 LATENCY MEASUREMENTS
In the following, we describe measurements that we conducted using LagBox. Overall, we measured the latency of 36 commercially available USB devices (including wired and wireless variants): 11 keyboards, 16 mice, and 9 gamepads. Our choice of devices was determined by three factors: availability, published latency measurements in related work, and popularity. Input devices which only had a PS/2 connector were measured using a PS/2-USB adapter reporting a bInterval of 10 ms. For each device and each choice of polling rate, 5000 latency measurements were conducted. After each 1000 measurements, we disconnected and reconnected the input device in order to mitigate any synchronization effects.
6.1 General Comparison
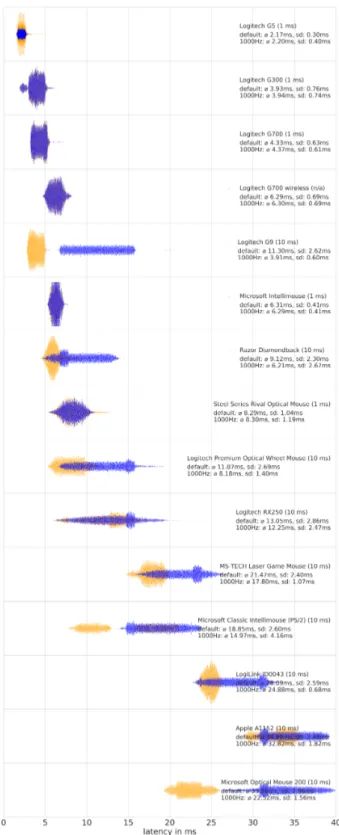
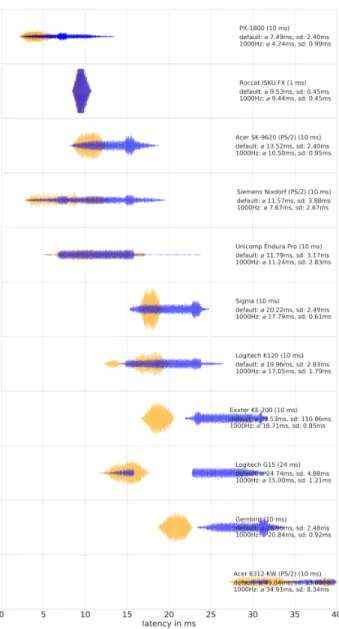
As shown in Figures 6 - 8, significant differences exist be- tween devices and between device classes. Latency distri- butions are shown as overlayed swarmplots - blue for the default polling interval, orange for a forced 1000 Hz polling rate (see below).
6.2 Forced 1000 Hz polling.
While USB devices report the desired polling rate in their endpoint descriptors, the operating system may poll the devices more often - up to every millisecond (1000 Hz).
The Linux usbhid driver offers a configuration option to manually define the polling interval in milliseconds for mice ( usbhid.mousepoll=N ), joysticks ( usbhid.jspoll=N ), and keyboards ( usbhid.kbpoll=N ) 17 .
As only the mousepoll parameter was implemented when we started our research, we modified the usbhid driver so that the manually defined polling interval applied to all de- vices. For all tested input devices, we measured the latency once when polled at their requested polling rate, and once when explicitly polled at 1000 Hz. In Figures 6 - 8, latency distributions for the default polling rates are plotted in blue, whereas distributions for polling at 1000 Hz are plotted in orange. If the blue plot completely occludes the orange plot, this means that polling at 1000 Hz makes no difference – usually because the device is already polled at 1000 Hz by default.
17