Research Collection
Report
Building Anthropogenic heat flux in Singapore
Author(s):
Santos, Luis Guilherme R.; Singh, Vivek Kumar; Mughal, Muhammad Omer; Riegelbauer, Emanuel;
Fonseca, Jimeno A.; Norford, Leslie K.; Nevat, Ido Publication Date:
2020-09-15 Permanent Link:
https://doi.org/10.3929/ethz-b-000440490
Rights / License:
Creative Commons Attribution 4.0 International
DELIVERABLE TECHNICAL REPORT Version 02 - 07/01/2021
D1.2.2.4 – BUILDING ANTHROPOGENIC HEAT FLUX IN SINGAPORE
Project ID NRF2019VSG-UCD-001
Project Title Cooling Singapore 1.5:
Virtual Singapore Urban Climate Design
Work Package ID WP1.2 – Environmental Assessment
Deliverable ID D1.2.2.4 - Anthropogenic Heat from Buildings
Authors
Luis Guilherme R. Santos, Vivek Kumar Singh, Omer Mughal, Emanuel Riegelbauer, Jordan Ivanchev, Jimeno A. Fonseca, Leslie Norford, Ido Nevat
DOI (ETH Collection) 10.3929/ethz-b-000440490
Date of Report 07/01/2021
Version Date Modifications Reviewed by
1 07/09/2020 Original Jimeno A. Fonseca,
Leslie Norford, Ido Nevat 2 07/01/2021 Revision: Addition of Appendix III, which looks into
the hourly variation of AH Flux and compares with other heat sources
Jimeno A. Fonseca
Executive Summary
Buildings are amongst the biggest sources of anthropogenic heat in cities. In Singapore, buildings consume close to 28 TWh/year, which is eventually rejected as heat into the environment. It is believed that this amount may contribute to raising temperatures in the city state and thus urban warming. In order to provide a better understanding this phenomenon, this work characterizes the distribution of anthropogenic heat flux from buildings in Singapore. The focus lies in the analysis of the heat generated by different building morphologies and typologies throughout a typical year across the island.
The methodology is divided into two parts. In the first part, we assess the energy consumption of over 13,000 buildings in Singapore across diverse building typologies (commercial, private housing and public housing [HDB]) and local climate zones. The result is the mean sampled energy use intensity for three main typologies: commercial buildings, public housing (HDB) and private housing. The mean sampled energy use intensity for each typology is validated against energy statistics. The second part combines this information with a Local Climate Zone (LCZ) - Land Use map, resulting in a map of Singapore’s building anthropogenic heat flux and an estimation of total anthropogenic heat released over one year, also validated against reported energy consumption.
The analysis of Energy Use Intensity (EUI) revealed that commercial buildings (mean EUI of 267 kWh/m²/yr.) can be four to five times more energy intensive than public (50 kWh/m²/yr.) and private housing (72 kWh/m²/yr.). The EUIs for each typology tend to remain nearly constant for different LCZs, which is expected, given that the effect of different morphologies is not evident when normalizing the energy of buildings per gross floor area. The EUI is converted into anthropogenic heat density (AH Density) with the use of the Floor Area Ratio (FAR) index, which is the ratio between gross floor area and site area. The AH density, expressed in annual heat per site area, is then converted into anthropogenic heat flux (AH Flux), assuming a constant distribution of power throughout the year.
In terms of AH flux, the highest flux is generated in compact high-rise areas (LCZ1), with AH flux of commercial buildings (105 W/m²) being 6 to 7 times higher than private (15 W/m² ) and for public housing (18 W/m²). The lowest anthropogenic heat flux is observed in sparsely built regions (LCZ9), with AH flux ranging from 2 W/m² in residential buildings to 7 W/m² in commercial buildings. In Singapore, open lands (LCZ3, LCZ4 and LCZ5) comprises 70% of the built-up spaces, with 34% of the site area from buildings corresponding to high rises (LCZ4) and 27% to open mid-rises (LCZ5). In those regions, the average heat flux from commercial buildings (55 – 91 W/m²) is estimated to be 8 to 11 times higher than private housing (5-11W/m²) and 6 to 7 times higher than public housing (HDB) (9- 13W/m²).
The spatial distribution of AH flux presents a clearer distinction between commercial and residential areas. Commercial areas are, as expected, the most heat intensive areas, with a range of AH flux between 70 and 110 W/m² in business and retail areas such as Central Business District (CBD), Orchard Road, and the Mapletree Business City, but also with a significant amount (40-90 W/m²) in university campuses. Although residential buildings have an AH flux five to twenty times lower than the commercial sector (2-20 W/m²), residential buildings are distributed over an area three times larger than that of commercial buildings. Therefore, residential buildings are still significant, representing around 30% of the total AH emitted in Singapore.
In terms of total anthropogenic heat, LCZ4 and LCZ5 present the highest share of aggregated heat released, due to their larger site area coverage. Up to 62% of the AH released coming from buildings is observed in those urban morphologies. From that, 65% is due to commercial (10.69 TWh/yr.) and 35% is due to residential (5.80 TWh/yr.), also indicating how much more intensive the commercial sector is in Singapore.
Our results provide a visual representation of the direct contribution of buildings to anthropogenic heat emissions across Singapore, highlighting the hotspots across the island. It also establishes the basis for the evaluation of “what-if” scenarios, such as changes in the Master Plan or assessing the potential impact of new developments. Future work will explore the incorporation of building energy models in this framework, accounting for hourly variation throughout the day and a potential to explore a wider range of “what-if” scenarios related to building technology.
Table of Contents
Executive Summary ... 2
1 List of Definitions ... 5
2 List of Abbreviations ... 10
3 Introduction ... 11
3.1 Objectives ... 13
4 Methodology ... 14
4.1 Part I – Estimation of building Energy Use Intensity (EUI) ... 15
4.2 Part II – Scalability of anthropogenic heat to the city scale ... 20
5 Results ... 25
6 Conclusions ... 32
6.1 Summary of findings ... 32
6.2 Limitations ... 34
6.3 Future Work ... 35
7 References ... 36
8 Appendix ... 40
8.1 Appendix I - Spatial distribution of anthropogenic heat flux from buildings ... 40
8.2 Appendix II – Comparison with an LCZ based method ... 42
8.3 Appendix III – Hourly Anthropogenic Heat Flux for an Average Day ... 48
1 List of Definitions
GROSS FLOOR AREA (GFA)
Total floor area inside the building envelope, including the external walls, and excluding the roof. More specific definitions of Gross Floor Area (GFA), including which areas are to be counted towards it, may vary throughout distinct codes and standards. The small differences between the definitions from different codes and standards are out of scope for this work. Instead, we consider the more general definition of GFA, given by:
!"# = %!× #! [)"] (1) Where:
%!: Number of floors.
#!: Floor area (m²).
FLOOR AREA RATIO (FAR)
Also defined as Gross Plot Ratio (GPR), the Floor Area Ratio (FAR) is the share of a building's total floor area (gross floor area) to the size of land upon which it is built. It is given by:
"#+ = !,+ = !"#
##$%&
(2) Where:
##$%&: Site area (m²).
ENERGY USE INTENSITY (EUI)
The ratio between total energy consumed by the building (Ec) and the GFA of the building. Usually measured yearly, it is given by:
-./ = -'0!"# [12ℎ/)². 78] (3)
Where:
-': Total building energy consumption (kWh).
BUILDING ANTHROPOGENIC HEAT (AH)
Expressed in terms of energy, commonly in the resolution of one year (kWh/yr.).
Anthropogenic heat (AH) definitions may vary, but in general AH is defined as the heat emitted from fuel combustion and human activity, which includes transportation, space cooling/heating, industrial processing, and human metabolism. [1]. For hot and humid countries, such as Singapore, space cooling is commonly observed, while space heating is negligible. Due to the complex relationship between buildings and the environment, studies of anthropogenic heat may consider different definitions and assumptions to estimate the impact from buildings in the environment.
In this work we define the AH from buildings as the total anthropogenic energy from the grid consumed by buildings. It includes appliances, lighting and energy required by cooling systems. For this work, appliances fuelled by town gas and oil products, estimated to contribute less than 10% to the total anthropogenic heat, are not considered due to lack of data. Other heat sources, such as solar radiation or human metabolism, are excluded, although they might have an influence on the energy required by cooling systems. At this point, we also do not make a distinction between latent and sensible heat forms, acknowledging that those different forms may impact distinctively on the environment. Nonetheless, such assessment gives a clear evaluation on how buildings have an impact throughout the city and a basis for more detailed evaluation of different forms of heat release. The main sources of energy consumption in a building (9()) are defined by:
9()= , + ; + #< [12ℎ] (4)
Where:
, represents the energy from plug loads, consumed by appliances.
; represents the energy consumed by lighting.
#< refers to the energy consumed by cooling systems (compressors and heat pumps) for the operation of air conditioning.
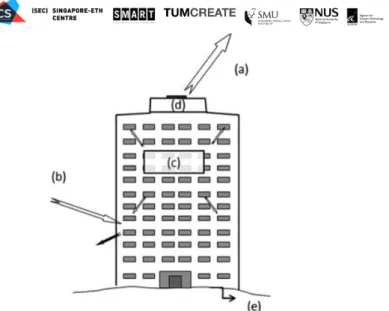
This approach differs from the heat rejection definition [2], which, additionally to the building energy consumption, considers the heat transmitted from the exterior environment and indoor human metabolism. Additionally, the stored heat or heat rejected by other means, such as wastewater, should also be discounted (Figure 1) [2].
Figure 1 – Waste heat rejected from a building (a) is the sum of the environmental loads (b), the internal building loads (c), and the building air-conditioning energy consumption (d), less any heat that is stored or
exhausted through other means such as in waste water (e). Source: [2]
For hot regions, the environmental loads, which include conduction, infiltration and solar radiation can represent the highest part of thermal load, possibly 40-70% greater than the actual energy consumption of buildings [2]. Therefore, it is possible to have an anthropogenic heat effect (heat from cooling systems) heavily influenced by non-anthropogenic heat sources (environmental heat, such as solar radiation). In order to avoid such case, we adopt a definition that intentionally excludes environmental loads and indoor metabolism.
BUILDING ANTHROPOGENIC HEAT DENSITY (AH DENSITY)
Expressed in terms of energy (commonly per year), relative to a site area (kWh/m². yr.).
The anthropogenic heat density is an indication of the amount of energy in a given location over a certain time (yearly for the purposes of this study). It is expressed by:
#= >?%@AB7 = #=
##$%&= -./ × "#+ [12ℎ/)². 78] (5)
Where:
#=: Total building anthropogenic heat released in one year. In our definition (see Eq. (4)), it is equivalent to the total building energy consumption (kWh).
##$%&: Site area (m²)
-./: Building Energy Use Intensity(kWh/m²) (see Eq.(3)) .
"#+: Floor Area Ratio (see Eq.(2)).
BUILDING ANTHROPOGENIC HEAT FLUX (AH FLUX)
Expressed in terms of power (amount of heat/energy transmitted over a certain time), relative to a site area (W/m²). In our studies, the Anthropogenic Heat flux (AH Flux) is calculated by assuming a uniform and constant distribution of the energy generated yearly. It is calculated by dividing the AH Density equally over the entire year:
#= "DEF = #= >?%@AB7
8760 (ℎ/7?L8) [2/)²] (6)
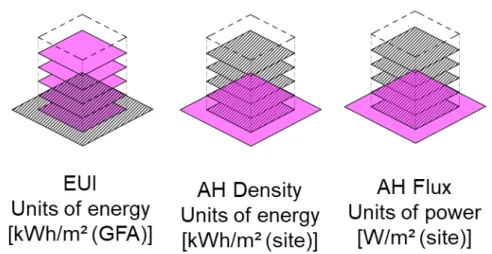
Figure 2 illustrates the differences between the three definitions previously defined. Despite both EUI and AH Density being energy measures, the first is measured in terms of total building floor area, while the second is relative to site space. On the other hand, AH Flux is a measure of power, that reflects how the AH Density gets transferred over a certain time.
Figure 2 – Differences between EUI, AH Density and AH Flux. While for EUI the energy consumed is reported relative to the total building floor area, heat flux is usually expressed relative to the total site area.
Source: [3] (adapted)
LOCAL CLIMATE ZONE (LCZ)
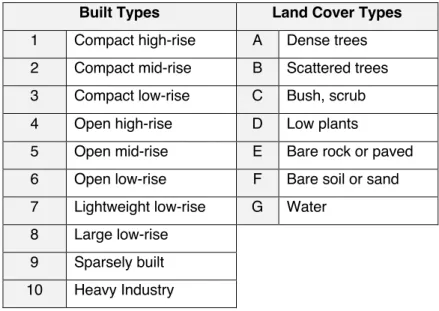
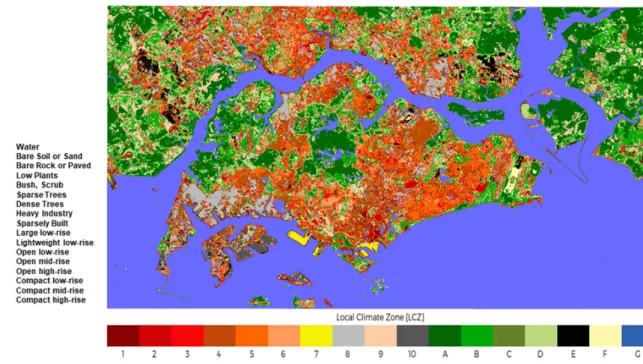
A classification scheme comprised of multiple zones based mainly on properties of surface structure and surface cover. Each zone is local in scale, meaning it represents horizontal distances of hundreds of meters to several kilometres. [1] The main categorization of LCZ types, which is adopted by this work, is indicated in Table 1:
Table 1 – Categories of Local Climate Zones, divided into built types (1-10) and land cover types (A-G)
Built Types Land Cover Types
1 Compact high-rise A Dense trees 2 Compact mid-rise B Scattered trees 3 Compact low-rise C Bush, scrub 4 Open high-rise D Low plants
5 Open mid-rise E Bare rock or paved 6 Open low-rise F Bare soil or sand 7 Lightweight low-rise G Water
8 Large low-rise 9 Sparsely built 10 Heavy Industry
2 List of Abbreviations
AH – Anthropogenic Heat
AH Flux - Anthropogenic Heat Flux
AH Density - Anthropogenic Heat Density
BEM – Building Energy Model
CBD – Central Business District
EUI – Energy Use Intensity
FAR – Floor Area Ratio
GFA – Gross Floor Area
GPR – Gross Plot ratio
HDB – Housing and Development Board
LCZ – Local Climate Zone
LU – Land Use
3 Introduction
Buildings are responsible for the highest electricity consumption in Singapore [4], requiring 25.8 TWh out of the total 50.4 TWh consumed in Singapore during 2018. Most of the electricity consumption from buildings (18.6 TWh) is due to the commerce and service sectors, followed by households (7.2 TWh).
The distribution of electricity consumption per sector can be seen in Figure 3.
Figure 3 - Electricity Consumption by Sector in 2018. Source: EMA, 2019 [4] (adapted)
From the electricity consumed in 2018 by households (7.2 TWh), 58% is due to public housing (HDBs) and 42% is due to private housing, which includes condominiums and landed properties. [4]
Although most of the energy consumed by buildings is due to electricity (around 90%), buildings also consume a small share of natural gas (6%) and petroleum products (4%). Table 2 indicates the distribution of buildings’ energy consumption according to different sectors and different energy carriers.
Table 2 - Energy consumed by buildings in 20161 [4]
Electricity (TWh)
Natural Gas (TWh)
Petroleum Products (TWh)
Total (TWh) (all energy sources) Commerce and
Services-related 17.70 1.07 0.89 19.66
Households 7.60 0.71 0.30 8.61
Total 25.30 1.78 1.19 28.27
1 2016 is considered the year base for most of the analysis of Cooling Singapore as, by the time of the studies, this was the latest year with available data required for the analysis. Furthermore, 2016 marked a period of heatwaves
(all buildings)
The overall energy consumption from buildings is also portrayed in the form of a Sankey Diagram in [5], based on the premise that the energy consumed eventually is fully translated into heat. This study indicated that 12% of the energy released in Singapore is due to buildings (highlighted in red). One important aspect not encompassed by the Sankey is the spatial distribution of the heat release.
Buildings and transport tend to release the heat inside the liveable spaces within a city, while industry and power stations tend to be away, in the outskirts of the town. Our work intends to explore the spatial distribution of AH from buildings, building on the past research conducted in this project.
Figure 4 - Sankey Diagram for Anthropogenic Sources in Singapore (ktoe) [5]
The significant contribution of buildings’ energy consumption in Singapore, mainly based on their electricity consumption, influences the outdoor environment and increases the Urban Heat Island effect.
For a better understanding of this effect, it is essential to characterize the spatial variation of the energy being consumed by this sector, as well as the localized impact of heat released.
To illustrate this crucial aspect, we analyse metered data from more than 13,000 buildings, together with an LCZ classification map developed for Singapore and the Singapore Master Plan, which classifies Singapore according to its Land Use. We evaluate and compare the spatial variability of building AH in Singapore using a combined Local Climate Zone-Land Use (LCZ-LU) map. Trends in energy consumption are observed, identifying the biggest contributors and hotspots in town. Validations are done per typology both at building level, as well as in the form of aggregated yearly electricity
3.1 Objectives
The goal of this report is to characterize the spatial distribution of anthropogenic heat from buildings in Singapore, according to different morphologies (represented by Local Climate Zones [LCZ]) and building typologies (represented by Land Uses [LU]).
The specific objectives of the study are:
1. Develop a framework for assessment of anthropogenic heat from buildings, compatible with Building Energy Models (BEM), at the city-scale.
2. Estimate the spatial distribution of anthropogenic heat flux generated by different building typologies and morphologies in Singapore.
3. Identify hot spots of anthropogenic heat flux from the building sector across Singapore.
4. Compare findings with other existing methods for estimating the anthropogenic heat emissions of buildings.
4 Methodology
The framework is divided into two main parts, represented in an overall workflow in Figure 5:
Figure 5 – Framework for city-scale assessment of anthropogenic heat from buildings. Fields with blue background indicate the original data collected and green background represent data used for validation.
The aim of Part I is to assess building level information and build a profile of energy use intensity for different building typologies, in different LCZ. In order to conduct a spatial analysis of heat released from buildings, we analyse the variability patterns within and between different building typologies (e.g., office, residential), as well as different urban morphologies (e.g., high-rise/ dense areas, sparsely built areas).
We consider data collected from over 13,000 buildings in Singapore, classified between three commercial typologies (office, hotel, and retail) and two residential typologies (private housing and public housing [HDB]). The estimated mean Energy Use Intensity (EUI) is obtained for different typologies, based on a bottom-up approach for sampled buildings’ location and provided energy consumption [6] [7] [8] [9] [10]. Those values are validated against aggregated data, from a top-down approach [4] [11] [12].
The aim of Part II is to generate an estimation of the island-wide distribution of AH flux, based on the building level information developed in Part I and city-scale information related to the buildings’
morphology [13] and land use [14]. For this stage, we overlay the Local Climate Zone (LCZ) and Land Use (LU) maps, obtaining a city-wide map that contains high-level information about the buildings’
typologies and morphologies. Next, we convert EUI to AH flux. Finally, we evaluate the anthropogenic heat flux released at city-scale and validate it according to national energy statistics [4].
4.1 Part I – Estimation of building Energy Use Intensity (EUI)
Data collection and processing
We gathered information for three building typologies across Singapore: Commercial Buildings, Public Housing (HDB) and Private Housing. This information included:
1. Voluntary Disclosed Building Energy Performance Data (Commercial Buildings) (2016) [6], which contains records of energy use intensity and gross floor area for commercial buildings identified by address. We collected a total of 534 building records (306 offices, 122 hotels and 106 retail).
2. Average Monthly Household Electricity Consumption by Postal Code (Public Housing) and Dwelling Type (Jan-Dec 2016) [7]. HDB Property Information [8], which contains number of households per HDB by address. Total electricity consumption per building for 2016 is calculated using those two sources. A total of 8,028 HDBs were considered.
3. Average Monthly Household Electricity Consumption by Postal Code (Private Apartments) (Jan-Dec 2016) [9]. Since the number of households is not reported, it is not possible to precisely infer the buildings’ total electricity consumption, such as for HDBs. We collected a total of 4,970 building records, mostly from condominiums. Landed Houses are in general not reported, due to privacy concerns.
4. Additionally, the post-code or address information is used to obtain the georeferenced locations of the buildings for all typologies [10].
For residential buildings (public and private housing), data is reported monthly and summed in order to obtain yearly energy consumption (Eq. (7)). The data includes a disclaimer that some months may be underreported and included in following months, which should have negligible impact in such conversion.
-**(,-.)= N -**!
0"
$10
[12ℎ] (7)
Where:
-**: Average energy consumption per household per building (kWh/hh) A: month of the year
From the data provided, there is not a common metric that allows the comparison between the three different typologies presented, requiring additional assumptions to extract those. The Energy Use Intensity (EUI) is considered the best metric for comparison, since the area normalization removes the uncertainty of comparing buildings of different sizes.
Commercial buildings have their EUI reported, while residential buildings (public and private housing) have their estimated EUI calculated by:
-./O =-**
#** [12ℎ/)². 78] (8)
Where:
-**: Average energy consumption per household per building (reported) (kWh/hh)
#**: Average household size per typology (m²/hh)
For HDBs, we assume an average size of 40m²/hh for apartments with 1 or 2 rooms, 68 m²/hh for 3 rooms, 96 m²/hh for 4 rooms, and 124 m²/hh for 5 rooms or executive HDBs [15]. For private housing, we assume an average size of 111m²/hh [16]. Energy per household is obtained at the building level for both HDBs and private housing.
We assume that the share of total electrical loads dedicated to common areas is similar to the share of total floor area occupied by common spaces, therefore the EUI of households is a good indicator of the EUI of the whole building. Energy statistics in aggregated form (used for validation) and per household [4] do not account for common spaces. Therefore, our EUI analysis refers to liveable spaces only, compatible with the data provided. The EUI derived at the building level is then used to compare the mean EUI for different building typologies in different LCZ.
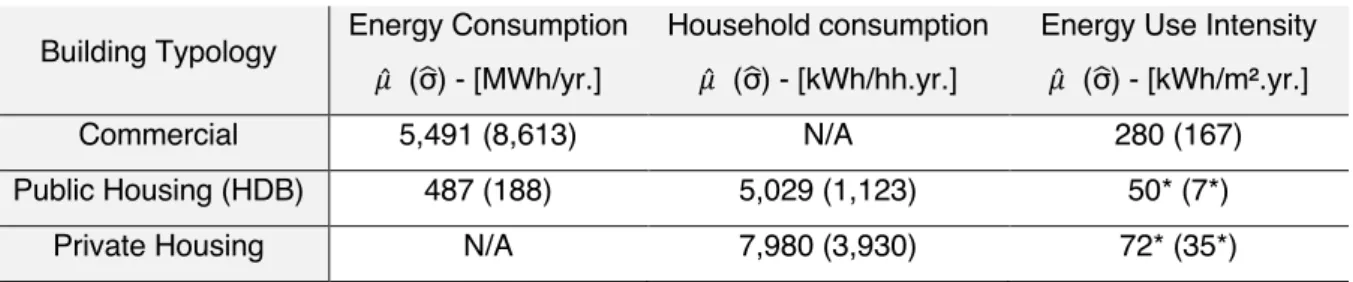
Table 3 indicates the summary of the statistical properties, mean and standard variation (in parenthesis), for each typology analysed:
Table 3– Mean (μ) and standard deviation (σ) energy consumption by building, according to different building typologies. N/A indicates fields where data was not available. * indicates fields where average statistics were assumed to derive this data
Building Typology Energy Consumption P̂ (σR) - [MWh/yr.]
Household consumption P̂ (σR) - [kWh/hh.yr.]
Energy Use Intensity P̂ (σR) - [kWh/m².yr.]
Commercial 5,491 (8,613) N/A 280 (167)
Public Housing (HDB) 487 (188) 5,029 (1,123) 50* (7*)
Private Housing N/A 7,980 (3,930) 72* (35*)
Building Energy Use Intensity per LCZ
In order to characterize the energy and Anthropogenic Heat (AH) generated by buildings at the city scale, it is necessary to consider the differences in urban morphology of neighbourhoods. These differences are normally measured through aspects of building height and density. A good way to factor in these attributes lies in the concept of Local Climate Zones (LCZ) [1]. Local Climate Zone is a classification scheme whereby urban areas are grouped according to similar properties of surface structure. It describes clusters of physical features of a city, including average building height, building density, and sky view factor. Therefore, it is a good indicator of the morphology of an urban area.
In order to obtain the distribution of building Energy Use Intensity (EUI) with respect to different typologies and morphologies, we overlay our georeferenced building samples on a LCZ map [13] (see Figure 6). The LCZ map presents the Singapore region and surroundings divided into 10 clusters of built types (1-10) and 7 clusters of land cover types (A-G), in a 33x33m gridded resolution. Built type refers to areas covered by structures, mostly buildings, and is categorized mainly according to aspects of urban morphology, such as sky view factor, built and vegetation fraction, and average building heights. LCZ1, for example, refers to compact high-rise buildings, and can be observed usually in central business districts.
Our analysis is primarily based on the types that contain buildings. Additionally, LCZ 7 and LCZ10 represent regions with shipping containers and heavy industry, respectively, and therefore are outside of the scope of this work.
Figure 6 - Local Climate Zone map developed for Singapore. LCZs 1-10 indicate built types, while LCZs A-G indicate land cover types. Source: [13]
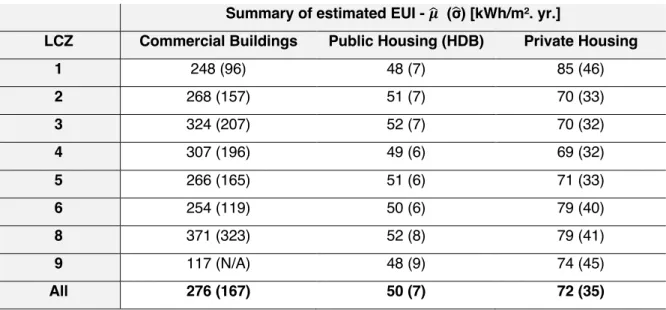
Table 4 indicates the statistical properties of EUI for all the building sample, divided into different LCZs:
Table 4 – Mean and standard deviation of estimated EUI based on the data sampled.
Summary of estimated EUI - SR (σR) [kWh/m². yr.]
LCZ Commercial Buildings Public Housing (HDB) Private Housing
1 248 (96) 48 (7) 85 (46)
2 268 (157) 51 (7) 70 (33)
3 324 (207) 52 (7) 70 (32)
4 307 (196) 49 (6) 69 (32)
5 266 (165) 51 (6) 71 (33)
6 254 (119) 50 (6) 79 (40)
8 371 (323) 52 (8) 79 (41)
9 117 (N/A) 48 (9) 74 (45)
All 276 (167) 50 (7) 72 (35)
By the data provided, we can see a small variability of EUI within the same building typology and a higher variability between typologies. The HDBs presented the smallest standard variation for each LCZ, followed by private housing and commercial.
No clear pattern of EUI variation in relation to the LCZ is observed for any of the typologies. As expected, the Energy Use Intensity of a building is much more related to how it is being occupied rather than the morphology of the buildings, given its normalization per Gross Floor Area.
The increase of the variability within the same LCZ and between different LCZs for each typology is mainly due to two factors: number of buildings sampled and heterogeneity of the sector. In general, HDBs have very similar energy patterns across different buildings, while commercial contains other sub-groups (e.g., retail, office, hotel) with more significant distinction between them. Additionally, the number of commercial buildings reported (534) is one order of magnitude lower than the residential typologies (8,028 for public housing and 4,970 for private housing). This can produce the higher fluctuation in some of commercial areas, for example LCZ 8 and 9.
The overall sampled mean EUI is then compared to top-down statistics, which are representative of the population mean EUI, in a validation process.
VALIDATION
The validation of the buildings’ Energy Use Intensity (EUI) is done by comparing the bottom-up sampled EUI to a top-down calculation of EUI that represents the mean EUI for a certain building typology.
Additionally, we analyse the Gross Floor Area (GFA) of our sample and population for each typology in order to have an evaluation of how much area of buildings in Singapore are covered by our sample.
This verification is important to account for the building-scale uncertainty, which should be assessed in some degree even in a city-scale analysis.
The estimated sample size relative to the population size is given by:
%
T= ∑7 !"##2345&6 610
!"#484952%$8:
(9) Where:
%: Sample size T: Population size
B: number of buildings sampled b: building i.d.
For commercial buildings, the total GFA for commercial buildings is reported in [11], while for residential buildings it is based on the calculated total number of households [4] [12], with the same assumptions about the household size applied previously.
Our relative sample size for the GFA covered by each typology is:
• Commercial buildings: 14% of all the commercial buildings in Singapore
• Public Housing (HDBs): 84% of all the HDB buildings in Singapore
• Private Housing: 55% of all private properties in Singapore (including landed houses) For a larger sample, assuming an unbiased sampling, we can expect that the sample mean EUI converges to the population EUI.
The population mean EUI of a building typology is given by:
-./VVVVV$= -'$
!"#484952%$8: $ [12ℎ/)²] (10)
Where:
-': Total electricity consumption of the i-th building typology. Provided by [4] in aggregated form.
Table 5 presents the sample EUI (from Table 4) per typology in comparison with the top-down calculated EUI, based on aggregated figures of energy [4] and property information [4] [11] [12]
statistics.
Table 5 – Mean sampled EUI, in comparisson to calculated mean population EUI.
Commercial Residential - HDB
Residential - Private
Sample EUI [kWh/m². yr.] 276 50 72
Population EUI
(calculated) [kWh/m². yr.] 267 49 70
Error (%) +3.2% +2.3% +3.0%
Since it is not possible to estimate the variability of EUI within the whole population given the aggregated figures available, our analysis is limited to the comparison of mean EUI.
As indicated previously, the accuracy of the estimated mean sampled EUI is highly dependent on the sample size in respect to the whole population. Additionally, data sampling must be unbiased for more reliable results. Our validation observes a relatively low error for each typology, with the sample mean EUI very near to the expected population EUI. Therefore, we assume our sample is capable of representing the average behaviour of whole population for the purposes intended by this study, proceeding to the city-scale analysis of AH flux distribution.
4.2 Part II – Scalability of anthropogenic heat to the city scale
In Part II, we use the information obtained at the building level in Part I and generalize it for the city scale, estimating AH flux for different areas of Singapore. For that, we use two classification maps that contain complementary information: the Local Climate Zone (LCZ), which was used before to account for different urban morphologies, and a Land Use (LU) map, which indicates the distribution of buildings’
main typologies across Singapore. Additionally, building EUI must be translated into Anthropogenic Heat density and AH flux, a more common metric used to assess the heat flux at the city scale. Finally, the evaluation of city-scale AH flux is presented in a spatial map and validated against aggregated energy consumption reported for each typology [4].
Local Climate Zone – Land Use (LCZ-LU) map
As highlighted in section 4.1.2, two main groups of features, morphology and typology, are important to define the building anthropogenic heat landscape. Therefore, it is also crucial that a city-wide classification method contains such information.
While the Local Climate Zone map defines very well the urbanization of different areas, representing different buildings’ heights and densities, there is typically no information about how those areas differ in terms of building function. Thus, we refer to another map capable of bringing such information. For this study, we use the Singapore Master Plan 2014 Figure 7, which indicates different Land Use (LU) types expected for different regions in the city [14] [17].
Figure 7 – Land Use areas of Singapore, as defined by Singapore Master Plan 2014 Source: [17]
The Master Plan [14] contains 32 types of land-use classification, which this study divided into four groups:
• Non-Anthropogenic Heat (no AH): areas that are expected to have negligible AH, due to reduced number of structures or human activity. Those include agriculture, beach, cemetery, open space, parks and waterbodies, amongst others.
• AH from other sources: areas in which the main AH source is not related to buildings’
typical usage, but instead from another sector. Examples include roads, ports, and airports (related to the transportation sector) or ‘business 2’ (predominantly industrial activity).
• Residential: households in Singapore, represented by the following Land Use types:
residential, residential with commercial on the 1st floor, commercial & residential (predominantly residential), and residential/ institution. The Master Plan makes no distinction between private and public housing, but we are able to infer such areas based on the georeferenced information available for 8,028 HDB units. The residential areas obtained for public housing are aligned with the ones indicated as HDB zones in [18].
• Commercial: diverse types that are believed to be also considered by the “Commercial and Service” sector reported by [4]. It includes: business 1 (predominantly offices and retail), business park, commercial, educational, health and medical, hotel, place of worship and white spaces (which refers to mixed development, but predominantly commercial) [19].
Local Climate Zones (LCZ) and Land Use (LU) maps are overlaid, keeping the original 33x33m gridded resolution of the LCZ map. We consider the area to be a source of building AH if both of the following conditions are satisfied:
a. LCZ index refers to a built use (i.e., an LCZ between 1-10). As indicated in Section 4.1.2, LCZ 7 and LCZ 10 are excluded from the analysis.
And
b. LU types are related either to commercial or residential use.
AH flux based on building Energy Use Intensity
The building energy usage data, reported in terms of Energy Use Intensity (EUI) [kWh/m².yr], is translated to heat density via consideration of the Floor Area Ratio (FAR) or Gross Plot Ratio (GPR) (Eq. (2)).
The conversion is given by:
#= >?%@AB7 = -./ × "#+ [12ℎ/)². 78] (11)
Different FAR values are assumed for each typology and each Local Climate Zone (LCZ), according to its expected height and density. Given the uncertainty of this parameter and difficulty in estimation, the values assumed are adjusted within reasonable range in a manual calibration procedure, so that the total gross floor area expected for each typology is followed. The adjustment is guided by observations from 50 districts in Singapore and maximum allowed FAR reported for certain areas [14].
Additionally, since EUI is evaluated based on yearly energy consumption and the AH flux is evaluated in terms of power, we translate the yearly energy results into a mean power flux by simply uniformly distributing the energy consumption over a constant heat flux throughout the year, dividing it by 8760 (total number of hours in one year). Therefore, the heat flux (AH Flux) is defined by:
#= "DEF = #= >?%@AB7
8760 (ℎ/7?L8) [2/)²] (12)
Although we acknowledge that, in reality, there is a considerable variation between AH in different hours of the day (or finer temporal resolution), the uniform distribution aims to have a general overview about the spatial characterization of Anthropogenic Heat (AH). Additionally, there is a lack of data for hourly consumption of electricity in the buildings reports and major assumptions would be required to derive this data. Therefore, we consider a detailed analysis of the hourly profile of AH flux is outside of scope of this current work and will be encompassed at future stages. Such consideration has also been previously applied for studies of energy from buildings in Singapore [20].
We present an overview of hourly changes in Appendix III, based on hourly profiles derived for Singapore in other studies [21] and the data generated throughout this report.
The AH flux per LCZ and per typology is described in Table 6.
Table 6 - Mean building antropogenic heat flux.
mean AH flux [W/m²]
LCZ Commercial Buildings Public Housing (HDB) Private Housing
1 105 18 15
2 70 12 9
3 85 9 3
4 91 13 11
5 55 9 5
6 35 7 2
8 59 8 3
9 7 2 2
Although private housing has a higher EUI than HDBs, it presents lower FAR, indicating that HDBs are probably taller and denser in comparison to private housing in Singapore. In comparison to private housing, HDBs have 45% higher electricity consumption and 173% more households [4], but 45% less site area coverage, which supports this assumption. On the other hand, according to the LCZ-LU map developed (Section 4.2.1), it has 22% less site area than private housing. Additionally, the lower FAR values in Private Housing may compensate a systematic error, since the Master Plan [14] does not make a distinction between Private Condominiums and Landed Houses and the EUI for Landed Houses is also not reported. Therefore, the HDB indicates a higher AH flux estimation in comparison to private housing, even though it has lower EUI per building.
Spatial distribution of building’s AH
The calculated AH flux (Table 6), obtained primarily from the bottom-up energy survey of individual buildings, is scaled using the LCZ-LU map developed in 3.2.1. In other words, the mean AH flux for each combination of typology and LCZ (Table 6) is applied to each gridded cell from the LCZ-LU map that matches this correspondence. For example, for each Commercial with LCZ1 in the LCZ-LU map, a mean AH flux of 105 W/m² (Table 6) is assigned to it, and so on for all the combinations that corresponds to building AH.
The aggregated figures of heat for the whole year and entire Singapore are compared to energy statistics [4], which reports the following electricity consumption in 2016:
- 4.5 TWh consumed by public housing (HDB) - 3.1 TWh consumed by private housing
- 17.7 TWh consumed by Commercial Buildings -
The total electricity consumption for the three typologies (25.3 TWh) agrees with the electricity share for building AH contribution (2174 ktoe = 25.28 TWh) provided by the overview of AH sources in Singapore [5]. For this calculation, we also consider a vacancy factor of 0% for HDBs [21], 7.7% for private housing [22] [23] and 9.3% for commercial [11].
Results, including the spatial map of building AH and validation, are presented and analysed in section 5.
5 Results
The results for the building anthropogenic heat flux are presented in a grid resolution of approximately 33x33m. The results are analysed and compared against aggregated energy statistics of total electricity consumption in 2016.
Buildings are divided into three typologies: Public Housing (HDB), Private housing (RES) and Commercial Buildings (COM), and each is distinguished according to the different LCZs that represent buildings (LCZ1-6, LCZ8, LCZ9). The anthropogenic heat flux presented for each is converted from two main parameters: Energy Use Intensity (EUI) obtained from energy survey, and the Floor Area Ratio (FAR), which indicates the aspects of building height and density. This allows for the distinction between groups of buildings that have considerably different characteristics in terms of energy consumption.
Spatially, those differences are indicated by different land uses derived from the master plan.
Table 7 indicates the summary of the results for combined building typologies and LCZ for mean EUI (from Table 4), mean AH flux (from Table 6), and site area (directly obtained from the LCZ-LU map, section 4.2.1).
Table 7 - Summary of quantitative results for commercial buildings (COM), public housing (HDB), and private housing (RES).
mean EUI [kWh/m²(GFA). yr.]
mean AH Flux [W/m² (site)]
Site Area [km²]
LCZ Definition COM HDB RES COM HDB RES COM HDB RES
1 Compact high-rise 248 48 85 105 18 15 1.7 1.5 2.1
2 Compact mid-rise 268 51 70 70 12 9 5.7 4.7 4.3
3 Compact low-rise 324 52 70 85 9 3 0.9 0.7 4.5
4 Open high-rise 307 49 69 91 13 11 8.9 21.0 16.1
5 Open mid-rise 266 51 71 55 9 5 7.6 14.0 14.6
6 Open low-rise 254 50 79 35 7 2 2.4 1.8 10.2
8 Large low-rise 371 52 79 59 8 3 3.3 0.9 1.5
9 Sparsely built 117 48 74 7 2 2 3.7 0.3 3.2
As discussed in section 4.1.2, there is significant variability in the EUIs according to the building typology, but not across the different LCZs. Given that the energy consumption is normalized by the Gross Floor Area (GFA) of each building, we can expect a much lower impact of the building morphology. For a certain typology, larger buildings will likely consume more energy but will have an increase of GFA almost on the same proportion, resulting in a steady EUI.
In the mean AH per site area, both the building morphology and typology are important to define its profile, as more dense and higher areas tend to concentrate more heat. LCZ1 and LCZ4 are the ones with the tallest buildings, while LCZ1, LCZ2 and LCZ3 present the highest building densities. Therefore, those areas present the highest AH flux contribution. In proportion to a higher EUI presented by commercial buildings, a significantly higher AH can also be observed for this typology.
With respect to the site areas, the biggest distribution for buildings is for LCZ4 and LCZ5, indicating that open high-rise and open mid-rise areas are more present in Singapore for all building typologies and therefore have more influence on the total AH.
The highest anthropogenic heat flux is generated in compact high-rise areas, corresponding to LCZ1, with AH flux of commercial buildings (105 W/m²) being six to seven times higher than private residential (15 W/m² for private and 18 W/m² for public housing). The lowest intensity of anthropogenic heat flux is observed in sparsely built regions (LCZ9), with commercial areas (7 W/m²) being 3.5 times higher than residential (2 W/m²). In Singapore, there is a predominance of open spaces, with 34% of the site area corresponding to high rises (LCZ4) and 27% being for mid-rises (LCZ5). In those regions, the average heat flux from commercial buildings is estimated to be six to seven times higher than private housing and eight to 11 times higher than public housing (HDB).
In order to have a better representation of the spatial variation of AH in Singapore, we analyse the building anthropogenic heat flux at the city-scale. Figure 8 indicates the results in the Singapore map.
Figure 8 - Spatial distribution of the building antropogenic heat flux in Singapore. The different mean AH intensities are applied for different building typologies (HDB, Private Housing and Commercial) and
different LCZs. A region with higher detail (bleck rectangle) is presented in Figure 9.
A higher resolution version of Figure 8 can be seen in Appendix I and a region with more detail is presented in Figure 9. The visual representation of city-scale AH flux is well aligned with previous studies done in Singapore [20], and similar trends can be observed.
Figure 9 – Anthropogenic Heat Flux for a detailed region in central Singapore (from Figure 8). Examples of commercial areas (a-e) are highlighted in red, and of Residential areas (g-h) are marked in yellow.
The map presents a clear distinction of AH intensity between commercial (a-e) and residential areas (f- g). Commercial areas are, in general, the more heat intensive areas. Office and retail regions, such as Central Business District (CBD) (a), Orchard Road (b), and the Mapletree Business City (c) present AH flux normally ranging from 70-110 W/m², while educational centres (e.g., National University of Singapore (d) and Singapore Polytechnic (e)) tend to present a smaller heat flux (40-90 W/m²), due to the lower built density and height of buildings. Residential areas (f,g) present a significantly lower mean heat flux, under 20 W/m².
Although commercial buildings occupy around 50% less GFA and site area than residential (private + HDB) [4] [11] [12], their electricity consumption is 130% higher [4], indicating the significantly higher intensity of this sub-sector.
The map indicates a large coverage of low AH flux, occupied by residential buildings (HDBs and private housing). Although open high and mid-rise are the most common occurrence for those sectors, HDBs also contain a significant share of compact mid-rise buildings (LCZ2), while private housing has a significant contribution from open low-rises2, due to the share of landed houses. The average AH flux under 20 W/m² indicates the residential sector has a small local contribution to heat intensity, but its wide spatial coverage across the island reveals that this sector still has significant contribution to the overall AH released in Singapore.
2 “Open low-rise” corresponds to buildings with average height from 3 to 8m, and a built fraction of 20% to 40% of
The analysis of commercial buildings indicates that most of its occurrences happen in the form of high and mid-rises, predominantly for retail and office usage. Local Climate Zones with lower heights and densities (LCZ6, 8 and 9) have a smaller but still significant contribution, with 13% of the overall heat released by this typology. A more detailed visual inspection reveal that those areas are located for business proposes, according to the Singapore’s Master Plan, and contains light industrial areas, such as in the vicinity of the Paya Lebar and Changi airports. The predominance of a high AH flux in the CBD, ranging mainly from 70 to 105 W/m², indicates that the commercial sector has a high local impact, since a large amount of energy consumption is concentrated in a small area. A significant amount of AH flux was also observed on university campuses, but with lower intensity given that they are more spacious and lower in average height than the typical business areas.
Although current analysis evaluates the commercial areas as the hotspots, further analysis is needed in order to evaluate the distribution of heat throughout the day to better compare commercial and residential sectors. With the hypothesis of higher activity in commercial buildings during the day and residentials during the night, the hotspots are likely to vary throughout the day. Furthermore, the forms of heat release in sensible and latent forms are important to better evaluate the climatic impact of the energy consumption from buildings. Those two limitations will be addressed in future stages, as we incorporate Building Energy Modelling under this current framework.
VALIDATION
The validation of overall Building Anthropogenic Heat (AH) released in Singapore is done by comparing modelled yearly AH per typology with the total electricity consumption reported for the base year of 2016 [4], also reported in [5]. For this analysis, we also consider the vacancy rates reported by each sub-sector, since the presented method is based on data from assumed fully occupied buildings. The yearly AH generated by the different typologies per LCZ, and the error in comparison to energy statistics is provided by Table 8:
Table 8 - Validation for aggregated energy
LCZ 1 2 3 4 5 6 8 9 Total AH
AH (TWh)
HDBs 0.24 0.48 0.05 2.47 1.15 0.11 0.06 0.01 4.57
Assuming negligible HDB vacancy (0%) [21] 4.57 Total Electricity consumption (2016) (TWh) [4] 4.5
Error (%) 1.3%
AH (TWh)
Priv. Hous. 0.28 0.33 0.13 1.56 0.62 0.16 0.04 0.05 3.17
Assuming private housing vacancy (7.7%) [22] [12] 2.93 Total Electricity consumption (2016) (TWh) [4] 3.1
Error (%) - 5.5%
AH (TWh)
Commercial 1.52 3.51 0.65 7.07 3.62 0.74 1.74 0.08 18.94
Assuming commercial vacancy (9.3%) [11] 17.18 Total Electricity consumption (2016) (TWh) [4] 17.7
Error (%) -2.9%
Total AH for all buildings (assuming vacancy of 9%) 24.68 Total Electricity consumption (2016) (TWh) [4] 25.3
Error (%) -2.4%
Due to the higher site area covered by open high-rises (LCZ4) and open mid-rises (LCZ5), as indicated by Table 7, they present the highest share of aggregated heat released in Singapore. We estimate that up to 62% of all the anthropogenic heat released by buildings in Singapore is released by these two types of urban morphology. From that, 65% is due to commercial (10.69 TWh/yr.) and 35% is due to residential (5.80 TWh/yr.). Other urban morphologies that contribute substantially to total AH in
Singapore, almost exclusively to commercial uses, are compact mid-rise (LCZ2), with 16% of total heat released; compact high-rise (LCZ1), with 8%; large low-rise (LCZ8), with 7%. A low error is observed for each typology ranging from -5.5% (private housing) to 1.3% (HDBs), and an absolute error lower than 0.5 TWh for all typologies. The low errors indicate that the model performs well both at the building level (Section 4.1.2) as well as in the city-scale, as observed in Table 8.
We compare our results to those of other competitive approaches for estimation of anthropogenic heat in buildings. We found other competitive approaches [13] [24] [25] to largely overpredict, possibly by more than 170%, the building anthropogenic heat and heat flux in Singapore once compared to aggregated energy statistics [4] [5]. The main limitation observed was that sites tend not to be distinguished according to their land use or building typology, which was revealed of high importance in the energy assessment (Section 5). Additionally, many industrial sites are regarded as a typical building (such as residential or commercial), which constrains the processes of validation and may compromise on the spatial distribution of AH. As such, we discarded these approaches from the discussion, yet they are presented and thoroughly analysed in Appendix II.
To our knowledge, this is the first work that focuses on building anthropogenic heat on a city scale based on a Local Climate Zone approach that additionally considers the significant energy differences caused by different building typologies (evaluated here as public and private housing, and commercial).
6 Conclusions
6.1 Summary of findings
In this work, we presented a framework for estimated the building anthropogenic heat and heat flux at the city scale, according to different building morphologies and typologies. Energy consumption data reported for public housing HDBs, private housing, and commercial buildings are used to characterize the mean Energy Use Intensity (EUI) of those typologies in different climate zones. This EUI is converted into Building Anthropogenic Heat Density (AH Density) and Anthropogenic Heat Flux (AH flux) and applied to maps that combine Local Climate Zone (LCZ) and Land Use (LU) information. Total yearly electricity consumption from buildings, reported by energy statistics, is used to validate the model and evaluate the model error. Additionally, we present a comparison with other competing, yet less precise methodologies in Appendix II.
In Part I, the analysis of EUI revealed a substantial difference between the building typologies, with commercial buildings having, in general, EUIs that are four to five times higher than the residentials.
Furthermore, amongst the residentials, private housing tends to be 40% to 50% more energy use intensive than public housing (HDBs), which indicates that those sub-groups should be analysed separately. It was also observed that the EUIs tend to remain nearly constant for different LCZs, which is expected given that the effect of different morphologies is not evident when normalizing the energy of buildings per gross floor areas.
In Part II, EUI is converted into Building Anthropogenic Heat Density, calculated using the Floor Area Ratio and normalized by site area, The AH Density is subsequentially converted into Anthropogenic Heat Flux (AH Flux), by assuming a constant energy flux throughout the year. In this analysis we can not only see differences in regard to building typology, but also the influence of building morphology.
Commercial buildings have a considerably higher AH flux. HDBs revealed an AH flux slightly higher than private housing. Although HDBs are in general less energy intensive than private housing, they are taller buildings and in higher density, reflected in a higher AH flux. When analysing the AH flux for different LCZs, we can see a clear pattern amongst the same typology, with more heat being released as density and average height increases.
In terms of anthropogenic heat flux (AH flux), the highest anthropogenic heat flux is generated in compact high-rise areas (LCZ1), with AH flux of commercial buildings (105 W/m²) being six to seven times higher than private residential (15 W/m² for private and 18 W/m² for public housing). The lowest intensity of anthropogenic heat flux is observed in sparsely built regions (LCZ9), with AH flux ranging from 2 W/m² (for residentials) to 7 W/m² (commercial). In Singapore, there is a predominance of open
mid-rises (LCZ5). In those regions, the average heat flux from commercial buildings is estimated to be six to seven times higher than private housing and eight to 11 times higher than public housing (HDB).
The spatial distribution of AH flux presents a clearer distinction between commercial and residential areas. Commercial areas are, as expected, the most heat intensive areas, with concentration of higher AH flux (70-110 W/m²) in business and retail areas such as the Central Business District (CBD), Orchard Road, and the Mapletree Business City, but also with a significant amount (40-90 W/m²) on university campuses. Although residential buildings have an AH flux one order of magnitude below than the commercial sector (2-20 W/m²), they are distributed in more than the triple of the land that is currently dedicated for commercial purposes, and therefore also relevant for total AH emitted in Singapore.
In terms of total anthropogenic heat (AH), LCZ4 and LCZ5 present the highest share of aggregated heat released in Singapore, due to their larger site area coverage. Up to 62% of the AH released from buildings in Singapore is observed in those urban morphologies. From that, 65% is due to commercial (10.69 TWh/yr.) and 35% is due to residential (5.80 TWh/yr.), also indicating how much more intensive the commercial sector is in Singapore.
This work presents a data-driven approach to evaluate building AH in a city-scale. Our method proposes the incorporation of Local Climate Zones combined with building Land Use, in order to better account for the heterogeneity revealed by buildings in a city in terms of operation and morphology (represented in this work by evaluating different typologies and LCZ, respectively). Such work provides an indication of the hotspots and preliminary quantitative insights about the spatial variation of anthropogenic heat in a city.
We consider that the work presented can be useful for both the research community and policy makers:
1. Building modellers have an overview of the building energy landscape in Singapore and reference values for the building and city scale, in a framework compatible with Building Energy Models (BEMs). Climate modellers can use the LCZ-LU as a sub-classification scheme, incorporating additional information about the urban typology. The LCZ-LU is also able to identify other (non-building) AH sources and potentially represent all AH in Singapore in a single map.
2. Policy makers have a clear visual representation of the energy landscape from buildings in Singapore, identifying the hotspots in the city and the biggest energy consumers. It also establishes the basis for the evaluation of “what-if scenarios”, such as changes in the Master Plan or assessing the potential impact of new developments.
6.2 Limitations
Below we highlight the main limitations observed in this work and additional considerations:
Part I - Data analysis and Building Profiles per Local Climate Zone (LCZ):
• Building energy consumption is based exclusively on electricity consumption. Oil and gas are not considered in the scope of this work. Since those energy sources represent less than 10%
of the energy consumed by buildings, we assume a minor effect over the city-wide energy consumption landscape. Additionally, due to the lack of data, this information cannot be used to derive with confidence the Energy Use Intensity (EUI) of those fuels at the building level.
• For several buildings, data is not voluntarily disclosed by the tenants or suppressed to avoid disclosure of individual data. This reduces the data available for specific typologies, especially private landed houses. Therefore, private housing has their EUI characterized mostly by private condominiums.
• The type of data reported at the building level does not allow a comparison between all building typologies, requiring external assumptions to derive EUI for residential buildings.
• For residential buildings, some months may be underreported and included in following months.
Additionally, some buildings have considerable energy increase for the first months, suggesting that these buildings have been recently occupied. Data was filtered to remove outliers and assure data quality for the study intended. Non-evident outliers are expected to have a negligible impact on the overall analysis, given the large dataset considered.
• The uncertainties in the LCZ map can reflect misclassification of certain buildings, which are used to classify average EUI per LCZ. We adopt an LCZ map with fine resolution and considerable accuracy to reduce such uncertainty. A possible small number of misclassified buildings does not impact the overall EUI, given the large dataset considered.
Part II - Scalability of anthropogenic heat to a city-scale:
• Both the Local Climate Zone (LCZ) and Land Use (LU) maps present uncertainties. The LCZ map might present misclassifications, while the LU map possibly contains non-developed areas or areas where the development in 2016 differs from the one established by the Master Plan 2014. By overlaying both maps we increase overall accuracy of city-scale classification, reducing the impact of those uncertainties.
• Distinct definitions and categories are presented amongst the data gathered, making the process of combining different data sources more challenging. Therefore, we try to find the most suitable assumptions based on professional expertise or complementary data in order that different sources are compatible.
• Floor Area Ratio (FAR) is a parameter of high uncertainty and not easily estimated. Therefore, we use several sources to assume different FAR per typology for each LCZ. The values were adjusted within reasonable range and manually calibrated so that the total GFA for each typology is followed.
• Hourly/seasonal variability of the anthropogenic heat rejected is not considered, given the lack of data for hourly consumption of electricity in the buildings’ reports, requiring major assumptions to derive this data. Therefore, we do not assume hourly profiles and instead analyse a homogeneous temporal distribution of anthropogenic heat flux from buildings. Such distribution has been applied before for studies of energy from buildings in Singapore [20]. A general overview based on profiles from other studies in Singapore [21] is provided in Appendix III. Future analysis should consider in more detail the temporal variations, as the daily variation is another key component in the analysis of heat emissions in a city scale.
• Building Anthropogenic Heat and Heat Flux is not distinguished between sensible and latent heat. Therefore, the translation of heat release into climate impact must be dealt with caution.
The two forms of heat release are dependent on the cooling technology applied and have significantly different impact on the climate.
6.3 Future Work
As an enhancement of the presented representation of the landscape of building anthropogenic heat emissions in Singapore, Building Energy Models (BEM) should be incorporated into the model. The incorporation of BEM into the model provides additional information at the following level:
• Hourly simulation for one year, presenting a more precise variation of heat fluxes during the day and for different seasons.
• Additional outputs, such as heat rejected by the air conditioning systems, can be evaluated using BEM. This information is not available in a data-driven approach for most cases but is valuable when considering different interpretations of building AH.
• BEM allows the evaluation of “what-if scenarios”, exploring energy impact in a city-scale.
7 References
[1] I. Stewart and T. Oke, “Local Climate Zones for Urban Temperature Studies,”
Bulletin of the American Meteorological Society, vol. 93, no. 12, pp. 1879-1900, 2012.
[2] D. J. Sailor, “A review of methods for estimating anthropogenic heat and moisture emissions in the urban environment,” Internation Journal of Climatology, vol. 31, pp. 189-199, 2011.
[3] Density Architecture, “Understanding Density,” DensityArchitecture, 18 January 2013. [Online]. Available:
https://densityarchitecture.wordpress.com/2013/01/18/understanding-density/.
[Accessed 17 July 2020].
[4] Energy Market Authority (EMA), “Singapore Energy Statistics,” Singapore Government, Singapore, 2018/2019.
[5] D. R. Kayanan, L. G. R. Santos, J. Ivanchev, J. A. Fonseca and L. Norford,
“Anthropogenic Heat Sources in Singapore,” Singapore-ETH Centre (SEC), Singapore, 2019.
[6] Building and Construction Authority (BCA), “Voluntary Disclosed Energy
Performance Data for Commercial Buildings,” Building and Construction Authority (BCA), 13 June 2016. [Online]. Available: https://storage.data.gov.sg/building- energy-performance-data/resources/listing-of-building-energy-performance-data- for-commercial-buildings-2016-2018-06-13T02-11-25Z.csv. [Accessed 13 June 2018].
[7] Energy Market Authority (EMA), “Average Monthly Household Electricity
Consumption by Postal Code (Public Housing) and Dwelling Type (kWh),” Energy Market Authority (EMA), [Online]. Available:
https://www.ema.gov.sg/Statistics.aspx. [Accessed 20 August 2019].
[8] Housing and Development Board (HDB), “HDB Property Information,” Singapore Open Data Licence, 6 July 2020. [Online]. Available:
https://data.gov.sg/dataset/hdb-property-information. [Accessed 14 July 2020].
[9] Energy Market Authority (EMA), “Average Monthly Household Electricity
Consumption by Postal Code (Private Apartments) (kWh),” Energy Market Authority (EMA), [Online]. Available: https://www.ema.gov.sg/Statistics.aspx. [Accessed 11 September 2019].
[10] Batchgeo, “Batchgeo,” Batchgeo, [Online]. Available: https://batchgeo.com/.
[Accessed 04 August 2020].
[11] Department of Statistics Singapore (Singstat), “Available And Vacant Commercial And Industrial Properties (End Of Period), Quarterly,” Urban Redevelopment Authority (URA), JTC Corporation, 2020. [Online]. Available:
https://www.singstat.gov.sg/. [Accessed 13 July 2020].
[12] Department of Statistics Singapore (Singstat), “Properties Under The Management Of Housing And Development Board (End Of Period), Annual,” Housing and Development Board (HDB), 2020. [Online]. Available: https://www.singstat.gov.sg/.
[Accessed 13 July 2020].
[13] M. O. Mughal, X. Li, T. Yin, A. Martilli, O. Brousse, M. A. Dissegna and L. K.
Norford, “High-resolution, multilayer modeling of Singapore's urban climate
incorporating local climate zones,” Journal of Geophysical Research: Atmospheres, vol. 124, p. 7764– 7785, 2019.
[14] Urban Redevelopment Authority (URA), “Master Plan 2014 Land Use,” Singapore Open Data Licence, 14 June 2017. [Online]. Available:
https://data.gov.sg/dataset/master-plan-2014-land-use. [Accessed 14 July 2020].
[15] Teoalida, “HDB statistics, facts & figures,” March 2019. [Online]. Available:
https://www.teoalida.com/singapore/hdbstatistics/. [Accessed 14 July 2020].
[16] X. Xu and B. Ang, “Analysing residential energy consumption using index decomposition analysis,” Applied Energy, vol. 113, p. 342–351, 2014.
[17] Urban Redevelopment Authority (URA), “URA Space,” 29 May 2020. [Online].
Available: https://www.ura.gov.sg/maps/. [Accessed 14 July 2020].
[18] Housing & Development Board (HDB), “Key Statistics - HDB Annual Report 2018/2019,” Housing & Development Board (HDB), Singapore, 2019.
[19] Urban Redevelopment Authority (URA), “The Planning Act - Master Plan Written Statement,” Singapore Government, Singapore, 2019.
[20] P. Boehme, M. Berger and T. Massier, “Estimating the building based energy consumption as an anthropogenic contribution to urban heat islands,” Sustainable Cities and Society, vol. 19, pp. 373-384, 2015.
[21] A. K. Quah and M. Roth, “Diurnal and weekly variation of anthropogenic heat emissions in a tropical city, Singapore.,” Atmospheric Environment, vol. 46, pp. 92- 103, 2012.
[22] P. Ho, “Falling residential vacancy rate – what does it mean?,” iCompareLoan, February 2017. [Online]. Available:
![Figure 3 - Electricity Consumption by Sector in 2018. Source: EMA, 2019 [4] (adapted)](https://thumb-eu.123doks.com/thumbv2/1library_info/4646136.1608045/12.892.181.720.285.625/figure-electricity-consumption-sector-source-ema-adapted.webp)
![Figure 4 - Sankey Diagram for Anthropogenic Sources in Singapore (ktoe) [5]](https://thumb-eu.123doks.com/thumbv2/1library_info/4646136.1608045/13.892.111.786.353.745/figure-sankey-diagram-anthropogenic-sources-singapore-ktoe.webp)

![Table 5 presents the sample EUI (from Table 4) per typology in comparison with the top-down calculated EUI, based on aggregated figures of energy [4] and property information [4] [11] [12]](https://thumb-eu.123doks.com/thumbv2/1library_info/4646136.1608045/21.892.158.737.381.550/presents-typology-comparison-calculated-aggregated-figures-property-information.webp)
