Transplantation of the microbiome from heat- tolerant to heat-sensitive corals – a new tool for
building coral resilience to bleaching?
Master’s Thesis in Biological Oceanography,
Faculty of Mathematics and Natural Sciences of Christian-Albrechts-Universität zu Kiel
submitted by
Talisa Döring
1112793
First examiner: Prof. Dr. Ute Hentschel Humeida,
GEOMAR Helmholtz Zentrum für Ozeanforschung Kiel Second examiner: Dr. Anna Roik,
GEOMAR Helmholtz Zentrum für Ozeanforschung Kiel
Kiel, March 2019
Outline
1. Abstract ... 1
2. Introduction ... 2
3. Methods ... 6
3.1 Study organism ... 6
3.2 Heat stress assay ... 7
3.2.1 Aquarium and treatment set-up ... 7
3.2.2 Quantification of coral fitness parameters ... 9
3.3 Microbiome transplantation experiment ... 10
3.3.1 Production of inoculation and control treatment ... 10
3.3.2 Aquarium and treatment set-up ... 11
3.3.3 Quantification of coral fitness parameters ... 13
3.3.4 DNA extraction and 16S rRNA gene sequencing ... 14
3.3.5 16S rRNA gene amplicon sequence processing ... 15
3.4 Statistical analyses ... 15
3.4.1 Coral fitness parameters ... 15
3.4.1.1 Bleaching score ... 15
3.4.1.2 Effective quantum yield (ΔF/Fm) ... 16
3.4.2 16S rRNA gene amplicon sequence data ... 17
4. Results ... 18
4.1 Heat stress assay ... 18
4.1.1 Bleaching score ... 18
4.1.2 Photosynthetic efficiency ... 20
4.2 Microbiome transplantation experiment ... 22
4.2.1 Bleaching score ... 22
4.2.2 Photosynthetic efficiency ... 25
4.2.3 Preliminary bacterial community analysis ... 28
4.2.4 First identification of potentially transplanted bacterial taxa ... 29
5. Discussion ... 31
5.1 Corals exposed to long-amplitude internal waves (LAIW) show a higher heat
tolerance ... 31
5.2 Tissue homogenate mitigates coral bleaching signs under acute short-term heat stress ... 33
5.3 Preliminary mining for potentially transplanted bacterial taxa ... 34
5.4 Lessons from the first coral microbiome transplantation experiment and outlook ... 36
5.5 Conclusion ... 37
6. References ... 39
7. Acknowledgements ... 44
8. Supplementary material ... 45
9. Declaration of authorship ... 47
1
1. Abstract
Tropical reef-building corals are acutely threatened by ocean warming which calls for active interventions that reduce further coral bleaching (i.e. the disruption of coral symbiosis with their unicellular photosymbionts) and subsequent coral mass mortality.
Manipulation of fast-evolving bacterial communities associated with the coral host (i.e.
the microbiome) might be one strategy to enhance coral resilience to bleaching. These communities are recognized as a vital part of the coral microbiome and can be important players in coral health and fitness, e.g. various bacterial functions could be beneficial for corals by potentially tuning the physiological response to heat stress. This study presents an experimental approach to develop a cost-effective method of coral microbiome transplantation aiming at building coral resilience to bleaching. Using a short-term heat stress assay, we identified heat-tolerant coral colonies of Pocillopora spp. that originate from a high variability habitat in the Thai Andaman Sea. Next, we used these corals as a source for bacterial microbiome consortia, which are supposed to promote bleaching resilience. Microbiome transplantation was conducted using a fresh tissue homogenate from these heat-tolerant corals and applying this inoculate on heat-sensitive conspecifics. Results indicate that recipient corals performed better under short-term acute heat stress compared to the control group. The bleaching response of inoculated corals was mitigated to a certain degree, but photosymbionts remained stressed within the holobiont. In a subsequent analysis of 16S rRNA amplicon data from this experiment we identified nine candidates of potentially transplanted bacterial taxa, comprising for instance the family Spongiibacteraceae which is known to be typically associated with coral holobionts. Additionally, two taxa were identified as Bdellovibrio, which are known Vibrio predators and might have played a role as pathogen antagonists preventing a Vibrio induced bleaching response in the experiment. These first results are preliminary and the role of potentially transplanted bacterial taxa in the mitigated stress response remains hypothetical and requires further studies.
2
2. Introduction
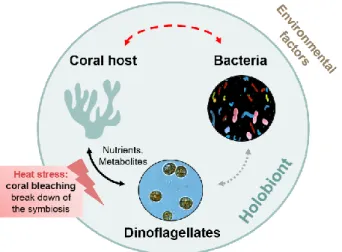
Many ecosystems around the world are already facing the consequences of global climate change, but possibly none as drastic as tropical coral reefs. This has demonstrated by the destructive force of recent global coral bleaching events (Hughes et al. 2018). Coral reefs are not only hotspots of biodiversity, they also provide fundamental ecosystem services to us humans, such as fisheries, coastal protection, and tourism (Moberg and Folke 1999). Rising ocean temperature and acidification are the major causes of the demise of this valuable and charismatic ecosystem (Hoegh- Guldberg 1998; Hughes et al. 2018). Tropical reef-building corals are affected by the slightest increases in temperature since they live near their thermal limits. Such temperature stress causes coral bleaching and mortality, which is mostly due to the breakdown of the obligate symbiosis between the coral animal and its photosynthetic dinoflagellate endosymbionts (Hoegh-Guldberg 1998). In general, reef-building corals host taxonomically and functionally diverse unicellular symbionts as part of their microbiome. Dinoflagellate photosymbionts of the family Symbiodiniaceae (LaJeunesse et al. 2018) which supply energy by processes like carbon fixation and translocation to the coral host (Muscatine and Porter 1977; Fig. 1) have been long known and are most important for the coral. In general, microorganisms on and within the tissues of many host organisms such as corals have been recognized as an integral part of the holobiont and can be of relevance for fitness (Lamberti et al. 2018). The unity of such holobiont associations, has established a new perspective on fitness and adaptation. Microbial roles in immunity, metabolic function (Thaiss et al. 2016), disease mitigation (Mao-Jones et al. 2010), and/or early development (Fraune & Bosch 2010) are known or hypothesized for various holobionts.
Current rates of ocean warming are too fast for reef-building corals to genetically adapt.
This is mainly due to their relatively long generation times of approximately four to eight years (Reusch 2014; Webster and Reusch 2017). In this context, a realistic possibility to preserve these valuable ecosystems for future generations may be the idea of assisted evolution, which aims to accelerate evolutionary processes to enhance coral stress resilience (van Oppen et al. 2015). Some approaches of assisted evolution target selective breeding of corals or experimental evolution of the photosymbionts in the laboratory (van Oppen et al. 2015). Another promising strategy focuses on the communities of coral-associated prokaryotic microorganisms (Fragoso Ados Santos et al. 2015; Damjanovic et al. 2017; Fig. 1). In contrast to their long-lived coral host
3
populations, these fast-evolving associated bacteria seem to be auspicious, since they are hypothesized to promote physiological adaption even within one generation of the coral holobiont (van Oppen et al. 2015). Manipulation of the fast-evolving communities of the coral microbiome might be one way to buy more time to prevent further loss of reef-building corals to bleaching events, while working on the overall goal of tackling climate change.
Reef-building corals are known to host a vast diversity of bacteria (Blackall et al. 2015). Due to the high complexity of the coral holobiont, comprising complex and dynamic bacterial communities, photosymbiotic dinoflagellates, viruses, and fungi side by side, bacterial contributions are not yet well understood (reviewed in Epstein et al. 2019; Blackall et al. 2015;
Fig. 1). Despite the growing body of studies investigating coral-associated bacterial microorganisms (in the following referred to as ‘coral microbiome’), their contribution and
interaction with the coral host still remains hypothetical (Bourne et al. 2016). However, metagenomic studies of bacterial functions in corals revealed capacities for nitrogen (Lesser et al. 2007) and carbon cycling (Neave et al. 2017), as well as degradation of aromatic compounds which could be beneficial for the host (Wegley et al. 2007;
Thurber et al. 2009). The coral probiotic hypothesis assumes that coral microbiome communities are shaped through a dynamic interaction between the host and the environment, leading to a beneficial community which results in ecological success (Reshef et al. 2006; Fig. 1). Such changes of microbiome composition are either related to ‘shuffling’, i.e. abundance shifts of bacterial taxa (and their gene products) or to ‘switching’, i.e. the introduction of new taxa (and their genes) to the holobiont (Webster and Reusch 2017). Indeed, first studies of coral microbiomes have demonstrated that changes in their composition occurred in response to different environmental pressures such as pollution or ocean warming (Webster et al. 2016;
Figure 1 The coral holobiont consists of the coral host, its symbiotic partners, photosymbiotic dinoflagellates and associated bacteria, forming a dynamic network of balanced interactions which is influenced by environmental factors such as heat stress. Among other functions, bacteria are suggested to be involved in tuning the physiological response to heat stress and could therefore prevent coral bleaching (the breakdown of the coral-dinoflagellate symbiosis).
4
Ziegler et al. 2016). Moreover, it has been shown that coral microbiome composition aligns with heat tolerance of the coral host, suggesting that specific members of the microbiome may be involved in tuning the physiological responses to heat stress (Gilbert et al. 2012; Ziegler et al. 2017). A microbial process that could be involved in helping the coral tolerate heat stress is, among others, antioxidant activity which counteracts reactive oxygen species (ROS). These compounds are produced under stress inside the host and photosymbiotic dinoflagellate cells and are suggested to trigger the bleaching response that entails photosymbiont loss (Tchernov et al. 2004;
Smith et al. 2005). Indeed, taxonomy-based functional profiling of corals exhibiting heat tolerance showed the enrichment of the protein ferredoxin NifW, a known scavenger of ROS (Ziegler et al. 2017). Consequently, the composition of the coral microbiome is likely to influence the trait of heat tolerance and the idea of bacterial community manipulation can be regarded as a potential and promising tool to enhance bleaching resilience in corals within the scope of assisted evolution.
There are two different approaches of microbiome manipulation (Mueller and Sachs 2015; Epstein et al. 2019). First, manipulative changes of the bacterial community can be achieved via direct selection, i.e. the identification of a specific beneficial microbe or microbial consortium based on bacterial functions and its introduction into the native microbiome of a host organism. Second, the approach of indirect selection requires the identification of a specific host phenotype which is supposed to carry microbiome functions of interest. This specific host and its indirectly selected microbiome serve as the source for beneficial taxa and consortia which can be introduced into other host organisms. Direct selection is being applied successfully in agriculture. It is of advantage because it targets specific beneficial bacterial functions and thus leads to more control over the applied manipulation (Epstein et al. 2019). For instance, the inoculation of rice plants, Oryza sativa, with a specific endophytic fungus increased the plants’ growth rates (Redman et al. 2011). Also, it also has been shown that a specific trait such as heat tolerance of a holobiont could be conferred by microbiome manipulation. For instance, it was possible to enhance heat tolerance of aphids by inoculation with the symbiotic bacterial strain Buchnera (Moran and Yun 2015). Since direct selection requires previous knowledge of specific microbial functions that can only be acquired via culturing and meta’omics methods, indirect selection might be a more cost-effective and time-efficient method (Epstein et al. 2019). Indirect selection of microbiome function has been successfully applied in human medicine, when
5
inflammatory bowel disease (IBD) was treated with fecal microbiome transplantation (Borody and Khoruts 2012; Gupta et al. 2016). Here, beneficial microbiome functions were sourced from healthy donors and IBD was treated by transplanting fecal matter from healthy donors to diseased recipients (Borody and Khoruts 2012; Gupta et al.
2016).
Based on successful applications in agriculture and medicine, Peixoto et al. (2017) proposed the concept of beneficial microorganisms for corals (BMC), suggesting to make use of beneficial microbes to enhance coral stress tolerance, and in particular bleaching resilience, and incorporating such approaches into coral reef restoration efforts. The concept of BMC aims at direct selection of beneficial coral microbes by isolating them and screening for beneficial traits. Identified BMC then need to be applied to corals and tested in controlled experiments under environmental stress conditions (Peixoto et al. 2017). To date, manipulation of the coral microbiome to enhance stress tolerance has been tested in preliminary studies (Fragoso Ados Santos et al. 2015; Rosado et al. 2018). Indeed, a first proof of concept study has demonstrated potential success of the BMC concept (Rosado et al. 2018). Bacterial isolates from Pocillopora damicornis were screened for antagonistic activity against the coral pathogen Vibrio coralliilyticus (Ben-Haim et al. 2003), ROS degrading enzymes, sulfur cycling (i.e. degradation of dimethyl sulfoniopropionate (DMSP)), and nitrogen cycling (Rosado et al. 2018). An inoculation with the selected BMC successfully reduced signs of bleaching in corals subsequently exposed to a heat and pathogen treatment. This study provided first confirmation that the coral microbiome can be manipulated to mitigate coral bleaching effects caused by a pathogen (Rosado et al. 2018). Usually, V. coralliilyticus has been shown to decrease coral health by triggering bleaching responses (Ben-haim et al. 2003).
The overall objective of this study is to test a new cost-effective method of coral microbiome manipulation based on the approach of indirect selection. This study tests a simple and affordable approach that will be likely to find application in coral reef restoration programs worldwide, including programs that do not receive sufficient financial funding. The approach intends to source microbiomes from heat tolerant coral phenotypes that likely promote bleaching resilience of their hosts. Compared to direct selection approaches, no prior investment on identifying bacterial function via microbiological cultivation methods and/or meta’omics is considered. Even though it has been proposed in assisted evolution objectives that selecting for a heat-tolerant
6
phenotype includes time-consuming multigenerational coral experiments using a selection pressure (i.e. increased temperature; van Oppen et al. 2015; Epstein et al.
2019), there are means to bypass ex situ cultivation. This study makes use of corals which had acquired a stress tolerant phenotype due to natural exposure to environmental selection pressures (i.e. in high variability environments) over multiple generations. These coral populations offer biological material of microbiomes that are potentially beneficial to corals under environmental stress.
Accordingly, this study utilizes a unique coral reef system in the Andaman Sea off the coast of Thailand.
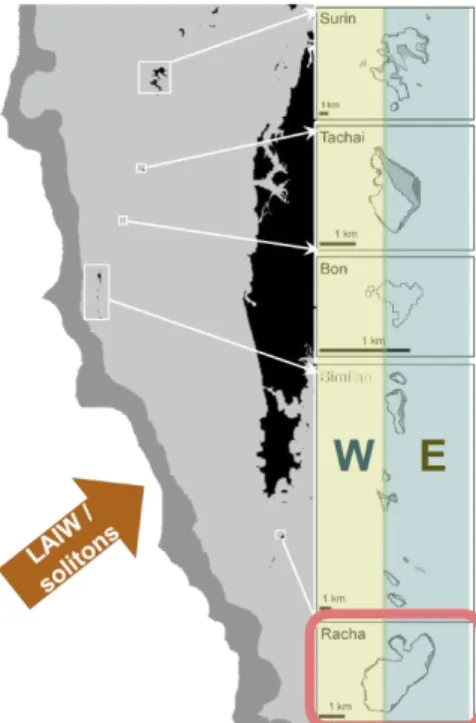
Coral populations on the west shore reefs of several islands in the Andaman Sea are exposed to large- amplitude internal waves (LAIW/solitons) that carry nutrient-rich and cold deep sea-water, causing strong fluctuations in temperature and nutrients (Leichter et al. 1996; Jantzen et al. 2012; Wall et al. 2012; Fig. 2).
It has been suggested in earlier studies that corals located on the exposed west shores of the islands exhibit higher heat tolerance than their conspecifics from the sheltered east shores (Buerger et al. 2015).
Following up on previous findings, this study aims to (1) identify heat-tolerant coral colonies in the Thai Andaman Sea by using a short-term heat stress assay and (2) test a microbiome transplantation procedure using fresh tissue homogenate for the transfer of bacteria from these heat-tolerant corals to their heat-sensitive conspecifics.
3. Methods
3.1 Study organism
The branching coral Pocillopora spp. was selected as a study organism because of its ecological importance as one of the most abundant reef builders in the entire Indo Pacific (Phongsuwan and Chansang 1992; Yeemin et al. 2009). P. spp. has been used in multiple experimental studies and genome data of Pocillopora damicornis has been
Figure 2 Island reefs in the Andaman Sea in Thailand are exposed to large- amplitude internal waves (LAIW/solitons) that carry deep water to the shallow reefs (up to 10 – 5 m) causing strong fluctuations in temperature and nutrient levels. This study used coral fragments from the east (E) a west (W) shore reefs of Racha Island (framed in red). (Adapted from © L Fillinger)
7
generated recently (Traylor-Knowles et al. 2018). For this study we selected the Pocillopora verrucosa species type by visual identification. In the Andaman Sea this type is particularly known to dominate reefs that receive increased wave exposure (Brown 2007).
3.2 Heat stress assay
3.2.1 Aquarium and treatment set-up
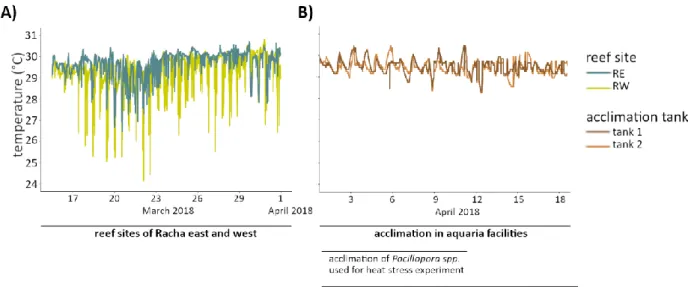
Short-term heat stress assays were conducted to compare the phenotypic and physiological responses of coral colonies originating from the east and west shores of Racha Island, in order to identify their relative heat tolerance. One month before the start of the experiment, temperature, a proxy for soliton impact, was monitored continuously using a temperature logger per reef site (HOBO Pendant Temperature/Light 8K Data Logger, Onset, USA; Fig 3A). Subsequently, colonies of Pocillopora spp. were sampled from the eastern (RE; N = 10; 15 m; 7.598910 N, 98.373100 E) and the western shore of Racha Island (RW; N = 9; 15 m; 7.595530 N, 98.354320 E) at the end of March 2018. Two coral fragments (5 cm) were collected per colony using a chisel and a hammer and were transported inside aerated seawater aquaria within 2 hours to the coral facilities at Phuket Marine Biological Center (PMBC, Cape Panwa, Phuket, Thailand). Each fragment was fixed with cable ties to a PVC ring (Ø 1 inch) and acclimated for 12 days in an aquarium to minimize sampling effects (Fig. 3 B). During the acclimation period, fragments were maintained in a 500 L flow- through tank with a flow rate of 3.6 L/min and water temperature of 29.4 ± 0.3 °C. To mimic light conditions of the sampling sites (Jantzen et al. 2012), LED lamps (135 W, Hydra Fiftytwo HD LED, Aqua Illumination, USA) created a 12/12 hour light/dark cycle with an average light intensity of 74.54 ± 5.46 μmol m-2 s-2. Tank conditions throughout the experiment were constant with 7.56 ± 0.03 mg/L in dissolved oxygen and a salinity of 32.6 ± 0.2 ppt.
8
Figure 3 A) Seawater temperature (°C) at the respective study sites Racha west (RW) and Racha east (RE) during March 2018. The colonies of Pocillopora spp. were exposed to 29.6 ± 0.6 °C at RE and to 29.3 ± 0.8 °C at RW. B) Seawater temperature (°C) per tank during the acclimation period of the collected Pocillopora spp. fragments in April 2018. Coral fragments for the heat stress assay were maintained at 29.4 ± 0.3 °C for 12 days and fragments used for the microbiome transplantation experiment for 24 days.
The heat stress assay was carried out from 11th until 13th March 2018. Two experimental tanks (40L, N = 4) were maintained inside a 500 L flow-through water bath, for temperature control. Water baths were connected to a 500 L source tank which was supplied with 5 μm-filtered seawater from the reef adjacent to PMBC. The source tank was held constant at 29.4 ± 0.3 °C using a chiller and a heater connected to a temperature controlling device (Titanium Heater 100 W, Schego, Germany;
Temperature Switch TS 125, HTRONIC, Germany; Aqua Medic Titan 1500 Chiller, Germany). Seawater of the experimental tanks was changed manually once a day using water from the source tank. Each experimental tank contained a heater connected to a temperature-controlling device, a temperature logger, air supply and one small current pump (Titanium Heater 100 W, Schego, Germany; Temperature Switch TS 125, HTRONIC, Germany; HOBO Pendant Temperature/Light 8K Data Logger, Onset, USA; Koralia nano 900 L/h, Hydor, Italy). Coral fragments were randomly distributed among the experiment tanks and treatments, resulting in one fragment from an individual colony per experimental tank. Overall, one experimental tank consisted of 9 to 10 coral fragments, respectively (5 from RE, 4-5 from RW).
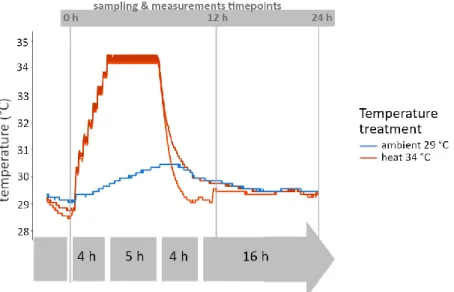
Duplicate heat treatment tanks were established. The heat treatment (34 °C) consisted of increasing temperatures from 29°C to 34°C over 4 h, held at 34 °C for 6 h and decreasing temperatures to 29 °C within 4 h which were then maintained for 16 h. The
9
duplicated ambient treatment (29°C) was held at a constant water temperature of 29
°C over the duration of the experiment for 24 h (Fig. 5).
Figure 4 Temperature profiles (°C) were measured in the two duplicated treatments, i.e. heat and ambient, over the duration of the heat stress assay. Measured average water temperatures were 30.8 ± 2.0 °C in the heat treatment and 29.7 ± 0.3 °C in the ambient treatment over the course of the experiment. Measurements associated with coral health (bleaching score and effective quantum yield) were taken at the beginning of the experiment at 0 h, after 12 h and after 24 h.
3.2.2 Quantification of coral fitness parameters
A bleaching score was recorded as a measure of bleaching state and photosymbiont density (Siebeck et al. 2006). Measurements were performed at three time points for each fragment, before (1) start of experiment at 0 h, (2) after 12 h, and (3) at the end of experiment at 24 h (Fig. 4). The bleaching score was visually categorized by one observer on a scale from 1 (completely bleached) to 6 (healthy) by using the ‘Coral Health Chart’ (Siebeck et al. 2006; Coral Watch, reefquest.org) (Fig. 5).
Figure 5 A) Levels of bleaching score were visually categorized by using the ‘Coral Health Chart’ (Coral Watch, reefquest.org). B) Phenotypic responses of Pocillopora spp. fragments subjected to the heat 34 °C treatment showing different levels of tissue condition. The fragment on the left can be visually categorized as 5 (healthy) and the fragment on the right as 1 (completely bleached).
10
The photosynthetic efficiency of the dinoflagellate photosymbionts was assessed as the effective quantum yield by using a pulse amplitude-modulated fluorometer (Diving- PAM, Walz, Germany). This parameter indicates the efficiency of the photosystem II (PSII) in ambient light adapted conditions (Ralph and Gademann 2005) and is estimated as follows: Φ PSII = (Fm’ – F) / Fm’ = ΔF / Fm’ (Genty et al. 1989).
Measurements of light adapted coral fragments were taken at the beginning of the experiment at 0 h, after 12 h and at the end of the experiment at 24 h (Fig. 4). To guarantee reproducibility between measurements, a spacer (transparent hose) kept a constant distance of 8 mm between coral fragment surface and the fiberoptics of the PAM. The main PAM settings were Measuring Light Intensity (MI) = 5 and Gain (G) = 3.
3.3 Microbiome transplantation experiment
3.3.1 Production of inoculation and control treatment
Two coral fragments were collected from three Pocillopora spp. colonies (N = 3) at 15 m in RW at the end of March 2018. These donor fragments were acclimatized for 24 days under the same conditions as described in 3.2.1 (Fig. 3 B). Subsequently, they were used to produce the coral tissue homogenate for the inoculation treatment at the start of the microbiome transplantation experiment, which was carried out from 22nd until 25th April 2018. To transplant members of the microbiome from RW to RE corals, an inoculation method which has been previously used to transmit coral disease from Gignoux-Wolfsohn (2012) was adopted. A homogenate of fresh coral tissue was produced by placing each donor fragment into one sterile 50 mL falcon tube with 15 mL of 0.2 μm filtered sea water and sterile glass beads (ø 2.7 mm; Gignoux-Wolfsohn et al. 2012, 2017) . Each falcon tube was vortexed (neoLab Vortex Genie 2, Germany) for one minute until no tissue remained on the skeleton (Kline & Vollmer, 2011). After removing the glass beads and the skeleton fragments, the coral tissue homogenates were merged into one pool of donor inoculate for the experiment, which was then distributed among ten 15 mL falcon tubes by adding 8 mL of the inoculate into each one. Triplicate samples of 2 mL of the inoculate were shock frozen for DNA extraction.
The same procedure was carried out for the production of the control inoculate, i.e.
vortexing six 50 mL sterile falcon tubes for one minute, each filled with 15 mL 0.2 μL filtered sea water (FSW) and sterile glass beads, without adding donor fragments. The
11
control inoculate was also mixed and ten 15 mL sterile falcon tubes were filled with respectively 8 mL.
3.3.2 Aquarium and treatment set-up
Four fragments (5 cm) each from five visually healthy colonies of Pocillopora spp. were collected from RE at a depth of 15 m at the end of March 2018. These recipient fragments (N = 5) were brought to the aquaria facilities at PMBC and were kept for 24 days in 500 L flow-through tanks under conditions as described in 3.2.1 (Fig. 3 B). The microbiome transplantation experiment consisted of two parts: (1) the inoculation experiment was conducted during the first 24 h and was followed by (2) a heat stress assay ending after another 24 h, resulting in a total of 48 h (Fig. 6). The microbiome transplantation experiment was carried out from 23rd until 25th March 2018. During both parts of the experiment, two 40 L experimental tanks were placed in 500 L flow-through water baths, respectively, to maintain water temperatures. The water baths were connected to a 500 L source tank which was supplied with 5 μm-filtered seawater from the reef adjacent to PMBC. The source tank was held constant at 29.4 ± 0.3 °C using a chiller and a heater connected to a temperature-controlling device (Titanium Heater 100 W, Schego, Germany; Temperature Switch TS 125, HTRONIC, Germany; Aqua Medic Titan 1500 Chiller, Germany). Each experimental tank contained a heater connected to a temperature controlling device, a temperature logger, air supply and one small current pump (Titanium Heater 100 W, Schego, Germany; Temperature Switch TS 125, HTRONIC, Germany; HOBO Pendant Temperature/Light 8K Data Logger, Onset, USA; Koralia nano 900 L/h, Hydor, Italy). At the start of the microbiome transplantation experiment, five coral RE fragments (one fragment from each colony) were distributed among all of the four experimental aquaria.
During the inoculation experiment two tanks per treatment (inoculation (I) and control treatment (C)) were established while seawater temperatures were constant at ambient 29 °C (Fig. 6). At the beginning, current pumps and aeration were interrupted and the seawater volume in all four experimental tanks was reduced to 8 L (to a water level of 6 cm). Subsequently, PVC tubes (7 cm height, 8 cm diameter, volume of 350 ml) were placed around each coral fragment to create a semi-enclosed microenvironment (Fuess et al. 2017). The treatment was carried out by adding either 8 ml of the donor inoculate or the control inoculate (0.2 μl as described in 3.3.1) into the PVC tubes, respectively. The volume proportion of the inoculates added was 2.3
12
% of the volume of each PVC tube. Coral fragments were incubated inside the tubes for 30 minutes, providing an opportunity for uptake of bacteria. Afterwards, all PVC tubes were removed, flow and aeration was switched on, and water volumes inside experimental tanks were increased to 40 L by adding water from the source tank. The volume proportion of the inoculates was diluted to 0.1 % of the total volume of the experimental tank for the next 24 h. Tissue samples (one from each fragment at each time point) were collected before at 0 h and after the inoculation experiment at 24 h (Fig. 5). All samples for DNA extraction were collected using sterile clippers (1 - 2 cm of each fragment). Samples were rinsed with 0.2 μL FSW, wrapped in multiple sheets of sterile aluminum foil, crushed with a hammer, filled into a sterile 2 mL vial, and flash frozen in liquid nitrogen. Moreover, seawater samples (1 L) were taken from each of the experimental tanks at 0 h and 24 h of the inoculation experiment (Fig. 6). Seawater samples were vacuum-filtered over a 0.22 μl filter (Durapore PVDF filter membranes, Merck, Germany). Filters were immediately stored in a 2 mL cyro vial and flash frozen.
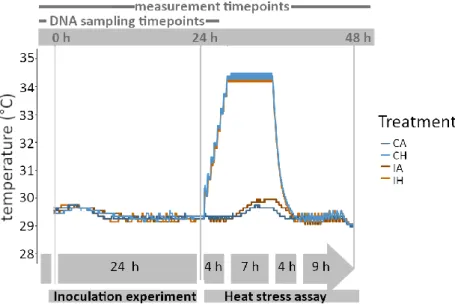
Figure 6 Temperature profiles (°C) measured over the course of the microbiome transplantation experiment. The experiment consisted of two parts: (1) the inoculation experiment, conducted during the first 24 h and (2) the heat stress assay, carried out until 48 h of the experiment. Coral and seawater samples (DNA samples) were taken at 0 h and 24 h, while fitness measurements (bleaching score and effective quantum yield) were taken at 0 h, 24 h and 48 h. Each line represents one treatment tank (Inoculation 29 °C (IA), Inoculation 34 °C (IH), Control 29 °C (CA) and Control 34 °C (CH)).
13
Table 1 Experimental design and treatment groups of the inociulation experiment which was part of the microbiome transplantation experiment.
Experiment timepoint of sampling
Treatment DNA sample type
DNA sample code Coral sample name
Inoculation experiment
0 h None Fresh tissue
homogenate
Tissue inoculate Donor inoculate
0 h None Coral preI Recipient coral fragments before
inoculation
24 h Inoculation Coral I_postI Recipient coral fragments after inoculation
24 h Control Coral C_postI Control recipient coral fragments
after inoculation
Before starting the second experiment part, a 50 % water change was conducted resulting in a further dilution of the inoculate (0.05 %) in the experimental tanks used during the first part. The heat stress assay consisted of the tanks IA, IH, CA, and CH, representing all treatment combinations of inoculation (I) or control (C) and ambient (A) or heat (H) temperature (Table 2; Fig. 6). By this means, the heat stress assay aimed at comparing the fitness responses of inoculated versus control coral fragments under heat stress. Both heat and ambient treatments were conducted following the same protocol as in chapter 3.2.1. The heat treatment (34 °C) included an increase from 29°C to 34°C over 4 h, constant 34 °C for 7 h and a decrease to 29 °C within 4 h which was then maintained for 9 h.
Table 2 Overview of treatment group formation and names of the heat stress assay as part of the microbiome transplantation experiment.
Experiment Inoculation experiment 0 h – 24 h
Heat stress assay 24 h – 48 h
Treatment group name
Heat stress assay
Inoculation Heat 34 °C Inoculation 34 °C = IH
Inoculation Ambient 29 °C Inoculation 29 °C = IA
Control Heat 34 °C Control 34 °C = CH
Control Ambient 29 °C Control 29 °C = CA
3.3.3 Quantification of coral fitness parameters
Coral fitness responses were assessed as described in chapter 3.2.2. Bleaching score and the effective quantum yield were recorded at three timepoints (1) before experiment start at 0 h, (2), at the end of the inoculation experiment at 24 h, and (3) at the end of the heat stress assay at 48 h (Fig. 6).
14
3.3.4 DNA extraction and 16S rRNA gene sequencing
All coral tissue samples were stored at -80 °C until DNA extraction using a modified protocol for the Qiagen Allprep DNA/RNA extraction kit. In the lab, samples were transferred into lysis tubes (2 mL Lysing Matrix E, MP Biomedicals, USA) filled with 800 μl RLT lysis buffer (Buffer RLT, Qiagen AllPrep Kit, Germany) and disrupted in a bead mill (2 x 1 min 30 Hz, Qiagen TissueLyser II, Germany). 400 μL of the sample was transferred to a 1.5 mL vial and centrifuged at 15,000 rcf for 3 minutes. The supernatant was processed following the manufacturer’s protocol using DNA columns included in the kit (Qiagen AllPrep Kit, Germany). To promote cell lysis of seawater samples, frozen membrane filters were thawed for 5 min and frozen again at -20 °C for 5 min, repeating the cycle 3 times. Subsequently, filters were cut into half using sterile scalpels. One half was further sliced into stripes, transferred into a lysis tube (2 mL Lysing Matrix E, MP Biomedicals, USA) filled with 800 μl RLT lysis buffer (Buffer RLT, Qiagen AllPrep Kit, Germany), and further processed in parallel with the coral samples. A blank control sample was added at every second DNA extraction session.
DNA was eluted from the columns using 50 μL 10 mM Tris-HCl (Buffer EB, Qiagen AllPrep Kit, Germany). DNA concentrations were measured using a NanoDrop spectrophotometer (Thermo Fisher Scientific, USA).
The bacterial 16S rRNA gene was amplified in a one-step PCR approach (Hoellen et al. 2018). Primer constructs targeting the V5/V6 hypervariable region contained the 784F [5'AGGATTAGATACCCTGGTA ’3] and 1061R [5'CRRCACGAGCTGACGAC'3]
sequences (Nam et al. 2011) unique barcodes (Kozich et al. 2013), heterogeneity spacers, and linker sequences for paired end sequencing on the lllumina® MiSeq sequencer. In order to conduct PCR amplification of the bacterial 16S rRNA gene, we used approximately 10 - 30 ng of coral DNA and 5 - 15 ng DNA from seawater samples. PCR reactions were performed using 10 μL Phusion® High-Fidelity PCR Master Mix with HF Buffer (New England Biolabs, USA) and a final concentration of 0.5 µM for each primer in a total reaction volume of 20 μL. The amplification cycling temperatures consisted of one cycle at 98°C for 30 s, 30 cycles each at 98°C for 10 sec, 52°C for 30 sec, and 72°C for 30 sec, followed by a final extension step at 72°C for 5 min. Negative controls were included to verify reagents were uncontaminated (DNA extraction blanks and PCR blanks). A mock community was used as a positive control (#ZRC 190811, ZymoBIOMICS Microbial Community DNA, Zymo Reseach).
15
Amplicons were quantified via 2% agarose gel electrophoresis. Concentration of each sample was determined using the Quick-Load® Purple 100 bp DNA Ladder (New England Biolabs, USA) and Image Lab™ 6.0.1 (Software Life Science Research, Bio- Rad). Equimolar amounts of 18 - 24 samples were pooled into subpools, which subsequently were purified from an 1% agarose gel using the MinElute Gel Extraction Kit (Qiagen). After the quantification of the purified subpools by Qubit, equimolar amounts were pooled into one final pool that was stored at -20°C until sequencing.
Sequencing was performed on a MiSeq sequencer (Illumina®) at the Norwegian Sequencing Centre (www.sequencing.uio.no, Oslo, Norway) using the MiSeq Reagent Kit v3 and 10% PhiX.
3.3.5 16S rRNA gene amplicon sequence processing
MOTHUR software (http://mothur.org/, version 1.39.5; Schloss 2009, 2011) was used for amplicon analysis. Raw sequences were split according to barcodes and assembled into contigs. Singletons (n = 1 over all samples) and rare sequences (n <
10 over all samples) were removed both by using the command remove.rare(). Unique sequence reads were merged using unique.seqs() and aligned against the SILVA
alignment database (release n. 132; Quast 2013). Sequences that did not cover the hypervariable region V5/6 were removed (SILVA alignment position 23440 to 344151;
Quast 2013). Moreover, sequences were pre-clustered (2 bp difference; Schloss 2011) and chimeric sequences were identified using chimera.vsearch() and removed using remove.seqs(). To classify the sequences, the classify.seqs() function in MOTHUR was used against the SILVA RNA gene database (80% bootstrap; release n. 132; Quast 2013). Afterwards non-targeted sequences (e.g. chloroplasts, mitochondria, archaea, eukaryotes, and unknown) were removed. To obtain operational taxonomic units (OTUs), the sequences were clustered at the 0.03 difference level. Data was normalized by subsampling to 4423 sequences per sample.
3.4 Statistical analyses
3.4.1 Coral fitness parameters
3.4.1.1 Bleaching score
Visualization and analyses of coral fitness were conducted in the statistical environment R (R Development Core Team, 2011, Version 3.2.2). First, proportions of the bleaching score counts were visualized in stack bar plots using the ggplot2 library.
16
Data were grouped per treatment and time point. Next, we analysd the changes in bleaching score over time. Δ-bleaching score was calculated for each experiment and fragment by subtracting the final score from the initial score (Table 3). In order to test the one-tailed hypotheses for each experiment and experimental part (Table 3), a randomization test of 10,000 bootstraps was conducted. We applied a for (i in 1:10000){} loop in R on the mean difference (Δ-mean) between the respective treatments for either site (RW and RE) or inoculation treatment (I and C; Table 3). The resulting 10,000 Δ-means were plotted per site or inoculation treatment and a P-value was calculated each by dividing the proportion of values smaller than the true Δ-mean by the number of bootstraps.
Table 3 Calculation of Δ-bleaching score and Δ-mean, and hypothesis of the conducted randomization test per experiment and experimental part.
Experiment Experiment al part
Calculation of Δ-bleaching score
Calculation of Δ-mean
Hypothesis of randomization test
Heat stress assay Δ-bleaching score = bleaching score at 24 h – bleaching score at 0 h
Δ-mean (RE or RW) = mean Δ-bleaching score heat – mean Δ-bleaching score ambient
RW Δ-bleaching score heat = RW Δ-bleaching score ambient
and
RE Δ-bleaching score heat >
RE Δ-bleaching score ambient
Microbiome transplantation experiment
Inoculation experiment
Δ-bleaching score = bleaching score at 24 h – bleaching score at 0 h
Δ-mean =
mean Δ-bleaching score inoculation – mean Δ-bleaching score control
Δ-bleaching score inoculation = Δ-bleaching score control
Heat stress assay
Δ-bleaching score = bleaching score at 48 h – bleaching score at 24 h
Δ-mean (C or I) =
mean Δ-bleaching score heat – mean Δ-bleaching score ambient
I Δ-bleaching score heat = I Δ-bleaching score ambient
and
C Δ-bleaching score heat >
C Δ -bleaching score ambient
3.4.1.2 Effective quantum yield (ΔF/Fm)
Raw data of the photosynthetic efficiency measured as effective quantum yield (ΔF/Fm) were plotted per treatment over the time points. To quantify the changes of effective quantum yield (ΔF/Fm) over time, Δ-effective quantum yield was calculated respectively (Table 4).
Table 4 Calculation of Δ-effective quantum yield per experiment and experimental part.
Experiment Experimental part Calculation of Δ-effective quantum yield
Heat stress assay Δ-effective quantum yield = yield at 24 h – yield at 0 h Microbiome transplantation
experiment
Inoculation experiment Δ-effective quantum yield = yield at 24 h – yield at 0 h Heat stress assay Δ-effective quantum yield = yield at 48 h – yield at 24 h
17
Differences of all Δ-effective quantum yield data were analysed using mixed effect models (LMEs, model with multiple random factors, R package nlme), where data met assumptions of normality (Shapiro-Wilk test). Otherwise, generalized linear mixed effect models were applied (GLMMs, glmer function, R package lme4). Models tested for the effect of island site (RE and RW), heat stress treatment (heat and ambient), and the interaction effect (site x heat stress treatment). The first part of the microbiome transplantation experiment data was tested by LME for the effect of the inoculation treatments (C and I) included as a fixed factor. In the second part of the experiment, GLMMs tested for the effect of the inoculation treatment (C and I), the heat stress treatment (29 °C and 34 °C), and the interaction effect (inoculation treatment x heat treatment). All GLMMs and LMMs were fitted by using the tank as a random factor. P- values for normally distributed data were reported by performing an ANOVA of the respective model. In the other cases P-values were reported by using Wald Statistics.
Tukey multiple pairwise comparison post-hoc tests followed on the fitted models (LMEs and GLMMs) using the lsmeans function adjusted to tukey from the R package lsmeans.
3.4.2 16S rRNA gene amplicon sequence data
All analyses were performed using a dataset subsampled to 4423 sequences per sample as implemented in the R environment (Version 3.2.2, R Development Core Team, 2011) and MOTHUR (http://mothur.org/, version 1.39.5; Schloss 2009, 2011).
Species richness (Chao 1 index was corrected for sample size) and species diversity (Shannon Index) were estimated with the summary.single() function (MOTHUR). These α-diversity indices were analysed each by comparing sample groups fitted as fixed factors using generalized linear mixed effect models (GLMMs, glmer function, R package lme4). Subsequent Tukey multiple pairwise comparison post-hoc tests on the fitted models were conducted by using the lsmeans function (R package lsmeans).
OTU abundance data was visualized using analysis of principal coordinates (PCoA).The Jaccard index dissimilarity matrix of presence absence data was generated (MOTHUR pcoa function) and plotted (pcoa function, R package ape, Fig.
S2). Statistical differences in community structure between treatment groups were tested by analysis of similarity (ANOSIM; 9,999 permutations, package vegan). Venn diagrams and shared OTU tables were generated (venn function in MOTHUR) which provide unique, shared, and ubiquitous OTUs across samples grouped by treatments.
18
OTUs that are only shared between donor and recipient samples represent taxa potentially transplanted bacteria from the donor to the recipient coral fragments.
Representative sequences (MOTHUR, get.OTUrep) of these first candidate OTUs were aligned in GenBank (NBCI National Center of Biotechnology Information) using BLASTn (Basic Local Alignment Search Tool; Altschul et al. 1990).
4. Results
4.1 Heat stress assay
4.1.1 Bleaching score
Results show that bleaching intensity of coral fragments from Racha East (RE) was significantly higher than of fragments from Racha West (RW) under the same acute short-term heat stress. Stack bar plots demonstrated a strong increase of the
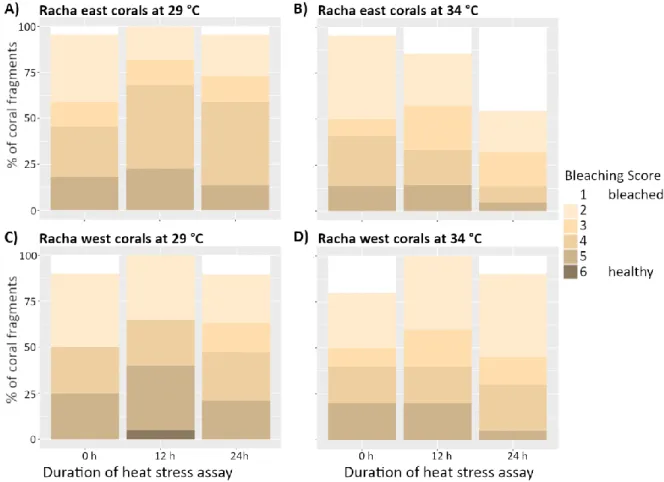
“completely bleached” phenotype category in the heat treatment among RE fragments (resulting in 45 % of bleaching score 1 fragments at 24 h, Fig. 7 A and B). In contrast, frequencies of the bleaching score categories of RW fragments did not change significantly over time in neither treatment (Fig. 7 C and D).
19
Figure 7 Bleaching score over the duration of the heat stress assay (heat = 34 °C, ambient = 29 °C) comparing the response between coral Pocillopora spp. fragments from Racha west (RW) and east (RE). The bleaching score was recorded at the beginning at 0 h, after 12 h and at the end of the experiment after 24 h by categorizing fragments on a scale from 1 (completely bleached) to 6 (healthy).
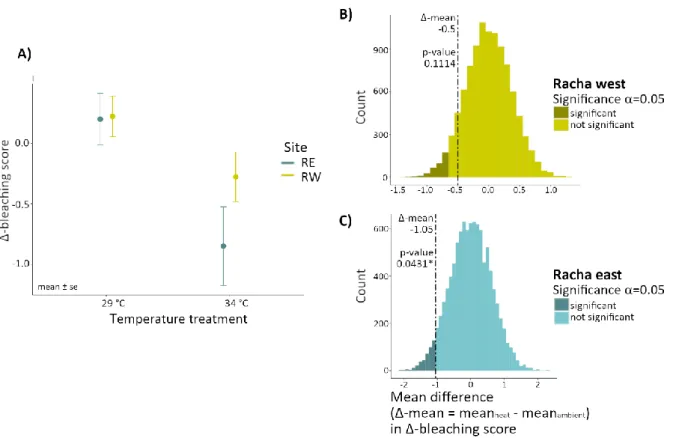
A certain decrease in Δ-bleaching scores can be observed for all coral fragments from both reef sites, RE and RW, exposed to heat (Fig. 7 B and D). However, the decrease of the Δ-bleaching score for RW fragments was minor and not significant in the bootstrap randomization test, which shows no significant difference between the temperature treatments (p = 0.1114, Fig. 8 B). The decrease of Δ-bleaching score in RE corals was larger and significantly different in the bootstrap randomization test (p
= 0.0431, Fig. 8 C).
20
Figure 8 Δ-bleaching score (change of bleaching score over time) from the heat stress assay comparing responses between corals from Racha west (RW) and east (RE). (A) Means of Δ-bleaching score of Pocillopora spp. fragments grouped by heat stress treatment (heat = 34 °C, ambient = 29 °C) and site RE or RW. The bleaching score was recorded by categorizing fragments on a scale from 1 (completely bleached) to 6 (healthy). Points depict means ± standard error (se). (B & C) A randomization test (10,000 bootstraps) was performed for the mean difference in Δ- bleaching score between the temperature treatments (ambient and heat) for each RW and RE corals (Δ-mean (RE or RW) = mean Δ-bleaching score heat – mean Δ-bleaching score ambient). Given an alpha of 0.05, P-values were calculated as values smaller than the true Δ-mean (dashed line) divided by 10,000 bootstraps.
4.1.2 Photosynthetic efficiency
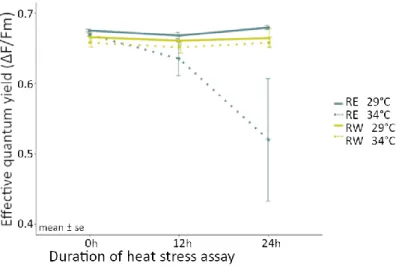
Coral fragments from RW displayed a significantly higher photosynthetic performance compared to their conspecifics from RE after the heat treatment. Coral fragments from RE showed a strong decrease in effective quantum yield (ΔF/Fm) over the course of the heat treatment, dropping from 0.669 ± 0.001 at 0 h to 0.521 ± 0.08 at 24 h (Fig. 9).
In contrast, fragments from RW were able to maintain similar levels than the fragments from the ambient treatments (0.658 ± 0.006 at 0 h and 0.657 ± 0.007 at 24 h, Fig. 9).
Additionally, all fragments maintained stable ΔF/Fm rates in ambient conditions of over the course of the experiment (RE: 0.675 ± 0.001 at 0 h and 0.679 ± 0.003 at 24 h , RW:
0.665 ± 0.007 at 0h and 0.664 ± 0.01 at 24 h; Fig. 9).
21
Figure 9 Photosynthetic efficiency Φ PSII as effective quantum yield (ΔF/Fm) over the duration of the heat sress assay (treatment of either ambient = 29°C or heat = 34°C) of Pocillopora sp. fragments from Racha east (RE) and Racha west (RW). Points depict means ± standard error (se).
A significant interaction was identified for Δ-effective quantum yield between the site and the treatment (t = -3.824, p = 0.000131, Table 5), but not for site only (t = 1.141, p
= 0.254, Table 5). A post-hoc test highlighted a significant difference in Δ-effective quantum yield between temperature treatments in RE fragments (z = -5.991, p <
0.0001, Table 6, Fig. 10), whereas Δ-effective quantum yield was not significantly different in RW corals (z = -0.412, p = 0.976, Table 6, Fig. 10).
Figure 10 Δ-effective quantum yield of Pocillopora spp. per temperature treatment (ambient = 29 °C and heat = 34
°C) per site Racha east (RE) and west (RW). The change of effective quantum yield over the course of the experiment (Δ-effective quantum yield) was calculated by subtracting the final value at 24 h from the initial value at 0 h. Points depict means ± standard error (se).
22
Table 5 Generalized linear mixed effect model for photosynthetic efficiency Φ PSII as Δ-effective quantum yield of Pocillopora spp. fragments from Racha east and west of the heat stress assay. Std. Error indicates standard error.
Significant terms are highlighted in bold.
Response variable
Fixed effects Estimate Std. Error t value Pr(>|z|)
Δ-effective quantum yield
(Intercept) -4.779 0.341 -14.022 < 0.001 ***
Site 0.564 0.495 1.141 0.254
Heat stress treatment 2.888 0.482 5.991 < 0.001 ***
Site x heat stress treatment -2.679 0.701 -3.824 < 0.001 ***
Table 6 Tukey multiple pairwise post-hoc test for fitted generalized linear mixed effect model for photosynthetic efficiency Φ PSII as Δ-effective quantum yield of Pocillopora spp. fragments. Std. Error indicates standard error.
Significant terms are highlighted in bold.
Response variable
Contrasts Estimate Std. Error z ratio p value
Δ-effective quantum yield
RE ambient - RW ambient -0.565 0,495 -1,1410 0.664
RE ambient - RE heat -2.888 0.482 -5,9910 < 0.001 ***
RE ambient - RW heat -0.774 0.495 -1,5640 0.399
RW ambient - RE heat -2.323 0.495 -4,6910 < 0.001 ***
RW ambient - RW heat -0.209 0.508 -0,4120 0.976
RE heat - RW heat 2.114 0.495 4,2680 < 0.001 ***
4.2 Microbiome transplantation experiment
4.2.1 Bleaching score
Bleaching scores were measured to assess the change in photosymbiont density of coral fragments during the inoculation experiment. Overall, bleaching scores in the inoculation and control treatment remained similar between 0 h and 24 h (Fig. 11). The inoculation treatment had no effect on the Δ-bleaching score (p = 0.5438, Fig. 12).
23
Figure 11 Bleaching scores of Pocillopora spp. fragments during the microbiome transplantation experiment. The bleaching score was recorded at the beginning at 0 h, after 24 h and at the end of the experiment after 48 h by categorizing coral fragments on a scale from 1 (bleached) to 6 (healthy). The inoculation experiment was carried out within the first 24 h and was followed by the heat stress assay until 48 h.
24
Figure 12 Δ-bleaching score (i.e. the change in bleaching score over time) from the inoculation experiment within the first 24 h of the microbiome transplantation experiment. (A) Means of Δ-bleaching score of Pocillopora spp.
fragments grouped by treatment (inoculation and control). The bleaching score was recorded by categorizing fragments on a scale from 1 (completely bleached) to 6 (healthy). Points depict means ± standard error (se). (B) A randomization test (10,000 bootstraps) was performed for the mean difference in Δ-bleaching score between the treatments (Δ-mean inoculation treatment = mean Δ-bleaching score inoculation – mean Δ-bleaching score control). Given an alpha of 0.05, P-values were calculated as values smaller than the true Δ-mean (dashed line) divided by 10,000 bootstraps.
The subsequent heat stress assay (from 24 h to 48 h of the experiment) aimed at comparing stress responses of previously inoculated coral fragments (I) and the control group (C) subjected to a heat (H) and ambient (A) temperature treatments (resulting in four sample groups IA, IH, CA and CH). Results show that CH fragments were the only sample group displaying a significant decrease in bleaching score (Fig. 13 A).
Importantly, signs of stress can be observed for both, CH as well as IH treated fragments, with a certain decrease in Δ-bleaching observed in both groups (Fig. 13 A).
However, this decrease was only significant for CH fragments since they differed significantly in Δ-bleaching score from CA fragments (p = 0.0026, Fig. 13 C). In contrast, the groups IA and CA showed no change in bleaching score over the course of the experiment (Fig. 13 B).
25
Figure 13 Δ-bleaching score (i.e. the change in bleaching score over time) from the heat stress assay within the second 24 h of the microbiome transplantation experiment. (A) Means of Δ-bleaching score of Pocillopora spp.
fragments were grouped by inoculation treatment (inoculate and control) and temperature treatments (heat = 34 °C and ambient = 29 °C). The bleaching score was recorded by categorizing fragments on a scale from 1 (completely bleached) to 6 (healthy). Points depict means ± standard error (se). (B & C) A randomization test (10,000 bootstraps) was performed for the mean difference in Δ-bleaching score between the temperature treatments (ambient and heat) for each coral fragments treated with the inoculation or the control (Δ-mean (I or C) = mean Δ-bleaching score
heat – mean Δ-bleaching score ambient). Given an alpha of 0.05, P-values were calculated as values smaller than the true Δ-mean (dashed line) divided by 10,000 bootstraps.
4.2.2 Photosynthetic efficiency
We did not observe any apparent changes over time in ΔF/Fm values visible between inoculation and control treatments during the inoculation experiment (inoculate: 0.672
± 0.004 at 0 h and 0.664 ± 0.004 at 12 h, control: -0.01 ± 0.004; Fig. 14). Moreover, there was no significant effect of the inoculation and control treatment on Δ-effective quantum yield (p = 0.5368, Table 7, Fig. 15).
26
Figure 14 Photosynthetic efficiency Φ PSII as effective quantum yield (ΔF/Fm) of Pocillopora spp. over the duration of the experiment. The inoculation experiment (inoculation and control treatment) was carried out within the first 24 h, following by the heat stress assay (heat = 34 °C and ambient = 29 °C) until 48 h. Points depict means ± standard error (se).
Figure 15 Δ-effective quantum yield of Pocillopora spp. fragments from the inoculation experiment as part of the microbiome transplantation experiment. Fragments were exposed to either inoculation or control treatment within the first 24 h of the microbiome transplantation experiment. Δ-effective quantum yield was estimated by subtracting the final value at 24 h from the initial value at 0 h. Points depict means ± standard error (se).
Table 7 Linear mixed effect model for photosynthetic efficiency ΦPSII as Δ-effective quantum yield of Pocillopora spp. fragments during the inoculation experiment as part of the microbiome transplantation experiment. Significant terms are highlighted in bold.
Response variable Fixed effects denDF F P
Δ-effective quantum yield (Intercept) 16 21.78 < 0.001 ***
Inoculation Treatment 2 0.54 0.537
Overall, effective quantum yield decreased in both inoculation and control treatments when fragments were exposed to heat (inoculate: from 0.667 ± 0.005 at 24 h and 0.599
± 0.03 at 48 h, control: from 0.666 ± 0.007 at 24 h to 0.625 ± 0.01 at 48 h, Fig. 14).
27
GLMM analysis underlined that both decreases in Δ-effective quantum yield were significant (t = 2.52, p = 0.0117, Table 8, Fig. 16) and a post-hoc test revealed that there was no statistical difference between the decrease in both treatments (z = -0.982, p = 0.7597, Table 9). Under ambient conditions, control and inoculation fragments showed no difference in effective quantum yield (control: 0.659 ± 0.006 at 24 h and 0.655 ± 0.003 at 48 h, inoculate: 0.661 ± 0.003 at 24 h and 0.656 ± 0.004, Fig. 14).
GLMM and post-hoc analysis also displayed no difference in Δ-effective quantum yield between control and inoculation treatment during the ambient treatment (z = 0.511, p
= 0.9566, Table 9).
Figure 16 Δ-effective quantum yield of Pocillopora spp. fragments from the heat stress assay as part of the microbiome transplantation experiment. Inoculated and control coral fragments were exposed to the respective heat stress treatment (ambient = 29 °C and heat = 34 °C) from 24 h until 48 h. Points depict means ± standard error (se).
Table 8 Generalized linear mixed effect model for Δ-effective quantum yield over the duration of the heat stress assay as part of the microbiome transplantation experiment of control and inoculated fragments of Pocillopora spp.
Std. Error indicates standard error. Significant terms are highlighted in bold.
Response variable
Fixed effects Estimate Std.
Error
t value Pr(>|z|) Δ-effective
quantum yield
(Intercept) -4.486 0.363 -12.345 < 0.001 ***
Inoculation treatment -0.262 0.514 -0.511 0.610
Heat stress treatment 1.295 0.514 2.520 < 0.05 *
Inoculation treatment x heat stress treatment 0.767 0.727 1.055 0.291 Table 9 Tukey multiple pairwise post-hoc test of fitted generalized linear mixed effect model for Δ-effective quantum yield over the duration of the heat stress assay of Pocillopora spp. fragments. Std. Error indicates standard error.
Significant terms are highlighted in bold.
Response variable
Contrasts Estimate Std.
Error
z ratio P value
Δ-effective quantum yield
Control ambient – Inoculation ambient 0.262 0.514 0,511 0.9566 Control ambient – Control heat -1.295 0.514 -2.520 0.0596 Control ambient – Inoculation heat -1.799 0.514 -3.502 < 0.01 **
Inoculation ambient – Control heat -1.557 0.514 -3.031 < 0.05 * Inoculation ambient – Inoculation heat -2.062 0.514 -4.013 < 0.001 ***
Control heat – Inoculation heat -0.505 0.514 -0.982 0.7597
28 4.2.3 Preliminary bacterial community analysis
In total, 114,998 16S rRNA sequences were retained after Illumina Miseq sequencing, merging and sequence editing. Subsampling to 4423 reads per sample eliminated 31 samples (including all seawater samples) containing 1 to 772 sequences.
Consequently, this data set did not allow further analysis of bacterial communities present in seawater used throughout the experiment. The remaining 26 samples were unevenly distributed among sample groups (recipient fragments before inoculation: 12 samples/colonies; inoculate recipient fragments after inoculation: 5; control recipient fragments after inoculation: 7; donor inoculate: 2; Table 1; Table S2). Clustering resulted in 2549 OTUs at 97% a similarity cut-off.
We provide a preliminary characterization of the microbial community composition and structure of Pocillopora spp. fragments used in the microbiome transplantation experiment. In general, microbiomes of Pocillopora spp. were dominated by the families Rhodobacteraceae (15%), Flavobacteriaceae (6%), Cyclobacteriaceae (4%), Saprospiraceae (4%), Alteromonadaceae (4%), and Pseudoalteromonadaceae (3%;
average relative percentages across samples, Fig. S1). We did not find any bacterial family that dominated the communities by more than 50%. Estimated species richness (Chao 1 index) was highest and significantly different in the donor inoculate sample compared to the other samples of the inoculation experiment (Fig. 17 A; t = 3.56, p <
0.001, Table 10). Estimated species richness (Shannon index) did not differ significantly between samples (Fig. 17; Table 10).
Figure 17 α-diversity comparison between recipient fragments before inoculation (= start), control recipient fragments after inoculation (= control), inoculation recipient fragments after inoculation (= inoculation), and donor inoculate (= donor) of Pocillopora spp. Displayed are A) estimated species richness (Chao 1 Index) and B) estimated species diversity (Shannon Index).
29
Table 10 Generalized linear mixed effect model for each α-diversity index (Chao 1 = estimated species richness and Shannon index = estimated species diversity) of bacterial communities of Pocillopora spp. fragments from the inoculation experiment as part of the microbiome transplantation experiment. Significant terms are highlighted in bold. Std. error indicates standard error.
Response variable
Fixed effects Estimate Std. Error t value Pr(>|z|)
Chao 1 Index (Intercept) 4.580 0.166 27.641 < 0.001 ***
Control recipient coral fragments -0.196 0.273 -0.716 0.473
Inoculate recipient coral fragments 0.163 0.305 0.533 0.593
Donor inoculate 1.561 0.438 3.561 < 0.001 ***
Shannon Index (Intercept) 1.241 0.137 9.006 < 0.001 ***
Control recipient coral fragments -0.178 0.227 -0.786 0.432
Inoculate recipient coral fragments -0.211 0.254 -0.827 0.408
Donor inoculate 0.245 0.365 0.673 0.501
Microbial community composition at the OTU level visualized by a two-dimensional principle coordinate analysis (PcoA) based on the Jaccard index dissimilarity matrix cluster significantly apart clustered between donor homogenate and recipient fragment samples (Fig. S2; ANOSIM, R = 0.29, p = 0.0036). Clustering between recipient sample groups and start recipient fragment samples was very minor with an overlap of control recipients and inoculate recipient samples (Fig. S2).
4.2.4 First identification of potentially transplanted bacterial taxa
Subsequently, we present a first analysis towards identifying candidate bacterial taxa that have been potentially transplanted from the donor corals using a fresh tissue homogenate applied to recipient corals as inoculate. A Venn diagram shows the unique, shared, and ubiquitous OTUs across treatments in coral samples and the donor inoculate (Fig. 18). To identify whether and which OTUs were potentially transplanted by inoculation, the shared OTUs between the donor homogenate samples and recipient coral fragments were were extracted (Table 11). More information on sequence identity from the SILVA (release n. 132; Quast 2013) and GenBank (NBCI database) are displayed in the same table. In total, 9 OTUs were shared between the two sample groups (Fig. 18). These candidate OTUs were assigned to the bacterial families Spongiibacteraceae, Micavibrionaceae, Geminicoccaceae, Bdellovibrionaceae, Rubinisphaeraceae, Cryomorphaceae and Alteromonadaceae (Table 11). They were found in relatively low abundances of <0.3 % of total reads per sample and in 1-2 samples of all recipient samples (N=5).