Psychophysical features of the transition from pure heat perception to heat pain perception
STEFAN LAUTENBACHER, ANDREAS MÖLTNER, and FRIEDRICH STRIAN Max Planck Institute of Psychiatry, Clinical Institute, Munich, Germany
The psychophysical features ofthe transition from the pure heat to the heat pain range were studied in 25 healthy subjects (mean age 28.8 years). Thirty short heat stimuli from -1.6° C to + 1.6 ° C relative to the pain threshold were applied to the thenar of the left. hand with an appara- tus containing a Peltier thermode (nine different temperatures at 0.4 ° C intervals). The subjects rated the sensation intensity on a visual analogue scale. The resulting stimulus/sensation inten- sity relations could be explained equally well (same goodness of fit) by a model with a power func- tion (PF) and by a model with two linear regression lines (TLR), one for stimulus intensities be- low and one for those above the pain threshold and intersecting at the pain threshold. The slopes of the TLR model were significantly }arger above the pain threshold than below it. The PF model produced exponents between 1.8 and 1.9. We conclude that to describe the transition area, it is sufficient to use simple linear models for both the pure heat and the heat pain ranges.
Since Stevens's (1960) innovative approaches to psychophysics, the relation between stimulus intensity and sensation intensity has traditionally been expressed as a power function. This has been true also for the special case of the psychophysics of pain, where power functions have seemed to provide the best available models. The exponent of the power function has been interpreted as the capacity of the pain system to encode differing stim- ulus intensities in the pain range. But numerous studies on this topic have demonstrated that the exponent also de- pends on many other, mainly methodological, conditions, such as the type of power function (with or without thresh- old corrections; with or without an additiotiaf additive con- stant), the type of data (linear or logarithmic), the type of curve-fitting procedure (simple least squares procedure, or a variation of that procedure), the type and range of stimulus and sensation scaling, and the use of a modulus (Bromm & Treede, 1980; Cross, Tursky, & Lodge, 1975;
Jones & Gwynn, 1984; Rollman & Harris, 1987; Stam, Petrusic, & Spanos, 1981).
With electrocutaneous stimulation, the most common type used in pain psychophysics, the estimated exponents have varied widely, from 0.7 to 3.5 (Beck & Rosner, 1968;
Stevens, Carton, & Shickman, 1958), but in the more re- cent studies they have been concentrated in the range of 1.0 to 1.5 (Algom, Raphaeli, & Cohen-Raz, 1986, 1987;
Bromm & Treede, 1980; Jones & Gwynn, 1984; Rollman
& Harris, 1987).
This research was supported by Grant Str 273/3 from the Deutsche Forschungsgemeinschaft. We wish to lhank Maria Craig for her valu- able conunents on earlier versions ofthis manuscript. Correspondence should be addresscd to S. Lautcnbacher, Max Planck Institute of Psy- chiatry, Kraepelinstr. 10, 8000 Munich 40, Germany.
Studies on thermal pain have been less frequent. They have seemed to yield different results, depending on whether radiation or contact heating techniques have been used (Price, 1988). In a series of studies with radiation heating, Adair and coworkers (Adair, Stevens, & Marks, 1968) found an exponent near unity, whereas in several experiments with contact heating, Price and coworkers (Price, 1988; Price, Barrell, & Gracely, 1980; Price &
Harkins, 1987; Price, McGrath, Rafii, & Buckingham, 1983) observed a much more expansive power function with exponents of about 2. l.
We think that the contact heating experiments yielded an overestimation of the exponent. First, they involved a power function with a threshold correction, but the threshold was the base temperature of the procedure, 34°C or 35°C. And Adair et al. (1968) have shown con- vincingly that with threshold corrections far below the real pain threshold, the exponent is overestirnated, due alone to the formal properties of power functions. In a recent study, an exponent of 2 .1 was also found with radiation heating, but again probably only because the clearly non- painful temperature of 35 ° C was used as the "threshold „ (Campbell, Carstens, & Watkins, 1991). Second, and more relevant to the present study, the psychophysical function spanned the range from 34 ° C or 35 ° C to clearly painful stimulus intensities; that is, it covered the wannth, pure heat, and heat pain ranges, not just the heat pain range.
But data presented by LaMotte and Campbell (1978) sug- gest that the slope of the psychophysical function is close to linear both in the heat range and in the heat pain range and that an increase in slope occurs in the region of the pain threshold. A power function can be fitted to such data only if it can have an exponent that is considerably greater than unity.
685
The apparent inconsistencies in the results just summa- rized .led us to examine more closely the transition from pure heat perception to heat pain perception. We suspected that it was mainly the inclusion by Price and coworkers of this transition area in their psychophysical function that produced the exponent around 2.1 and not the use of con- tact heating. Our assumptions were as follows: (1) The psychophysical function that best describes the stimulus- intensity/sensation-intensity relationship in the transition area consists of two regression lines, one for the Stimuli below the pain threshold and one for those above it; and (2) the slope of the regression line for the pure heat range is less steep than the slope of the one for the heat pain range. To test these assumptions, we developed a psycho- physical model with two linear regression lines intersect- ing at the pain threshold. We then compared this model as to goodness of fit with one using the traditional power function with a threshold correction for the same stimu- lus range. Thus, we compared two models with three free parameters each (the number of parameters constitutes another influence on the goodness of fit; see Beck & Ros- ner, 1968; McCallum & Goldberg, 1975). We used short contact heat Stimuli selected relative to the subject's pain threshold, because we expected individual differences in the temperature at which the transition from pure heat to heat pain perception occurs.
METHOD
Subjects
Twenty-five healthy individuals with a mean age of 28.8 years (SD = 3.9) were investigate.d. Eleven were female, and 14 were male. The protocol was approve.d by an ethics commission.
Apparatus and Procedure
The stimulator was a temperature-controlle.d contact thermode with a stimulation surface of 1.6 x 3.6 cm, mounte.d on an articu- late.d arm. Contact pressure could be adjuste.d and was held at 0.4 N/cm1. The apparatus also included a thennode controller with a microcomputer for managing thermal stimulation and an IBM per- sonal computer for controlling the procedures and giving a basic evaluation. lntegrated into the response panel were visual signal- ing devices. Acoustic cues were delivered by the sound generator of the personal computer. The apparatus (PATH Tester MPI 100;
for details, see Galfe, Lautenbacher, Hölzl, & Strian, 1990) bad been developed earlier in the Department of Neurology of the Max Planck Institute of Psychiatry in cooperation with Phywe Systeme GmbH (Göttingen). The subjects sat upright at a table. The ther- mode was attached to the thenar of the left hand through a slot in the table. The subjects either used the response panel or gave their ratings with their right hands.
Each session staned with the determination of the pain thresh- old: Beginning at 36 ° C, eight heat stimuli were applled with a rate of tempcrature change of 1. 6 ° C/sec. The subjects were instructe.d to press a button as soon as they feit pain. Each time they pressed the bunon, the tempcrature rctumed to the base value at the same rate. The interstimulus intcrvals lasted at least lO sec. The start of eacb trial was announced visually and acoustically. but the stimu- lus was presentcd with a pseudorandomiz.ed delay of betwecn l and 3 sec. Thc pain threshold was calculatcd as the mean of the peak temperatures of thc last five stimuli.
In the second part of the experiment, 30 heat stimuli (base tem- perature, 36° C; rate of temperature change, l.6° C/sec; sawtooth form) were applie.d in three blocks of 10 each. The first stimulus of each block bad the intensity of the pain threshold and was the standard for the intensity rating. These replications ofthe Standard were use.d to control for shifts in the adaptation level. The remain- ing 9 stimuli varie.d in intensity around the pain threshold in steps of0.4° C, the maximum variation being ± l.6°C. Consequently.
each intensity was applied three times in each session. In each block, the order of the 9 stimuli was randomize.d. Each stimulus trial con- sisted of a stimulation interval lasting at least 10 sec and until the base temperature was reestablished, as weil as a rating interval of lO sec, which also constituted the interstimulus interval. Both in- tervals were signaled with acoustic and visual cues. The subjects rated the perceived intensity of each stimulus on a visual analogue scale (horizontal, 10 cm in length) with the left end marked as 03.
the right end as 100 % , and the midpoint as 50 % . No other points on the scale were marke.d. The subjects were instructed to rate the standard stimuli (first stimulus in each block) as 50% and the other stimuli relative to the modulus. The assumption was that this scale had the properties of an interval scale, which measures the subjec- tive deviation of the lest sensation from the modulus sensation.
Evaluation
Because the individual ratings spanne.d different portions of the füll visual analogue scale, we rescale.d the ratings (r) with the linear transformation
r' = (r - rmin) (100/rma. - rmin),
so that in each case thc lowest rating was 0% and the highest rating was 100%. (Because we assumed only interval properties but no ratio properties for our scale, such a rescaling was possible.) Then, for each of the nine stimulus intensities, we averaged the three rat- ings (r') to obtain a mean rating (R) for further evaluation.
We used three types ofpsychophysical model to describe the re- lation between the stimulus intensity (S) and the subject's rating (R). The tirst is a simple model consisting of one linear regression line with two free parameters (a, b):
R = aS + b. (OLR)
The second is a power function:
R = a(S - Sol. (PF)
where S0 is the estimated "threshold" (correction factor), which has no psychophysical meaning other than its being the estimated stimulus intensity of a 0% rating, and k is the exponent ofthe power function. This model has the three free parameters a, So, and k.
Thc third model, which we developed to describe the transition from pure heat to heat pain pcrception, consists of two regression lines, one for the stimulus intensities below and one for those above the measured pain threshold (C):
a,S + b, R= azS + b1 with the condition that
if s < c
if s ~ c
a,C + b, = azC + bz,
(TLR)
where a, and az are the slopes of the regression lines below and above the measured pain threshold ( C), respectively. Because of the condition, the lines intersect at C, and TLR has three free pa-
rameters just as PF does.
PURE HEAT AND HEAT PAIN PERCEPTION 687
Thc psychophysical functions wcrc fittcd to the individual and poolcd data by the method of least squares. Goodness of fit was evaluatcd with the use of the coefficient of detennination (r).
RESULTS
Psychophysical Parameters Derived From the Individual Data
Figure 1 shows the individual visual analogue scale rat- ings as weil as the group median and first and third quar- tiles for each temperature applied. lt is clear that most subjects had difficulty differentiating between the two lowest temperatures ( - l . 6 ° C and - 1. 2 ° C below pain threshold); above these temperatures, however, an in- crease in temperature seems to be monotonically related to an increase in the intensity rating. Correspondingly, except for the two lower stimuli, the ratings of consecu- tive stimulus intensities were always significantly differ- ent (the two lowest, p = .696; all others, p < .01; Wil- coxon signed-rank test). Only a few subjects had ratings that did not show a strong relation to the temperatures applied.
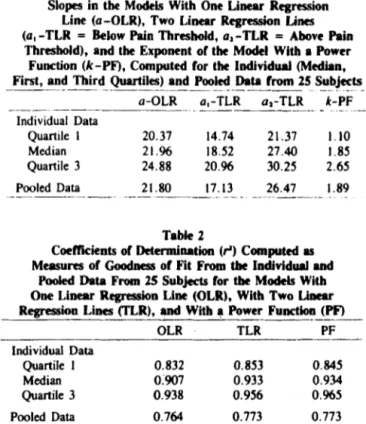
The slopes of the moclels with one linear regression line (OLR) and two linear regression lines (TLR) (these slopes give the average change in the rating for a 1 ° C tempera- ture change) and the exponents in the power function (PF) derived from the individual data are given in Table 1. The
ICJ)
.... c
"'
a:
< (/) >
100 Pain Threshold
90 80 70
60
so 0
40 30
20 D
10 D
-2.0 -1.6 -1.2 -0.11 -0.4 0.0 +0.4 +0.8 +1.2 +1.6 +2.0
Temperature Relative to Threshold (•c) Figutt l. Relation between temperature (relative to tbe pain tbreshold) and ratina of intensity oa a vbual analope scaJe (V AS);
eacb square repraents tbe standanlized and averaged (see tbe Method llldioa) r1llilll ~ one tempenture by l subject; tbe two over-
lappina square bnckets indicate quartiles l and 3 and tbe median for tbat tempenture.
Table 1
Slopes in the Models With One Linear R~ion Line (a-OLR), Two Linear Reg~n Lines (a,-TLR = Below Pain Threshold, a,-TLR = Above Pain
Threshold), and the Exponent or the Model With a Power Function (k-PF), Computed for the Individual (Median, First, and Third Quartiles) and Pooled Data from 25 Subjects ------··---·--- ----·--· -
Individual Data Quanile 1 Median Quanilc 3 Pooled Data
a-OLR a,-TLR a2-TLR k-PF - - -
20.37 14.74 21.37 1.10 21.96 18.52 27.40 1.85 24.88 20.96 30.25 2.65 21.80 17.13 26.47 1.89
---·---~---- ···-· - --···· ··---·--.
Table 2
Coeffk:ients of Detennination (r') Computed as Measures of Goodness of Fit From tbe Individual and
Pooled Data From 25 Subjects for tbe Models With One Linear Regreuion Une (OLR), With Two Linear R~ion Lines (TLR), and With ~Power Functio~JPF>
OLR TLR PF
Individual Data
Quartile 1 0.832 0.853 0.845
Median o:9CJ7 0.933 0.934
Quartile 3 0.938 0.956 0.965
Pooled Data 0.764 0.773 0.773
slopes in TLR above the pain threshold were significantly larger than those below (p < . 001, Wilcoxon signed-rank test). Furthermore, compared with the slopes in OLR, those in TLR were significantly smaller below the pain threshold and significantly larger above the pain thresh- old (for both differences, p < .001, Wilcoxon signed- rank test). In PF, the exponent values were larger than unity for most of the subjects, which suggests an expan- sive stimulus/sensation relationship in the transition area from pure heat to heat pain perception.
Table 2 shows the gooclness of fit obtained with the three moclels for the individual data. As expected, the coefficients of detennination were significantly !arger in both TLR and PF than in OLR (for both differences, p <
.001, Wilcoxon signed-rank test). TLR and PF did not differ in gooclness of fit (p = . 716, Wilcoxon signed-rank test).
Psychophysical Parameters Derived From the Pooled Data
The slopes of OLR and TLR and the exponent of PF corresponded quite weil to the median values for the in- dividual data (Table 1). The curves of the best-fitting func- tions for the pooled data are given in Figure 2. From the figure, it is clear that the curves of TLR and PF are quite similar to each other but not to the curve of OLR.
Duc to the additional source of variance-that is, the interindividual differences-gooclness of fit was poorer with the pooled data than with the individual data (Ta- ble 2). Again, TLR and PF explained equal ponions of the variance and were superior to OLR, although the dif- ferences were quite small.
For both the individual and the pooled data, TLR and PF were equally good in explaining the stimulus/sensa- tion relationship. Both models suggest that the part of the psychophysical function above the pain threshold has a
!arger slope than does the part below it.
Correlations Between the Pychophysical Parameters
The median of the pain thresholds measured was 45.40°C, with Quartile 1 = 43.15°C and Quartile 3 =
47.80°C.
If it is true that the transition from pure heat to heat pain perception has similar psychophysical characteris- tics in different individuals but that the temperature at which the transition occurs varies from one individual to another, then the correlations between the pain threshold and the parameters of the psychophysical models should be close to zero. The correlations are given in Table 3.
The findings are consistent with this assumption for TLR and PF, but not for OLR, where the pain threshold had a significant positive correlation with the steepness of the slope. Because TLR and PF are superior to OLR in good- ness of fit for both the individual and the pooled data, the assumption does not have to be rejected.
Whereas the significant positive correlations between the slope of OLR and the slopes of TLR above and be- low the pain thresho\d are not surprising, the correlations
100 Pain Threshold
90
80 1
70
M Cl 60
c ·· OLR
... l'O 50
er -TLR
(/) 40
c{ > - - PF
30 20 10
0 -2 -1.0 0.0 1.0 2
T emperature Relative to Threshold t•ci
Flsun 2. Psychopllysical curves ror the relation bdween temper- atun (relative to tbe pain thnshold) and rating of intensity on a risual ....,_Kaie (V AS) cakulated with tbe tbrtt models: wlth om linar rep"9lion llne (OLR). wttb two linaar ~ lines inten«ting at tbe pain threshold (TLR). and with a power func- tion (PF). Data an pooled rrom 25 subjeds.
Table 3
Spearman Rank Correlations Between the Pain Threshold (PT), the Slopes in the Models With One Linear Regression Line (a-OLR) and Two Linear Regression Lines (a1 -TLR = Below Pain Threshold, ai-TLR =
Above Pain Threshold), and the Exponent of the Model With a Powe~11_~~.!~:_~!'); _n = 25 i'! Each Correlation
a-OLR 01-TLR a2-TLR k-PF
-- ---- - -- ---· ---·--·-·--„---- - -- ---- - --·--····--·--
o-OLR PT 01-TLR 02-TLR
0.414*
---~--~--- ---~---
0.084 0.293 0.047
0.533t 0.594t -0.222 -0.249 -0.879+
0.512t
*p s .05. tp s .OL tp s .001.
between the exponent of PF and the slopes of TLR are, especially considering their size (see Table 3). Accord- ing to these correlations, the exponent of PF had a very close negative relationship to the slope ofTLR below the pain threshold. This means that a slow increase in the rat- ing with increases in Stimulus intensity in the heat range below the pain threshold was strongly associated with a large exponent in the power function over the whole stim- ulus range, and vice versa. In other words, with the in- clusion of both the heat range and the heat pain range in one psychophysical function, large exponents do not nec- essarily indicate a strongly expansive relation between stimulus intensity and sensation intensity in the pain range;
rather, they seem to result mainly from the slope of the psychophysical curve in the heat range.
DISCUSSION
The findings in the present study demonstrate that the two models (our model with two linear regression lines intersecting at the pain threshold, and the traditional one with a power function) are equally good in explaining the transition from pure heat to heat pain perception. The rea- sons why we prefer our model are as follows: First, our model takes into account that there is a change in sensory modality, whereas the exponential model does not. Sec- ond, the assumption of linearity, the simplest one in psychophysics, seems tobe sufficient to explain both the upper heat range and the lower heat pain range.
As expected, in our model, the slopes were significantly greater in the heat pain range than they were in the pure heat range. This is compatible with a better discrimina- tion ability in the heat pain range, as has already been observed by others (Kenshalo, Anton, & Duhner, 1989;
Robinson, Torebjoerk, & LaMotte, 1983). The weaker discrimination ability in the heat range might be the rea- son why our subjects had trouble discriminating the two stimuli with the lowest temperatures, which surely were nonpainful.
To explain our data over the whole stimulus range from -l.6°C below to +l.6°C above the individual pain threshold by a power function, exponents between t .8 and 1. 9 were needed. These exponent values are very similar to those reported by Price and coworkers (Price, 1988;
PURE HEAT AND HEAT PAIN PERCEPTION 689 Price et al., 1980; Price & Harkins, 1987; Price et al.,
1983), which were around 2.1 and which these authors interpreted as "pain parameters." The fact that the psychophysical functions used by these authors included both the heat range and the heat pain range, as in our study, allows the interpretation that the exponents are not compelling evidence for an expansive stimulus/sensation relationship in the heat pain range. For our results indi- cate that exponents of this size may also result from a stim- ulus/sensation relationship with two linear limbs, one in the pure heat range and one in the heat pain range, with a greater slope above the pain threshold than below it.
An inspection of the data presented graphically in sev- eral studies on the stimulus/sensation relationship with heat stimuli ranging from nonpainful to painful cor- roborates this view (Duncan, Bushnell, & Lavigne, 1989;
Duncan, Bushnell, Lavigne, Lavoie, & Rivest, 1986 [data presented graphically in Price, 1988]; LaMotte & Camp- bell, 1978; Price et al., 1980). Straight lines can be fit- ted to the data quite weil until about 45°C-46°C, and also from these temperatures on, but there is a rather abrupt change to a greater slope in this region.
Preselected, absolute temperature scales were used in these studies and not, as in our study, a psychophysically determined temperature scale related to the pain thresh- old. Therefore, interindividual variations in the location of the pain threshold may have obscured changes in the slopes of the individual data that were actually even more abrupt. The psychophysical data from studies with a more limited stimulus range, either ending (Refinetti, 1989) or starting (Price, Harkins, Rafii, & Price, 1986; Price, McHaffie, & Larson, 1989; Price, Von der Gruen, Miller, Rafii, & Price, 1985) in the pain threshold region, show much smaller changes in slope.
Our finding of a highly significant negative correlation between the slope computed for the pure heat range ac- cording to the model with two linear regression lines and the exponent of the power function computed for the whole stimulus range demonstrates that even the lower part of the psychophysical curve had a strong influence on the size of the exponents. This suggests that the "pain"
exponents reported by Price and coworkers (Price, 1988;
Price et al., 1980; Price & Harkins, 1987; Price et al., 1983) were also strongly affected by the slope of the psychophysical function in the heat range. Therefore we think that if true pain pararneters are tobe derived, the pain threshold must be used as the lower limit of the stim- ulus range.
As mentioned earlier, the view has been expressed (Price, 1988) that different types of heat pain, such as con- tact and radiation heat pain, have different psychophysical characteristics and in particular different exponents in a power function. We now postulate that these differences can be explained by the fact that in some studies the tran- sition from pure heat perception to heat pain perception is included in the psychophysical function and in others it is not. A promising approach for investigating psycho- physical functions including this transition is the use of
two-limbed functions that intersect at the pain threshold.
A limitation to linear models is not obligatory. However, a reasonable relation between the number of function pa- rameters and the number of available data points must be preserved.
REFERENCES
ADAIR, E. R .. STEVENS, J. C., a. MARKS, L. E. (1968). Thcnnally in- duced pain, the Dol scale, and the psychophysical power law. Alrwrican Journal of Psycho/ogy, 81, 147-164.
ALGOM, D., RAPHAEL!, N., a. CoHEN-RAZ, L. (1986). Integration of noxious stimulation across separate somatoscnsory communications systems: A functional lhcory of pain. Journal of E.xperi~ntal Psy- chology: Hu"11J/1 Perception & Performance, 12, 92-102.
ALC.OM, D., RAPHAEU, N., a. CoHEN-RAZ, L. (1987). Pain combines additively across different sensory systems: A further support for lhc functional theory of pain. Perceptual & Motor Skills. 65, 619-625.
BECK, C., a. ROSNER, B. S. (1968). Magnitude scalcs and somatic evokcd potentials to percutaneous elcctrical stimulation. Physiology & Be- havior, 3, 947-953.
BROMM, 8., A TREEDE, R.-D. (1980). Withdrawal rcflex, slcin resistancc reaction and pain ratings due to electrical stimuli in man. Pain, 9, 339-354.
CAMPBELL, 1. G., CARSTENS, E., a. WATK.JNS, L. R. (1991). Compar- ison of human pain sensation and flexion withdrawal evokcd by nox- ious radiant hcat. Pain, 45, 259-268.
CRoss, D. V., TuRSKY, B., a. LoooE, M. (1975). The roleofrcgrcs- sion and range effects in detennination of lhc power function for elec- tric shock. Perception & Psychophysics, 18, 9-14.
DuNCAN, G. H., BusHNELL, M. C., a. LAVIGNE, G. 1. (1989). Com- parison of verbal and visual analoguc scales for mcasuring the inten- sity and unpleasantness of experimental pain. Pain, 37, 295-303.
DUNCAN, G., 8USHNELL, C., LAVlGNE, G., LAVOIE, M .•• RrvEST, P.
(1986). Comparison ofverbal and visual analogue scales for measur- ing experimental pain. Journal of Den1a/ Research, 65, 307.
GALFE, G., LAUTENBACHER, S., HÖLZL, R., A STRJAN, F. (1990). Di- agnosis of small fibrc neuropathy: Computer-assistcd mcthods of com- bined pain and thermal sensitivity detennination. Hospi~dica, 8(7).
38-48.
JoNES, 8., a. GwvNN, M. (1984). Functional measurcmcnt scales of painful electric shocks. Perception & Psychophysics, 35, 193-200.
KENSHALO, D. R., JR., ANTON, F., A DUBNER, R. (1989). Thcdetec- tion and perceivcd intensity of noxious thermal stimuli in monltey and in human. Journal of Neurophysiology, 62, 429-436.
LAMOTTE, R. H., a. CAMPBELL, J. N. (1978). Comparison ofrcsponses of wann and nociceptive C-fiber afferents in monkey with human judg- mcnts of thermal pain. Journal of Neurophysiology, 41, 509-528.
McCALLUM, P .• a. GoWBERG, H. (1975). Magnitude scales for electro- cutancous stimulation. Perception & Psychophysics, 17, 75-78.
PRK:E, D. D. (1988). Psychological & neural ~chanisms ofpain. New York: Raven Press.
PRICE, D. D., 8ARRELL, J. J .• a. GRACELY, R. H. (1980). A psycho- physical analysis of experimental factors that selectively inßuence thc affective dimension of pain. Pain, 8, 137-149.
PRicE, D. D., a. HARKINS, S. W. ( 1987). Combincd use of experimen- tal pain and visual analogue scales in providing standardized mca- suremcnt of clinical pain. Clinical Journal of Pain, 3, 1-8.
PRK:E, D. D., HARKINS, S. W., RAm, A., a. PalcE, C. (1986). A simul- taneous comparison of Fenantyl's analgesic effects on experimental and clinical pain. Pain, 24, 197-203.
PRK:E, D. D .• M&RATH, P. A., RAm, A., a. BuclCINGHAM, B. (1983).
The validation of visual analogue scales as ratio scale measurcs for chronic and experimental pain. Pain, 17, 45-56.
PR.lcE, D. D., McHArnE, J. G.,. LAISON, M. A. (1989). Spltial swn- mation of heat-induced pain: lnflucnce of stimulus arca and spmtial separation of stimuli on pcrccivcd pain sensation intensity and un·
pleasantness. Journal of N~urophysiology, 62, 1270-1279.
PalcE, D. D., VON DEaGauEN, A., MILL.ER. J., RAFD, A.,aPlrcE, C.
( 198.5). A psychophysical analysis of morphinc analgesia. Pain, ll, 261-269.
RHlNETn. R. ( 1989). Magnitude estimation of warmth: Intra· and inter·
subject variability. Perctption & Psyclwphysics, 46, 81-84.
ROBINSON. C. J„ TollEBJOEllK, H. E., A LAMOTTE, R. H. (1983).
Psychophysical deleetion and pain ratings of incremcnlal thermal stim- uli: A compariwn with nociceptor responses in humans. Brain Re- .rearch, 274, 87-I06.
Rou.MAN, G. B., A HARRIS. G. (1987). The detectability, discrimina- bility, and perceived magnitude of painful electrical shoclc. Percep- tion & Ps.~·chophy.rio. 42. 257-268.
STAM, H. J„ PETRUSIC, W. M., A SPANOS, N. P. (1981). Magnitude scales for cold pressor pain. Perception & Psyclwphysics, 29, 612-617.
STEVENS. S. S. (1960). Thc psychophysics of sensory functions. Ameri·
can Scientist, 48, 226-253.
STEVENS, s. s„ CARTON, A. s„ A SHICKMAN, G. M. (19.58). A scale of apparent intensity of ele.ctric shock. Journal of Experimental Psy·
chology, 56, 328-334 .
(Manuscript received June 4, 1991;
revision accepted for publication June 6, 1992.)