Report No. 22323-IN
India
Poverty in India
The Challenge of Uttar Pradesh
May 08, 2002
Poverty Reduction and Economic Management Sector Unit South Asia Region
Document of the World Bank
Public Disclosure AuthorizedPublic Disclosure AuthorizedPublic Disclosure AuthorizedPublic Disclosure Authorized
CURRENCY EQUIVALENTS Currency units: Rupees (Rs.) as of February 14, 2002
$1 = Rs. 48.34
Units I Lakh = 100 thousand
I Crore = 10 mllion GOVERNMENT'S FISCAL YEAR
April 1- March 31
ABBREVIATIONS AND AcRoNYMs
ANM Auxiliary Nurse Midwife NGO Non-Govemment Organization
AP Andhra Pradesh NSS National Sample Survey
APPs Anti-Poverty Programs NSSO National Sample Survey Organization
BDO Block Development Office OBC Other Backward Caste
BEP/BPEP Basic Education Program O&M Operation and Maintenance
BJP Bharatiya Janata Party PDS Public Distribution System
BPL Below Poverty Line PHC Primary Health Center
BRI Bank Rakayat Indonesia PROBE Public Report on Basic Education in India
BSP Bahujan Samaj Party PSMS Poverty and Social Monitoring System
CHC Community Health Centre PRIs Panchayati Raj Institutions
CMIE Centre for Monitoring Indian Economy R&D Research and Development DWCRA Development of Women and Children in Rural Areas RBI Reserve Bank of India DPEP District Primary Education Program RMPs Rural Medical Practitioners
EAS Employment Assurance Scheme SC Scheduled Caste
EGS Employment Guarantee Scheme SEBs State Electricity Boards
FCI Food Corporation of India SEWA Self-Employed Women's Association
GOI Govemment of India SITRA Supply of Improved Toolkits to Rural Artisans
GOUP Govemment of Uttar Pradesh SGSY Swamjayanti Gram Swarozgar Yojana
GSDP Gross State Domestic Product SJSRY Swam Jayanti Shahari Swarozgar Yojana
HDR Human Development Report SME Small and Medium Enterpnse
HUDCO Housing and Urban Development Corporation Limited SSI Small Scale Industry
HYV High-Yielding Variety SSK Sahbhagi Shikshan Kendra
[AY Indira Awas Yojana ST Scheduled Tribe
ICDS Integrated Child Development Services TRYSEM Training of Rural Youth for Self-Employment lIPS Intemational Institute for Population Sciences TPDS Targeted Public Distribution System
IRDP Integrated Rural Development Program UK United Kingdom
JGSY Jawahar Gram Samridhi Yojana UP Uttar Pradesh
JRY Jawahar Rozgar Yojana UPHSDP Uttar Pradesh Health Systems Development Project
kWh Kilo Watt Hour VRS Voluntary Retirement Scheme
MP Madhya Pradesh WHO World Health Organisation
NCAER National Council of Applied Economic Research WUA Water-Users Association NFHS National Family Health Survey
Vice President : Mieko Nishimizu Country Director Edwin Lim
Sector Director Sadiq Ahmed Sector Manager Sanjay Pradhan
Task Leader Valerie Kozel
CONTENTS
Executive Summary ... i
Chapter 1: Poverty in Uttar Pradesh - The Context ... 1
A. An Introduction ... 1
B. India's and UP's Poverty Reduction Strategies ... 2
C. Data Sources and Data Concerns ... 8
D. Defining Poverty: Levels, Trends, Vulnerability, and Voice ... 13
Chapter 2: Profile of the Poor: Poverty of Resources, Access, and Relationships ... 33
A. Introduction ... 33
B. Voices of the Poor ... 33
C. Private, Public, and Social Assets ... 34
D. Social Identity and Economic Exclusion ... 42
E. Heterogeneity of the Poor: Why Does it Matter? ... 51
Chapter 3: Governance And Poverty Reduction In Uttar Pradesh ... 55
A. Introduction ... 55
B. The Failure of Public Services in UP ... 55
C. The Impact of Declining Service Delivery on the Poor: the Case of Justice and Legal Redress ... 63
D. Redressing the Imbalances ... 66
Chapter 4: Economic Opportunities For The Poor ... 73
A. Introduction ... 73
B. Improving the Climate for Private-Sector-Led Growth ... 74
C. Rural Development: Agriculture's Central Role ... 79
D. Expanding Rural Off-Farm Opportunities ... 86
E. Widening Opportunities for the Socially Excluded ... 89
Chapter 5: Strengthening Delivery: Social Services and Safety Nets ... 93
A. Introduction ... 93
B. Education ... 94
C. Health ... 105
D. Safety-Net Programs ... 1... III Annex I ... 123
Annex II ... 127
Annex Tables ... 131
References ... 139
List of Tables
Table 1.1 Growth Trends in UP and All-India ... l1
Table 1.2 Trends in Poverty: Uttar Pradesh and All-India Headcounts ... 15
Table 1.3 Urban and Rural Poverty Levels, Depth, and Severity in Uttar Pradesh ... 15
Table 1.4 Economic Trends in the 1990s ... 17
Table 1.5 Alternative Trends in Poverty, Model Predictions: Uttar Pradesh and All-India ... 18
Table 1.6 Socioeconomic Indicators by Region ... 19
Table 1.7 Regional Trends in Poverty ... 20
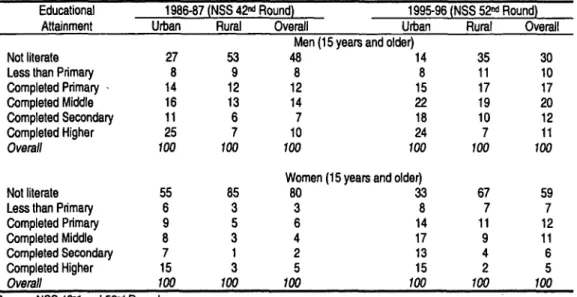
Table 1.8 Highest Educational Attainment of the Population ... 22
Table 1.9 Literacy Rates for Selected States, By Gender ... 23
Table 1.10 Net School Enrollment Rates in Uttar Pradesh, By Caste and Gender ... 25
Table 2.1 Poverty Incidence by Occupation of Household Head ... 35
Table 2.2 Rural Poverty Incidence and Shares by Land Ownership ... 36
Table 2.3 Poverty Incidence and Shares by Level of Education of the Household Head ... 37
Table 2.4 Comparison of Health Status of Children in Uttar Pradesh, by Quintile ... 38
Table 2.5 Housing and Access to Basic Services, NSS 55t Round (1999-00) Urban and Rural Areas (Percent) ... 40
Table 2.6 Poverty Incidence and Shares by Caste Status ... 43
Table 2.7 Differential Returns to Assets: Scheduled Caste/Tribe and Other Castes (Percent) ... 46
Table 2.8 Distribution of Employment by Gender ... 49
Table 3.1 State Government Employment per 100 Population ... 60
Table 3.2 Increase in UP Civil Service Employment, 1971-92 ... 61
Table 4.1 Perceptions of the Investment Climate, Rankings for Major Indian States in 1999 ... 76
Table 4.2 Dependence on Non-Institutional Sources of Credit Among Rural Households ... 79
Table 4.3 Land Ownership and Poverty-Rural Uttar Pradesh ... 86
Table 4.4 Work Intensity and Earnings-Rural Uttar Pradesh ... 87
Table 4.5 Percentage of Female to Male Employees in the Organized Sector ... 91
Table 5.1 Government Spending on Social Services and Social Protection ... 93
Table 5.2 Education Level and Principal Occupation of Main and Marginal Workers ... 95
Table 5.3 Average School Enrollment Rates, Children Aged 7-12 Years 1999-00 ... 96
Table 5.4 State Spending on Education ... 98
Table 5.5 School Enrollments by Type of School, 1999-00 by Quintile ... 102
Table 5.6 Access to Reproductive and Child Health Services: by State and Level of Wealth .... 107
Table 5.7 Public Sector Health Expenditure by Quintile, 1995-96 ... 110
Table 5.8 State Spending on Poverty Alleviation Measures, 1998-99, 1999-00 ... 113
Table 5.9 Rural Entitlements and Purchases from the TPDS, Past 30 Days, 1999-00 ... 114
Table 5.10 Regional Poverty Incidence and Allocation of PDS Subsidies ... 115
Table 5.11 Use of Selected Government Programs by Per-Capita Expenditure Quintile ... 117
Table 5.12 Financing of Illness-Related Expenditures by Quintile ... 121
Table 5.13 Sources of Loans and Overall Prevalence and Magnitude of Indebtedness by Quintile ... 122
List of Boxes Box 1.1 Poverty and Social Monitoring in Uttar Pradesh ... 1 1 Box 1.2 Vulnerability to Shocks ... 28
Box 1.3 Political Organization and the Urban Poor: Many Voices are Better Than One ... 29
Box 1.4 Rural Destitution ... 30
Box 1.5 Palanpur Village: Paradoxes of Rural Development ... 31
Box 2.1 People's Perceptions of Poverty ... , , , , . .34 Box 2.2 Access to Facilities in Rural Uttar Pradesh .39
Box 2.3 Signs of Transition .40
Box 2.4 Unrecognized Settlements: The Urban Underclass .41 Box 2.5 Why Invest in Social Relations? .42
Box 2.6 Caste in Indian Society .43
Box 2.7 The Impact of Caste and Wealth on School Enrollments .44
Box 2.8 Patterns of Employment in Rural UP-Poverty and Caste ... 47 Box 2.9 The Plight of Poor Women .48
Box 2.10 Broken Dreams of the Poorest .51
Box 3.1 Case Study: The Decline of the UP Irrigation Department .55 Box 3.2 General Overview of Government Organization in Uttar Pradesh .58 Box 3.3 Justice in Moradabad, UP .66
Box 3.4 Participation in Local Democracy in Jamalpur, UP .68
Box 4.1 The Leatherworkers of Bonetown - An Urban Success Story .75 Box 4.2 Improving the Business Environment in Karnataka .76
Box 4.3 UP Sodic Lands Reclamation Project I and II. 84
Box 4.4 Licensing Laws in Uttar Pradesh .85
Box 4.5 Workforce Participation of Men and Women in Two Poor Regions of UP .90
Box 5.1 The Midday Meals Program: Who Benefits? . 1 1
Box 5.2 Primary Education Project in UP .103 Box 5.3 The Progresa Program in Mexico .104 Box 5.4 The Health Situation in Chitrakot District .106 Box 5.5 The Role of "Alternative" Health Care Providers .108
Box 5.6 Failures and Successes of the Health System in UP .108 Box 5.7 Innovative Health Insurance Schemes in Indiada .l Box 5.8 India's Anti-Poverty Programmes (APPs) .112
Box 5.9 Recent Efforts to Improve Targeting of Foodgrains Through the PDS .115 Box 5.10 Transparency and Accountability Under JRY Activities .118
Box 5.11 Innovative Micro-Credit Programs .120 List of Figures Figure 1.1 Poverty Levels by State, 1983 and 1999-00 .14 Figure 1.2 Poverty Levels by Region .19
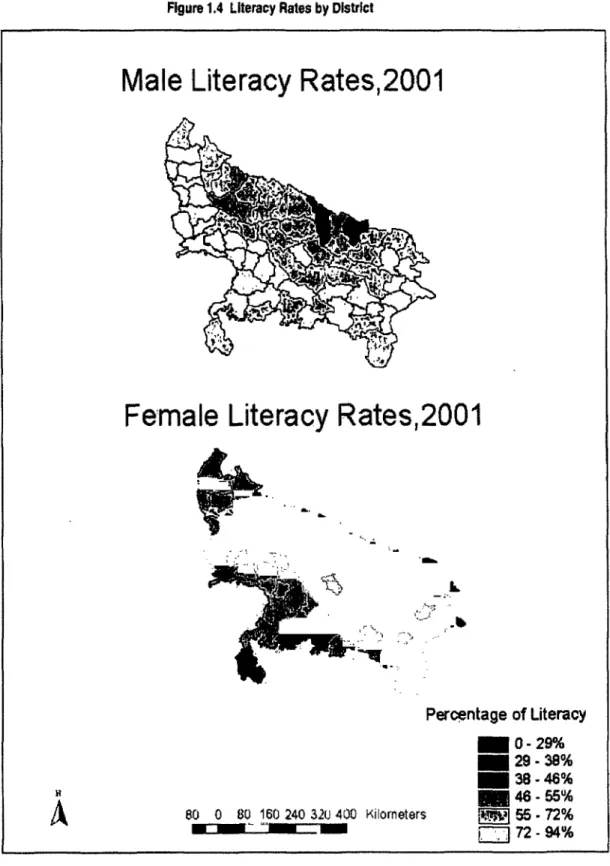
Figure 1.3 Regional Distribution of the Poor as Compared to the Population .21 Figure 1.4 Literacy Rates by District .24
Figure 1.5 Health Indicators by State, 1998-99 ... 26 Figure 1.6 Infant and Child Mortality by Time Period .27
Figure 2.1 All-India Incidence of Disease by Wealth, 1992-93 .38 Figure 4.1 Poverty and Agricultural Growth in Uttar Pradesh .81
Figure 4.2 Uttar Pradesh: Rural Income Shares by Per-Capita Income Quintiles .88 Figure 5.1 Returns to Education: RslPerson/Month, 1993-94 .95
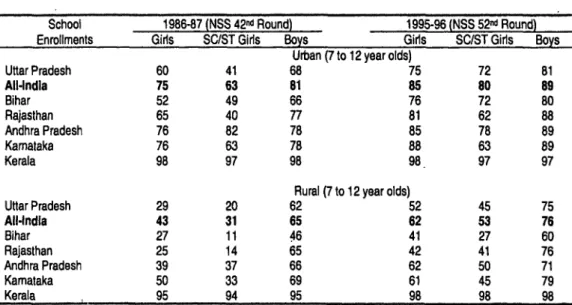
Figure 5.2 Proportion of Children Enrolled in School, 7-12 Years Old NSS 4 2 nd Round (1986-87) and 5 2nd Round (1995-96) .97
Figure 5.3 Percent of Official BPL Households .116
ACKNOWLEDGMENTS
This report was prepared by a team led by Valerie Kozel, Senior Economist, South Asia PREM. The draft was prepared under the direction of Roberto Zagha, Sector Director, South Asia PREM, and finalized under the direction of Sanjay Pradhan, Sector Manager for
Governance and Poverty, and Sadiq Ahmed, Chief Economist and Sector Director, South Asia PREM. The report draws on contributions from: Salman Zaidi (SASPR, poverty trends and poverty profile, regional dimensions of poverty, differential returns); Ravi Srivastava (consultant, growth and labor markets, co-managed UP/Bihar Poverty Study); Robert Beschel and Alpa Shah (SASPR, governance chapter); Barbara Parker (consultant, vulnerability and qualitative work on urban and rural poverty, co-managed Urban Poverty in Uttar Pradesh study); Monica Jain (SASPR, poverty profile and general research assistance); Madhavi Kukreja (social
activist/consultant, gender, co-managed Urban Poverty in Uttar Pradesh study); David Peters with contributions from Abdo Yazbeck and G N V Ramana (SASHD, health); Ruth Alsop (SASSD, empowerment and social issues, managed Consultations on Poverty Monitoring study);
Rie Hiraoko (Asian Development Bank, child labor); Elena Glinskaya (SASPR, NSS 55h round poverty profile); Madhu Raghunath (SASPR, general editoral and research assistance); Nand Kishore Singh (consultant, NSS 55h round poverty profile); Peter Lanjouw (DECRG, differential returns, rural non-farm employment); Martin Ravallion (DECRG, poverty simulations) and Gaurav Datt (EASPR, poverty simulations); and Angus Deaton (consultant, education, poverty methodology and measurement).
Alfred Friendly provided editorial assistance and Juliet Teodosio and Oxana Bricha finalized the document.
The report also benefited from collaboration and discussions with Indian researchers, social activists, and institutions. Apart from those already mentioned, these include Dr. Nisha Srivastava (Allahabad University), Ajay Kumar (Center for Action Research and Development Initiatives), Sandeep Khare (Vigyan), Shashi Bhushan (A. N. Sinha Institute), Dr. A. K. Singh (Giri Institute), Sahbhagi Shikshan Kendra (SSK), and the wonderful staff of women at Vanangana, who gave generously of their time and knowledge. Useful feedback and guidance was provided at two workshops organized by the Planning Department, Government of Uttar Pradesh (GoUP), with wide attendance from Government line departments as well as eminent scholars and researchers. The first workshop in October, 2000 reviewed an early draft of the report; a follow-on workshop was held in August, 2001 to discuss the draft final report. In addition, valuable comments were provided by the Planning Commission as well as the Department of Economic Affairs, Ministry of Finance, Government of India.
Pravin Visaria, formerly head of the Institute of Economic Growth, was a source of inspiration and support throughout the work. His recent death is a loss to all of us.
The peer reviewers include Martin Ravallion (DECRG), Lionel Demery (AFTMI), Reider Kvam (SASSD), and Pravin Visaria (Institute of Economic Growth); their inputs were
invaluable. Also appreciated are comments and advice provided by individuals at various points in the process, including Nicolas Stern, Joelle Chassard, Angus Deaton, Shahrokh F,ardoust, Manuela Ferro, Edgardo Favaro, Elena Glinskaya, Ward Henevald, Keith Hinchcliffe, Christopher Hoban, Stephen Howes, Venita Kaul, Sumir Lal, Rinku Murgai, Peter Lanjouw, Giovanna Prennushi, Pronab Sen, and Dina Umalia-Deininger.
A special note of appreciation is due to Michael Walton, who supported the early work on quantitative and qualitative aspects of poverty (UP/Bihar Poverty Study) and encouraged development of new themes and new thinking. Also to Roberto Zagha, who not only supported the early work but also helped to bring the report to closure. Finally, special thanks to colleagues and friends on the Poverty Board and wider poverty "community" in the Bank; we learn from each other and continue to break new ground.
EXECUTIVE SUMMARY
1. Rich in potential - in human and natural resources - Uttar Pradesh (UP) once appeared positioned to be the pace-setter for India's economic and social development. Most of the state lies in the fertile Indo-Gangetic Plain, with high natural soil fertility, abundant rainfall, and surface and groundwater resources. The Western region was the springboard for the Green Revolution in the 1960s and 1970s, which helped UP depart from previously low levels of agricultural growth. Purposeful investments in agricultural research, extension, roads, irrigation, and marketing infrastructure fueled further advances in the 1980s; growth accelerated,
accompanied by steady reductions in poverty between the late-1970s and 1980s. Uttar Pradesh, however, now shows less promise. Economic growth faltered in the 1990s and UP has fallen behind India's better performing states. While a recent acceleration in growth suggests that the deterioration in UP's performance has been arrested, many problems remain.
2. At the heart of the state's loss of economic momentum is the loss of effectiveness of the public sector, which has led to an investment climate not supportive of private investment and growth, and to poor performance in the delivery of social and infrastructure services essential for growth and poverty reduction. Reversing this loss of dynamism and the impact of that loss on the
state's 60 million inhabitants (out of 175 million') who live in poverty is the state's most important challenge. A comprehensive reform program was launched in 1998 to improve the performance of the public sector and initial measures were taken. But the pace of reform has been slow. As a result, UP's poor risk falling further and further behind if reforms to accelerate poverty reduction fail to accelerate. Because Uttar Pradesh is very large - larger than many countries - and very poor, meeting this challenge is important not only for India, but of global significance. An estimated 8 percent of the world's poor live in UP alone.2
The Face of Poverty in Uttar Pradesh
3. The report documents poverty along a number of dimensions - material deprivation, human deprivation, and a range of other deprivations - e.g. lack of voice, vulnerability,
destitution, and social exclusion. Progress across all dimensions is essential if UP is to meet the ambitious development goals laid out in the Government of India's Tenth Five Year Plan, as well as the Mitlennium Development Goals (MDGs).
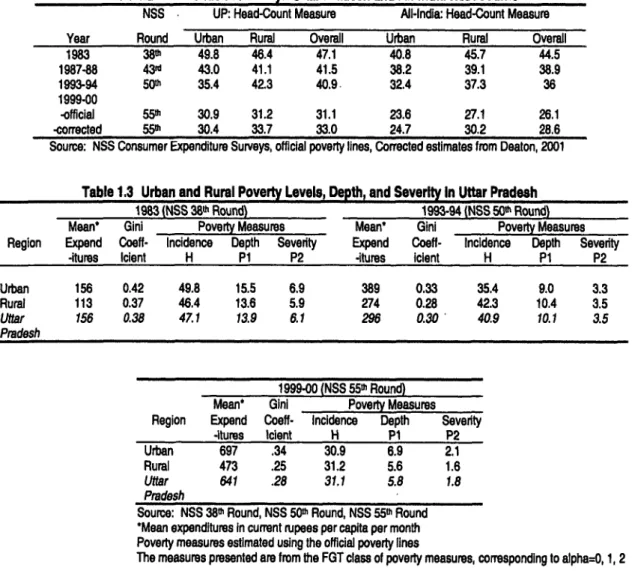
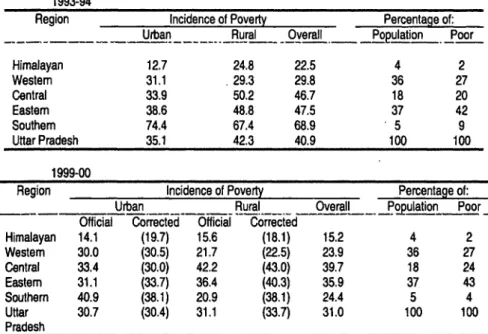
4. Poverty, measured in terms of material deprivation, is high in UP relative to other Indian states, and progress at reducing poverty has been uneven over the past two decades. The vast majority of poor households live in rural areas (80 percent) and poverty historicaUy has been concentrated in the Eastern and Southern regions of the state. Official estimates suggest a decline in poverty between 1983 and 1987-88, with progress diminishing through 1993-94.
5. India's progress at reducing poverty in the latter half of the 1990s has been the subject of intense debate, both in India and worldwide. Official estimates based on the most recent National Sample Survey (NSS 55h Round, 1999-00) herald a dramatic decline in the number of poor people living in the state: poverty is estimated to have fallen by 10 percentage points over 6 years - from 41 percent of the total population in 1993-94 to 31 percent in 1999-00. However, changes in the survey methodology have rendered the 55th Round results incompatible with earlier rounds of the NSS. There is still evidence of considerable progress when an econometric method is used 'The statistics used throughout this report deal with Uttar Pradesh as it was before October, 2000, when its Himalayan Region became the separate state of Uttaranchal.
2Based on an international poverty line of $1.08/person/day in 1993 PPP adjusted prices, 1998 estimates.
ii Executive Summary
to correct the official estimates - according to this method, poverty fell to 34 percent of the population in 1999-003. This is despite only moderate improvement in average welfare levels;
UP has a high concentration of poor people around the poverty line and a little growth can result in a substantial reduction in the number of poor people living in the state. However, rnany of the erstwhile poor hover just above the poverty line and remain highly vulnerable to shocks that could plunge them back into poverty. An alternative forecasting exercise suggests that poverty in UP fell at roughly half the rate implied by official estimates4. Regardless of the method used, there is growing evidence of progress, which is encouraging in light of UP's very slow progress in earlier years.
Trends in Poverty: All-Indla and Uttar Pradesh
Year Source UP Head-Count Ratio (%) All India Head-Count Ratio (%)
Urban Rural Overall Urban Rural Overall
1983 NSS 38P Round 49.8 46.4 47.1 40.8 45.7 44.5
1987-88 NSS43fd Round 43.0 41.1 41.5 38.2 39.1 38.9
1993-94 NSS 50h Round 35.4 42.3 40.9 32.4 37.3 36.0
1999-00 NSS 55h Round (official) 30.9 31.2 31.1 23.6 27.1 26.1 1999-00 NSS 55th Round (corrected) 30.4 33.7 33.0 24.7 30.2 28.6 6. Human deprivation is an important aspect of poverty in UP. According to the 2001 Population Census, literacy increased from 42 percent in 1991 to 57 percent as of February, 2001, substantial progress but still well below the all-India average of 65 percent. And female literacy in the state, at 43 percent, is also below the all-India average of 54 percent. Although enrollments are rising, the children of the poor are still less likely to be attending school, even at the primary level, than the offspring of the better-off. By the end of the 1990s, only half the girls from the poorest 20 percent of the population were enrolled, as compared to 80-90 percent for girls from the wealthiest households.
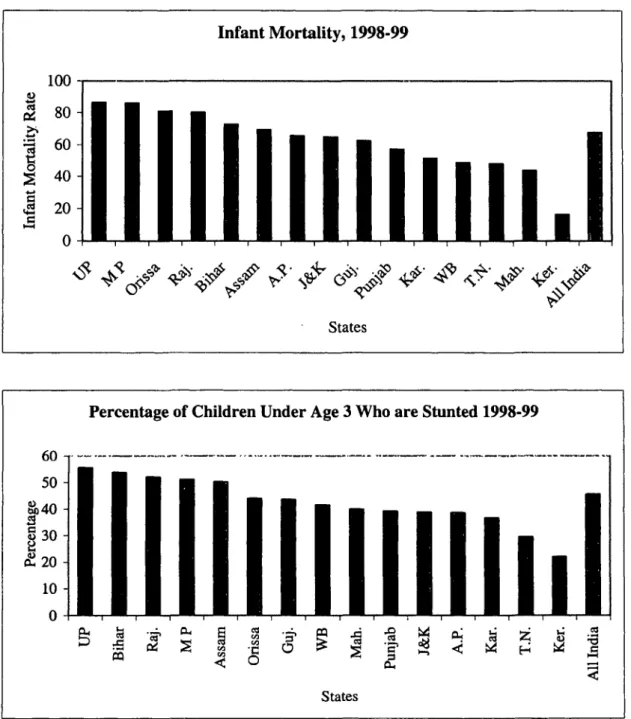
7. The people of Uttar Pradesh suffer from a high burden of disease. Maternal mortality is high at 707 deaths per 100,000 live births, compared to 408 in India as a whole. Children are particularly vulnerable: they are frequently malnourished - over half the children under three
years of age are significantly underweight - and less shielded against childhood diseases. Three out of ten youngsters have never been immunized, and the infant mortality rate in UP (85 per 1000 live births) is among the highest in India. Infant mortality is particularly high in households suffering from high levels of material deprivation.
8. Just as the reality of poverty goes beyond material deprivation, it also encompasses more than shortcomings in human development. Poor men and women -- in Uttar Pradesh as elsewhere -- are highly vulnerable. Often voiceless and powerless, they lack access to and influence over the institutions of the state. A small but important subset of poor people are truly destitute, and the fear of joining their ranks, from which there is often no escape, colors the thinking and actions of the poor and non-poor alike. Social identity matters as well - lower caste individuals and women face additional barriers that limit social and economic mobility.
3Deaton, A. 'Adjusted Indian Poverty Estimates for 1999-2000', Paper presented at the Planning Commission/World Bank Workshop on Poverty Measurement, Monitoring, and Evaluation, January 11/12h, 2001, New Delhi.
4Datt, G., V. Kozel, and M. Ravallion. 'A Model-based Approach to Projections of Poverty in India', Paper presented at the Planning Conrnission/World Bank Workshop on Poverty Measurement, Monitoring, and Evaluation, January 11/12, 2001, New Delhi.
Executive Summary iii
The Causes: Poverty of Resources, Access, and Relationships
9. Poverty is the result of low levels of assets, combined with low and uncertain returns. In combating poverty, the state will need to build purposefully on all its assets, those in public hands as well as those in the private sector, and not least the real and potential assets of the poor
themselves. The labor of the poor is concentrated in low-paid casual daily wage work; most own little or no land or productive assets. Poor people lack marketable skills and, in most cases, literacy; they suffer disproportionately from poor health and disability. Poverty is caused by a scarcity of private assets. Poor men and women are ill-equipped to take advantage of the opportunities provided by growth in the economy. In addition, public services often by-pass them. Infrastructure development, including provision for drinking and irrigation water, sanitation, electricity and public transport, is very low in UP in comparison with many Indian states, and access is most limited in backward regions, where many poor people live. Moreover, social services and anti-poverty programs do not perform effectively - in UP there is alsopoverty of access to public goods and services. Neither do the poor participate extensively in networks
of informal assistance and mutual support - they suffer frompoverty of social relations. For those with extensive social capital, (usually the better-off) these networks can open opportunities for investment or employment, and they can protect households against the economic shocks that may plunge the most vulnerable into destitution.
10. In addition to these causes, deprivation linked to gender and caste is a deeply rooted reality in the UP countryside, and any comprehensive effort to reduce poverty must confront that reality and its consequences. The realities are visible in the segregated hamlets where many of the lower castes live on the fringes of rural villages; often distant from community services - schools, health centers, public handpumps, and shops that distribute subsidized grains - in principle meant to assist poor families. The realities are as invisible as the girls who never enroll in school. Social inequities are reflected in inequities in the distribution of productive assets, such as land and education. Social inequities are also reflected in inequitable returns to assets:
lower-caste households not only own less; they also experience lower returns to the minimal stocks they do possess, including human capital. Deprivations linked to caste and gender create tensions in the society, and these tensions are exacerbated by low growth and limited
opportunities.
11. The poor in UP are highly heterogeneous, ranging from the truly destitute who have nothing and at best manage to survive, to households that are building assets and accumulating small surpluses, well on their way to climbing out of poverty. Many poor people are vulnerable;
they face the threat of further impoverishment and a slow slide into destitution. Differing forces limit economic opportunities among poor households, and the differences impact on future economic prospects as well as have direct bearing on policy and program design.
The Policy Challenges - Beginning with the Essential Role of the State
12. A government that works for poor men and women is a government that works for all citizens, rich and poor alike. The first and most fundamental challenge for reducing poverty in Uttar Pradesh is to improve the quality and effectiveness of the public sector.
13. The reasons behind UP's progressive deterioration in governance are fourfold: first, the administration has become increasingly politicized, which has eroded the stability of tenure and undercut managerial authority; second, administrative fragmentation has led to a proliferation of senior positions and undermined coordination and accountability in administration as well as policy-making; third, a related expansion in the size of the civil service, combined with weak
Iv Executive Summary
revenue generation, placed a squeeze on the capital budget as well as spending on operations and maintenance; and fourth, poor expenditure management practices have undermined the efficacy of public spending for combating poverty in the state. UP's continuing political instability, dating back to the mid-1980s, has contributed to the growing politicization and undermined the
effectiveness of the administration.
14. The burden of poor governance falls directly and indirectly on poor people. They are more vulnerable to predatory behavior on the part of government officials, particularly the police.
And resources intended for the poor are often diverted at the local level for the use of the wealthy and politically well-connected. One result is that poor households frequently lack access to basic services, and those that reach them are of inferior quality. Indirect impacts are equally
pernicious: poor men and women are confined to the sidelines in the state's political life; while they carry heavy weights in their daily lives, they carry little or no weight in the offices, agencies and assemblies where, without their active or informed consent, their lives are often shaped.
Many live in isolation and lack basic infornation about their rights and opportunities. Moreover, they lack the resources to vote with their feet and use private providers when unable to get the services to which they are entitled from the public sector.
15. The way forward is clear. UP needs to find better ways to empower its poorest citizens and bring them into decision-making at all levels. In addition to ensuring that the recently created Panchayati Raj Institutions (PlRs) include poor people fully as decision makers, JP needs to transforn its public sector so that the conduct of the police, the courts, and the bureaucracy in general is transparent and accountable to citizens at all levels. In addition, administrative and staffing reforms are needed within the civil service - to reduce fragmentation e.g. by streamnining and combining departments and sub-departments with similar functions, and to improve overall productivity and staffing and skills mix. Complementary reforms are needed at the sectoral level to improve regulation and service delivery in the areas that matter most for poor people - health, education, drinking water, and sanitation. As well, the efficiency of public spending must be improved, both by strengthening core expenditure management processes and developing ways to ensure that the state's public expenditure program is pro-poor. Budgets should be linked to performance, performance measured in terms of discernable improvements in the lives of poor men and women, not just the rich and powerful.
Broadening and Accelerating Economic Growth
16. A second challenge is to accelerate growth, the foundation stone of anti-poverty policies in Uttar Pradesh as well as worldwide. A dynamic economy, growing strongly, is a powerful force for creating new and better employment opportunities for poor people, enabling
empowerment, and reducing vulnerability. Poverty in the state has fallen during periods of rapid growth and stagnated in periods where growth has been slow.
17. Achieving faster growth will require substantial improvements in the investment climate for private sector led growth. In a recent survey of CEOs of major firms in India, the investrnent climate in UP was ranked 16t (just ahead of Bihar) out of a list of 17 major Indian states.
Inadequate infrastructure, a poorly skilled domestic work-force, weak governance, and a rigid regulatory environment have all combined to discourage the flow of new investment into many regions of Uttar Pradesh. The state has moved some way in recent years towards removing numerous regulations that curbed economic activity and impeded production and investment, liberalizing land purchase for industrial units, and introducing a single-window system for rapid clearances. Government orders have restricted discretionary inspections and streamlined the role of inspectors, reducing harassment of industrial and trade establishments. While many good laws
Executive Summary V
and measures have been passed or enacted, the main challenge ahead is to ensure further deregulation, and effective implementation in practice.
18. Where poverty is endemic in the countryside, as in Uttar Pradesh, accelerated growth in rural areas ranks as an important remedy. In UP' s still heavily agrarian economy (agriculture accounts for 42 percent of Gross State Domestic Product (GSDP) and 75 percent of total employment), a healthy agriculture sector is needed to power rural progress. Growth in
agriculture was uneven through the 1990s, averaging less than 2 percent per annum. The sector has suffered not just from policy distortions and from pervasive controls on commodity
marketing, policies that had pernicious effects throughout India, but also from a steady decline in levels and composition of investment in agriculture. As UP fiscal deficits rose through the latter half of the 1990s, not only did productive public spending for rural growth slow; but many of the remaining outlays took the form of inefficient subsidies for power, water, and fertilizer, in particular. Investments in roads and irrigation and in maintaining vital infrastructure suffered.
19. While rpany of today's poor remain heavily dependent on the land, the rural non-farm sector has an important and growing role in providing economic opportunities for poor men and women. These views came out strongly in field consultations and participatory studies. Non- agricultural incomes are highly valued by poor households because they increase incomes at the margin as well as minimize risk through diversification. Moreover, an expanding non-farm sector can help to reduce poverty even for those poor not directly employed off-farm by tightening village labor markets and raising wage rates for agriculture laborers.
20. There are three key areas where actions are needed to accelerate growth and reduce poverty in rural areas. First, there is a pressing need to remove bottlenecks in infrastructure and the supply of goods and services key to production. Critically needed is increased public support for research and extension, marketing activities, and infrastructure (particularly irrigation and roads). Given the current fiscal crisis, Government should focus on improving the quality and efficiency of infrastructure services through three channels: reallocation of expenditures (e.g. by reducing subsidies, particularly subsidies that accrue to the better off rather than the poor,
improving maintenance of roads and the canal irrigation system, and better research and
development); enhanced resource generation (e.g. through user fees for public irrigation, higher power tariffs, particularly in the agriculture sector, more effective metering, billing and collection of power tariffs, and better mobilization of private sector investment for marketing
infrastructure); and institutional reforms to support better and more equitable management and maintenance of local public assets (e.g. water users associations, transferring the maintenance of village roads to PRIs). Second, actions are also needed to improve the regulatory environment, by lifting controls on marketing of agriculture commodities and simplifying rules, regulations and licensing laws that work as obstacles to higher incomes for poor people. Although large scale land reforms have proven difficult in UP, reforms in the structure and regulation of the land market are needed to improve productivity and broaden the impact of agriculture growth. Third, a breakthrough is needed to ensure an adequate flow of credit to poor farmers and micro- entrepreneurs. As long as provision of credit to all sectors suffers due to the weak commercial orientation of the public banks that dominate India's financial system, the poor are particularly vulnerable, both directly and indirectly. High transaction costs along with the absence of suitable collateral means that poor people in UP are often unable to access credit from institutional
sources. Purely state-led efforts to provide financial services to the poor have not been successful, and new approaches should be sought.
21. Correcting gender bias in its multiple social, economic, and political forms can unleash another strong force for economic growth - the energy of women as farmers and as small-scale,
vi Executive Summary
rural entrepreneurs. On the economic front, the two most immediate areas for action concern legal rights and credit. Ensuring women's right to possess productive assets will enhance their security and economic potential. To do so, however, will require reversing both customary practice and the legislative framework that still function in many ways to deny women equal rights to assets, including land. Even where legal claims exist, women may find them
unenforceable. In addition, women, particularly poor women from lower castes, are subject to societal as well as domestic violence, and widows and widows and deserted women are particularly subject to various forms of discrimination not only in access to jobs but also in accessing basic services and safety nets.
Improving Quality and Access to Services
22. The quality of what government does or fails to do at the local level matters a great deal to the lives of poor men and women. The final challenge is to expand their human capabilities, through widening access to essential services - in particular education, health, social welfare programs and safety nets. The poverty-reducing impacts of reform-led growth are highly contingent on actions taken now to help poor people acquire the skills and education they need, provide better access to public goods and services, and remove barriers to using them.
Opportunities also carry risks; measures must be in place to reduce risk and protect the
vulnerable. The poor in UP have limited access to decent quality education and health services provided through the public sector; they are also ill-served by private providers. And there are pervasive failures in the outreach and impact of many of India's Anti-Poverty Programs (APPs) and safety nets.
23. Uttar Pradesh spends little on elementary education: spending rose from only 1.7 percent of GSDP in the early 1990s to 1.8 percent by the end of the decade. Better performing states spend more on a per-student basis: Himachal Pradesh spends almost twice as much as UP, Kerala spends half again as much, and Karnataka and Rajasthan spend 25 percent more on a per- student basis.
24. Of the urgent policy responses needed to upgrade educational performance in UP, the first is the need to spend more and spend better to achieve India's goal of education for all.
Enrollments and literacy improved in the 1990s but there Second, though, are improvements in physical, economic and social access for children from poor families and the socially excluded, many of whom live either in rural hamlets far from centrally located facilities or in unrecognized urban slums where no schools exist. Finally, while expanding access may bring children into school initially, policy-makers have to improve the quality of teaching and relevance of what is taught so that poor boys and girls not only enter school but also stay to learn the skills they need to compete successfully in India's rapidly changing job market. Poor parents must see - as many do not - that expected returns to education will be high enough to offset the opportunity cost of the child's lost labor (at home as well as in the market) as well as direct costs of schooling. Poor families in particular are less likely to be able to afford the books, school supplies and uniforms required for school attendance, and the public sector provides little in the way of financial support. Evidence from other countries has shown that scholarship programs (e.g. directed at girls and ethnic minorities) can be effective at raising school attendance. Addressing these many barriers also may help reduce the incidence of child labor, a serious problem in UP that the Government has sought to address with limited success.
25. Despite extensive coverage in the state of the District Primary Education Program (DPEP), and evidence that it has helped to increase public school enrollments and retention, Uttar Pradesh still has the highest rate of private school enrollments in India: one-quarter of all rural
Executive Summary vii
children enrolled at the primary level attend private (recognized and unrecognized) schools, as do 70 percent of urban children. And there is emerging evidence that private school enrollments are on the rise, even among poor households, reflecting lack of access and poor quality on the part of public providers. While the facts remain to be firmly established, they nonetheless raise concerns
about the efficacy of the public sector in meeting the education needs of poor children.
26. As with education, access to public health services and the quality of these services for the poor are constrained by inadequate resources inefficiently spent. The proportion of public resources UP currently comniits to health is low by both Indian and international standards.
Moreover, spending in the health sector tends to be regressive, with the exception of some services, such as immunizations and non-hospital outpatient care, that are pro-poor. Out of every 100 rupees spent in the public sector on curative health care services in UP, the poorest 20 percent of the population receive 10 rupees in health services while the richest 20 percent receive 41 rupees5.
27. Public facilities for primary health care are rarely utilized by poor people. One reason for this is the lack of adequate supplies of medicines and other medical necessities. Staff shortages, moreover, commnonly result in health centers and similar posts being unattended. Auxiliary Nurse Midwifes (ANMs), the health workers with the greatest outreach in the community, are seriously overburdened and lack promised back-up and support. Not only has funding of personnel costs been too low, but added resources are required to improve the capabilities and performance of public health practitioners now at work.
28. Like the education sector, many poor households use costly - and often ill-trained and ineffective - private health care providers. And like the education sector, this finding raises serious concerns about the role and efficacy of the public sector in providing basic services for UP's poor people
29. Reforms are needed to rejuvenate UP's health sector to better deliver core functions;
make better use of the private sector and improve standards of care; use public information more effectively to promote disease prevention and develop more informed health consumers; and focus the overall system to better serve the needs of the poorest and most vulnerable. Efforts are
underway in the state to develop and implement a strategy to achieve these much needed reforms;
early results are encouraging.
30. In order for safety net programs and pro-poor policies to be effective in protecting and enhancing livelihoods, they must be appropriately designed, easily accessible to those who need them, provide a reliable level of service, and make efficient use of scarce resources. Many of India's anti-poverty programs and social welfare schemes do not meet those standards. In addition to program-specific problems, the schemes have been weakened by a lack of political commitment as well as limited transparency and accountability. Accountability is further comnpromised by a lack of coordination between the many agencies involved in administering these programs. Targeting is poor, and the neediest are frequently bypassed. These programs are particularly ineffective in UP's least developed regions, where poverty is high and needs are greatest.
' National Family Health Survey (NFHS-1), 1992-93
Viii Executive Summary
The Way Forward
31. Accelerating growth, putting the delivery of social services to poor men and women on an efficient basis, empowering them as citizens and opening the public sector to public scrutiny
so that both corruption and nonfeasance can be identified and redressed - all these are formidable challenges. They would strain the resources and will of many developed societies. But they are not utopian goals. They are the prerequisites for steady progress, not just against poverty but toward widely and equitably shared well-being. The Government will have to harness its efforts and will to overcome all the separate but interlocking challenges enumerated above. It has an essential - and irreplaceable - role in achieving India's longstanding goal of poverty eradication.
The newly-elected Government now has an opportunity to accelerate growth and empower the poorest amongst its citizens through higher incomes, better education and health, and a stronger voice in the decisions that affect their lives.
Chapter I
POVERTY IN UTTAR PRADESH - THE CONTEXT
A. An Introduction
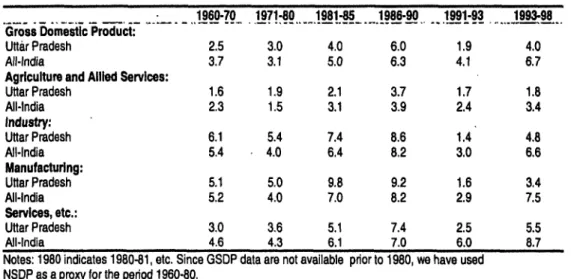
1.1 Rich in potential - in human and natural assets - Uttar Pradesh (UP) once appeared to be a pace- setter for the country's economic and social development. Most of the state's farm land is in the well- watered and naturally fertile Indo-Gangetic Plain, and the Western Region's tradition of raising wheat and sugarcane made it a strong platform for the Green Revolution in the 1960s and 1970s, which helped UP depart from previously low levels of agricultural growth. In the next decade, the Eastern and Central Regions of the state registered strong advances, spurred by purposeful investments in research, extension, irrigation and marketing infrastructure. As a result, in the 1970s, economic growth in most sectors in Uttar Pradesh was higher than that in the rest of India. Since then, however, economic growth started to fall behind that of India, particularly in the 1990s-as the state failed to seize the opportunities created by the liberalization of the economy started in 1991.
Table 1.1 Growth Trends In UP and All-India
1960-70 1971-80 1981-85 1986-90 1991-93 1993898 Gross iDomestic Product:
Uttar Pradesh 2.5 3.0 4.0 6.0 1.9 4.0
All-India 3.7 3.1 5.0 6.3 4.1 6.7
Agriculture and Allied Services:
Uttar Pradesh 1.6 1.9 2.1 3.7 1.7 1.8
All-India 2.3 1.5 3.1 3.9 2.4 3.4
Industry:
Uttar Pradesh 6.1 5.4 7.4 8.6 1.4 4.8
All-India 5.4 4.0 6.4 8.2 3.0 6.6
Manufacturing:
Uttar Pradesh 5.1 5.0 9.8 9.2 1.6 3.4
All-India 5.2 4.0 7.0 8.2 2.9 7.5
Services, etc.:
Uttar Pradesh 3.0 3.6 5.1 7.4 2.5 5.5
All-India 4.6 4.3 6.1 7.0 6.0 8.7
Notes: 1980 indicates 1980-81, etc. Since GSDP data are not available pror to 1980, we have used NSDP as a proxy for the perod 1960-80.
Source: Central Statistical Organization.
1.2 Reversing this loss of dynamism and the impact of that loss on the state's 60 million inhabitants (out of 175 million') who live in poverty is UP's most important challenge. Because of UP's size and level of poverty, meeting this challenge is of significance not only for UP but also for India, and indeed the world. An estimated 8 percent of the world's poor live in UP alone.2 This chapter reviews the nature and evolution of poverty in UP. It highlights the fact that while poverty in UP is not substantively different than poverty in the rest of India, it is however worse along many dimensions. After examining how UP's poverty reduction strategy compares with that of India, the chapter reviews definitional and measurement issues related to poverty. It also examines what the data reveal, and what they don't.
The statistics used throughout this paper deal with Uttar Pradesh as it was before October, 2000, when its Himalayan Region became the separate state of Uttaranchal.
2Based on an international poverty line of $1.08/person/day in 1993 PPP adjusted prices.
2 Chapter 1: Poverty in Uttar Pradesh - The Context
Growth has been slower in UP than the all-India average; nonetheless important progress appears to have been made in combating poverty in recent years. While these gains are noteworthy, it is important to keep in mind that there are substantial numbers of households clustered in and around the poverty line and relatively small improvements in their incomes may have a significant impact on the measured incidence of poverty. This also implies that many households still have welfare levels very near the poverty cut-off and remain vulnerable to short-term shocks that frequently plunge them back into poverty.
1.3 A profile of the poor in UP is presented in Chapter 2, which analyzes poverty along three critical dimensions - poverty of private resources, poverty of access to public goods and services, and poverty of social relationships. The chapter also discusses the role played by social identity - and in particular, gender and caste - in limiting or even barring opportunities to escape poverty. It also looks at child labor as a manifestation of the vulnerability of children to the economic and social conditions in which they have to grow and develop.
1.4 At the heart of UP's loss of economic momentum has been the loss of effectiveness of the state administration which has both led to an investment climate not supportive of private investment and growth, and to a poor performance in the delivery of social and infrastructure services essential for growth and poverty reduction. Chapter 3 reviews the reasons behind the loss of effectiveness of the state administration in carrying out its development functions. It starts with a review of the unstable nature of the state politics in recent decades, possible sociological driving forces, and how these may have contributed to weakening the foundations of the state administration and eroding its effectiveness in carrying out essential functions. Modernizing UP's state administration, reducing its politicization, making it more responsive and accountable to the population are essential for the state to restore its economic dynamism and reduce poverty-and the report examines options as to how this can be best
achieved.
1.5 Chapter 4 then turns to examine the economic environment in more detail. It examines the policies and constraints to UP' s economic growth-so vital for creating opportunities for the poor, enabling their empowerment, and reducing their vulnerability. The chapter briefly compares the
investment climate in UP with that of other states in India and explores reasons why UP ranks so low in India-mostly because serious infrastructure shortcomings and counterproductive regulations have reduced returns on private investment while poor governance has raised variability and uncertainty on such returns. It also examines factors behind the slowdown in growth in the agriculture sector, given its continuing important role in providing employment and income for the rural poor.
1.6 Chapter 5 ends the report by examining how well public services reach the poor. The quality of what government does or fails to do at the local level matters a great deal to the lives of the poor. In UP, the poor have limited access to good quality health and education services provided through the public sector; they are also ill-served by private providers. The chapter also documents pervasive failures in the outreach and impact of India's anti-poverty programs and safety nets. The chapter highlights various options for improving the delivery of basic services, building on the review of state administration in Chapter 3.
B. India's and UP's Poverty Reduction Strategies.
India's Strategy for Poverty Reduction: Growth with Social Justice and Equity
1.7 Poverty reduction has been a key concern of India's founding fathers, and poverty reduction has been addressed in successive five year plans since just after independence. India's current strategy for
Chapter 1: Poverty in Uttar Pradesh - The Context 3 poverty reduction is articulated in considerable detail in the Ninth Five Year Plan, which covers the period 1997 to 2002, and in the Mid-Term Appraisal completed in October 2000.
1.8 The overriding objective of India's poverty reduction strategy is growth with socil justice and equity. While projecting public and private investment requirements, the Plan gives greater priority, in a liberalized environment, to "planning for policy" and suggesting the major directions for policy reforms and interventions. Issues related to governance and institutions are also a theme of the strategy, which envisages greater local participation to improve the effectiveness of delivery mechanisms, and which emphasize the empowerment of women, the poor, and local communities. On the growth front, the Plan's
15-year long-term perspective targets an average annual growth rate of 7.4%, starting with 6.5% for the Ninth Plan period and increasing in successive Plan periods, with a view to reducing poverty to below
10% of the population over this period.
1.9 As articulated in the Ninth Plan, India's poverty reduction strategy envisages a two-pronged approach: (i) promoting faster growth by improving the investment climate and (ii) increasing the effectiveness of pro-poor interventions. Both require extensive reform at the state level, and the plan discusses these in considerable detail.
Investment Climate
1.10 Fiscal sustainability. The Plan documents note the precariousness of the current fiscal situation, and recommend corrective measures at both the central and state levels. Tax reforms focusing on base broadening and improving compliance are planned in order to halt the decline in the tax-to-GDP ratio.
Tighter expenditure controls are also important, especially in relation to the wage bill. Subsidies, both explicit subsidies at the central level, such as for food and fertilizers, and implicit at the state level, such as for power, higher education and irrigation, will need to be cut. At the same time, there is recognition of the need to increase the effectiveness of public spending and also recognition of how poor governance erodes the effectiveness of spending.
1.11 Governance. Improving the quality of governance is emerging as a key element of India's poverty reduction strategy. In his address to the National Development Council meeting held on February
19, 1999, the Prime Minister stated: "People often perceive the bureaucracy as an agent of exploitation rather than a provider of service. Corruption has become a low risk and high reward activity. Frequent and arbitrary transfers (of government officials) combined with limited tenures are harming the work ethics and lowering the morale of honest officers. While expecting discipline and diligence from the administration, the political executive should self-critically review its own performance. Unless we do this, we cannot regain credibility in the eyes of the people who have elected us to serve them."
1.12 As highlighted in the Plan, the bureaucracy is becoming increasingly subject to political
interference, a phenomenon most manifest in the shrinking average tenure attached to many government positions, especially at the state level. The judicial system is not functioning well: currently an estimated 25 million cases are pending in various courts. Tackling these, and related problems, will require reforms dealing with the civil service, the judicial system, anti-corruption strategies, etc., and the active
involvement of civil society. The Mid-Term Appraisal outlines a comprehensive strategy along these lines and highlights that "administrative and legal reforms should be an integral part of the reform agenda."
1.13 Domestic and external liberalization. Growth in India benefited greatly from the reduction of industrial investment licensing regulations. However, the business environment continues to be
unpredictable, discretionary and burdensome. The government strategy recognizes the importance of further domestic liberalization, including: (i) immediate abolition of small-scale reservations in critical