P olicy R eseaRch W oRking P aPeR 4777
Public Participation, Teacher Accountability, and School Outcomes
Findings from Baseline Surveys in Three Indian States
Priyanka Pandey Sangeeta Goyal Venkatesh Sundararaman
The World Bank South Asia Region
Human Development Department November 2008
WPS4777
Public Disclosure AuthorizedPublic Disclosure AuthorizedPublic Disclosure AuthorizedPublic Disclosure Authorized
Abstract
The Policy Research Working Paper Series disseminates the findings of work in progress to encourage the exchange of ideas about development issues. An objective of the series is to get the findings out quickly, even if the presentations are less than fully polished. The papers carry the names of the authors and should be cited accordingly. The findings, interpretations, and conclusions expressed in this paper are entirely those
Policy ReseaRch WoRking PaPeR 4777
This paper presents findings from baseline surveys on student learning achievement, teacher effort and community participation in three Indian states, Karnataka, Madhya Pradesh and Uttar Pradesh.
Results indicate low teacher attendance and poor student learning. Parents and school committees are neither aware of their oversight roles nor participating in school management. However, there is substantial heterogeneity in outcomes across states. Karnataka has better student and teacher outcomes as well as higher levels of community awareness and participation than the other two states. The authors find substantial variation in teacher effort within schools, but most observable
This paper—a product of the Human Development Department, South Asia Region—is part of a larger effort in the department to promote rigorous studies which can inform policy. Policy Research Working Papers are also posted on the Web at http://econ.worldbank.org. The author may be contacted at ppandey@worldbank.org.
teacher characteristics are not associated with teacher effort. One reason for low teacher effort may be lack of accountability. Regression analysis suggests low rates of teacher attendance are only part of the problem of low student achievement. The gains in test scores associated with higher rates of attendance and engagement in teaching are small in the states of Madhya Pradesh and Uttar Pradesh, suggesting teachers themselves may not be effective. Ineffective teaching may result from lack of accountability as well as poor professional development of teachers. Further research is needed to examine not only issues of accountability but also professional development of teachers.
Public Participation, Teacher Accountability, and School Outcomes:
Findings from Baseline Surveys in Three Indian States
Priyanka Pandey, Sangeeta Goyal and Venkatesh Sundararaman∗
∗South Asia Human Development, World Bank. This work benefited from generous financial support from the EPDF trust fund and by Government of the Netherlands through the BNPP program. We are also grateful to the Nike Foundation for generous financial support.
We thank Nazmul Chaudhury, Amit Dar, Lant Pritchett and Michelle Riboud for very helpful comments. We are grateful to the Ministry of Human Resource Development and the respective Departments of Education in Karnataka, Madhya Pradesh and Uttar Pradesh for extending their cooperation.
1. Introduction
In recent years, learning outcomes have gained increasing importance in the policy debate on basic education in India. Recent findings reveal that although about 93 percent of Indian children in age group 6-14 years are in school, learning achievements are low.
According to the ASER survey, 67 percent of children in grades 3 to 5 cannot read a simple text (ASER, 2005-2006). The NCERT (2006) baseline surveys across Indian states find average scores between 40 and 60 percent on curriculum based math and language tests. The problem of poor quality of outcome is not a problem of India alone or of education sector alone. A number of developing countries have a dismal record on the delivery of basic services like education, health and sanitation despite the fact that governments as well as donor agencies have channeled significant resources into these services (World Development Report, 2004).
Poor learning in schools may be, in part, due to high absence rates among teachers. A view that has gained consensus is that the mechanisms of accountability in public service delivery are often weak resulting in dysfunctional services. School teachers and health workers, among other public workers, have high rates of absenteeism in many countries. Chaudhury et. al. (2006) document provider absence in schools in several developing countries including India. Absence ranges from 11 to 27 percent among primary school teachers.
Interventions that provide physical resources alone are not enough to improve outcomes if workers delivering the service do not perform as expected. With the aim of increasing the accountability of public workers, various Indian states have decentralized control over local public services to local communities. The Sarva shiksha abhiyan which is a nation wide government scheme initiated in 2001 to universalize quality education envisages increasing accountability of schools to the community through greater involvement of village education committees and parent-teacher associations.
Nevertheless, high teacher absence rates recorded in recent studies confirm that teachers continue to have low levels of accountability and motivation.
The lack of accountability may be partly attributed to the fact that the communities are largely uninformed about the controls that have been devolved to them, as found in recent surveys. This study is designed to carry out a randomized evaluation of an information campaign that provided information to communities about their roles and responsibilities in school management. It covers three Indian states, Karnataka (KA), Madhya Pradesh (MP) and Uttar Pradesh (UP).
This paper presents findings from the study’s baseline surveys in 2006 on students’ learning achievement, teachers’ effort and community participation. The results from the impact evaluation of the information campaign are reported in a separate paper (Pandey et. al., 2008).
We present learning achievement in the context of the minimum level of learning
outlined by government of India. We report on the gain in achievement across grade
cohorts, the variation in achievement between schools and within schools, and the characteristics of schools and teachers that are associated with student performance.
Results indicate low teacher attendance and poor student learning. Parents and school committees are neither aware of their oversight roles nor participating in school management. However, there is substantial heterogeneity in outcomes across states.
Karnataka has better student and teacher outcomes as well as higher levels of community awareness than the other two states.
There is substantial variation in teacher effort within schools and many observable teacher characteristics are not related to teacher effort. However, regression analysis suggests low rates of teacher attendance are only part of the problem of low learning achievement. Higher teacher attendance may not be enough to increase learning substantially. Even when teachers are teaching, they are not effective in MP and UP. The gains in test scores associated with higher rates of attendance and engagement in teaching are small in these two states. Ineffective teaching can result from both lack of accountability and poor professional development of teachers. Research is needed to examine and evaluate teachers’ training and teaching processes inside the classroom.
Section 2 describes the context and background for the study. Section 3 describes the methodology and section 4 provides the results. Section 5 summarizes and discusses the key findings.
2. Background and Context for the Study
Since the mid 1990s, Indian states have decentralized control over local public services to the immediate communities. The 73
rdamendment to the Indian constitution in 1992 made it mandatory for Indian states to devolve control over public services and over funds for these services to the local government (called the gram panchayat
1). However it was left up to the states as to how much control to devolve. Various states in India have devolved control over services to different extents.
In parallel, another dimension of devolution has been that a number of Indian states trying to expand education rapidly have enacted policies to recruit contract teachers, often hired by local communities. These teachers are being hired at lower salaries and on more flexible, short-term contracts. These changes make it possible to hire larger numbers of teachers within a given fiscal envelope. In some cases, parents and community members participate in both their selection and performance monitoring (such as, attendance). This is intended also to increase teachers’ accountability to local communities. A brief description of the oversight devolved to the communities in the states is as follows.
1 A gram panchayat is the lowest administrative unit consisting of two to three revenue villages on average.
The elected village government (gram panchayat council with the gram pradhan as its head) is formed at the gram panchayat level.
In UP, a village education committee (VEC) is mandatory in every gram panchayat. There is one VEC for all the primary and junior government schools in the panchayat. The VEC typically has 5 members. It is headed by the gram pradhan (who is the elected head of the village government). Other members include the senior most head teacher among the schools, and three parents of children in these schools. The pradhan and the head teacher jointly operate the school account. The school account receives annual grants for repair and maintenance, school development, teaching learning material (TLM), money for school dress, money for civil works- school building, rooms, toilet, drinking water etc if authorized and contract teachers’ salary. The gram panchayat account which is cosigned by the VEC head receives scholarship funds and mid day meal funds. The VEC is supposed to manage and monitor funds coming to the school account and to the gram panchayat account (funds earmarked for the school), determine how to use and give consent for use of these funds, request additional funds if civil work etc are required, keep record of accounts, and be involved in selection of contract teachers (called shiksha mitra). An additional contract teacher can be hired if the pupil-teacher ratio in the school exceeds 40, up to a maximum of two contract teachers and up to a maximum ratio of 3:2 of regular to contract teachers. For selection of contract teachers, VECs are required to follow state guidelines outlining eligibility criterion (18-35 years of age, minimum education of class 12, preferably a resident of the gram panchayat
2, and if there are reservations by caste, gender) and are expected to rank applicants in order of qualification (grades obtained in class 12, 10). The contract is for a 10 month period and VEC decides whether to renew the contract to the next year. With a two-thirds majority, the VEC can remove the contract teacher anytime during this contract.
In MP, a parent teacher association (PTA) is mandatory in every school and parents of all children enrolled in the school are members. The PTA has an executive committee which runs the PTA, though all parents are supposed to participate in decision making. The school headmaster is the secretary of the PTA and a parent is the chair. The executive committee has up to 14 members who elect the PTA chair from among them.
The PTA chair and the head teacher jointly operate the school account. The school account receives annual grants for repair and maintenance, for school development, TLM, money for school dress, money for civil works- school building, rooms, toilet, drinking water etc and money for mid day meal. The PTA manages and monitors funds coming to the school accounts, determines how to use and gives consent for use of these funds, requests additional funds if civil work etc are required, keeps record of accounts, verifies or signs on all teachers attendance in order for their monthly salary to be released. The contract teachers (known as samvida shikshak) are hired on a 3 year renewable contract by the block panchayat. Applicants have to satisfy eligibility criteria (education, residence, reservation if any by caste, gender) and are expected to be selected according to qualification (grade attained in an exam for all applicants, grades obtained previously, and interview with the block panchayat). There are also former contract teachers (known as shiksha karmi) who have been made permanent recently, except that their salaries are much lower than that of regular civil service teachers. Regular teachers and shiksha karmis are no more being recruited.
2 If the VEC cannot find a suitably qualified candidate within the gram panchayat, then it can consider
In Karnataka, every school has a mandatory School development and monitoring committee (SDMC). The SDMC members include the head teacher of the primary school, elected members of the village government and parents of children. One of the parents is the chair of SDMC. The head teacher and SDMC chair jointly operate the school account. The types of funds received in the school account are similar to those in the case of MP. SDMC is supposed to call a meeting of all parents every 3 months to discuss trimester exam results. There are no contract teachers in Karnataka. The SDMC can inspect the schools and complain to the district or block education office.
Previous work suggests community members and members of local government do not often know about the state mandated controls they have over teachers and school accounts. A recent study in UP finds that VEC members are not informed of their roles and responsibilities and that VECs are not functional (Banerjee et. al., 2006). The baseline findings reported below also show that in MP and UP in particular, VEC or PTA members are unaware of their roles, meetings are rarely held and PTAs are involved neither in verification of teachers’ attendance nor in managing school accounts.
3. Methods
This is a cluster randomized controlled trial of 610 gram panchayats across the three states, randomly allocated to receive or not receive the information campaign. Cluster randomized sample size calculations were based on a 5 percent significance level and 80 percent power. In each state four districts were chosen purposefully, matched across states in terms of the literacy rate. Within a district, two blocks were randomly chosen. A block is an administrative unit between a district and a village. Within the two blocks, 25 villages were randomly chosen to be in the treatment group and another 25 randomly chosen to be in the control group. This gives a total of 100 control villages and 100 treatment villages per state in MP and UP. In Karnataka, an additional set of treatment villages were added that received a second treatment- information and advocacy campaign. The number of villages in each of the three cells in Karnataka (Control, Treatment 1 (information), Treatment 2 (information plus advocacy) is 70.
One randomly selected public primary school per gram panchayat was chosen to be in the sample. All teachers teaching grades 1 to 5 are included. In MP and UP, 45 randomly chosen students per school (15 each from grades 2-4) and in Karnataka 30 randomly chosen students per school (15 each from grades 4-5) are in the sample.
Timeline A baseline survey was administered between February-April 2006 in MP and UP and between August-September 2006 in Karnataka.
Outcome indicators in baseline surveys
In the baseline, four unannounced visits were made per school to collect information on
the following.
• Teacher attendance and activity. Activity is a measure of whether a teacher is actively engaged in teaching when the survey team arrives unannounced. Teacher attendance is 1 if teacher is present in school, 0 otherwise. Teacher activity is 1 if teacher is teaching, writing on the board, supervising written work, teaching by rote, 0 if teacher is absent, chatting, sitting idle/standing outside classroom, keeping order in classroom but not teaching, doing other non teaching work.
There are four observations per teacher on attendance and activity. Averaging across visits at the teacher level, these give the fraction of visits a teacher was present (or engaged in teaching). Averaging the attendance (or activity) at the school level across the four visits gives the average fraction of teachers present (or engaged in teaching activities) in a school over the visits.
• Test scores of sample students based on a competency and curriculum based language and math tests that lasted approximately 20 minutes per child. The language test was a test of reading and writing skills. The math test was a test of number recognition, addition, subtraction, multiplication and division. Tables 2 to 7 present grade wise details of test items and performance on each item. The total test score in each grade is constructed separately for language and math tests as the percent of correct answers. In MP and UP tests took place at the end of school year in 2006 while in Karnataka, these were held 4 months later at the beginning of school year in 2006. Students receiving the same test in Karnataka are 4 months ahead in the year and hence in the next grade. For example, the test given to grade 4 students at end of school year in MP and UP was given to class 5 students at beginning of school year in Karnataka. And the test given to grade 3 students at end of school year in MP and UP was given to class 4 students at beginning of school year in Karnataka.
• Interview of parents of sample students on their knowledge about existence of school committees.
• Interview of VEC, PTA and SDMC members on participation in school oversight, knowledge of roles and responsibilities and knowledge about school funds.
• School facilities survey.
Additional data were collected on socio-economic characteristics of students such as parents’ education, caste, and wealth and on characteristics of teachers such as age, education, experience, wealth, type of contract and training.
4. Results from Baseline Surveys
Table 1 presents a summary of the sample variables including learning outcomes and teacher effort. Karnataka stands out in comparison to MP and UP in that it has substantially higher learning levels, higher teacher effort, greater community awareness and participation (the latter is reported in later tables).
4.1 Learning Achievement
What is the benchmark? We use the minimum level of learning (MLL) framework
given grade should know. The competencies tested for each grade in the survey fall either within or below the set of competencies listed by the MLL for the grade. As an example, the MLL for language specifies that a child in grade 1 should be able to read simple sentences and write simple 3 syllable words. A child in grade 2 should be able to read short paragraphs as well as write dictated sentences. In Math, a child in grade 2 should recognize numbers up to 100, should be able to do two digit additions with carryover and subtractions with borrowing. According to the framework, at least 80 percent of children are expected to be able to do at least 80 percent of the competencies for the grade. The fram.
Total score Figures 1 and 2 present the percent correct score in the three states. Given our MLL benchmark, learning achievement as measured by the percent correct responses is low in all three grades in MP and UP and relatively higher in Karnataka. In grade 4, the mean percent correct score in mathematics is 23 for UP, 29 for MP and 69 for Karnataka (denoted by KA in figures and tables). The mean percent correct score in language for grade 4 is 27 for UP, 33 for MP and 75 for Karnataka.
Figure 1 Mean score in mathematics
0 0.2 0.4 0.6 0.8 1
Class 4 (class 5- KA)
Class 3 (class 4- KA)
Class 2
Percent score
UP MP KA
Figure 2 Mean score in language
0 0.2 0.4 0.6 0.8 1
Class 4 (class 5- KA)
Class 3 (class 4- KA)
Class 2 Percent score- reading and writing
UP MP KA
Item wise performance Tables 2-7 present item wise performance of children in
language and math in grades 4-2 for MP and UP at end of school year and in grades 4-5
in language and math for Karnataka at beginning of school year.
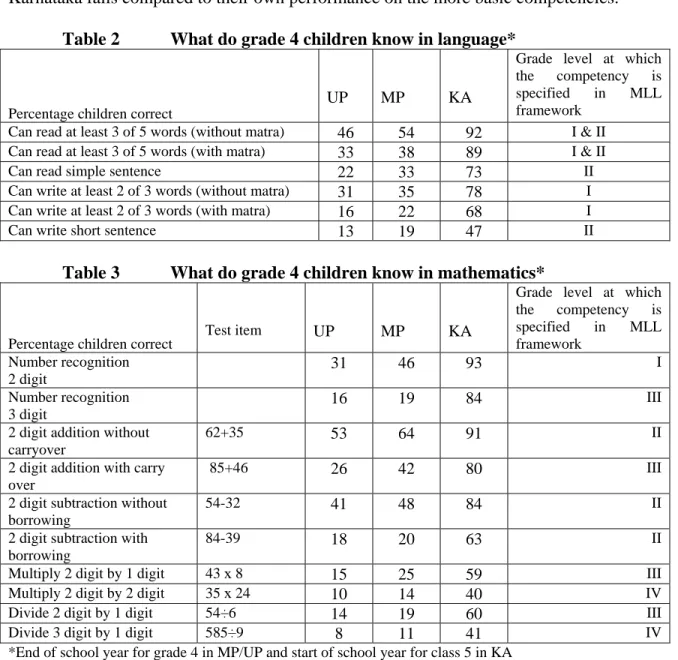
There are two key points that come out of these tables. First, on extremely basic competencies such as recognizing words on the language test and recognizing numbers or solving addition or subtraction on the math test, the sample of children in MP and UP perform dismally and children in Karnataka do way better. In UP, only 46 percent of children after four years of schooling can read 3 or more words from a list of five. And barely 22 percent in UP and 33 percent in MP at the end of grade 4 can read a simple sentence compared to 73 percent in Karnataka.
The percent of children answering correct is much higher in Karnataka compared item wise to MP and UP. However, as one goes to the slightly higher level competencies such as writing a sentence or solving a division problem, the performance of children in Karnataka falls compared to their own performance on the more basic competencies.
Table 2 What do grade 4 children know in language*
Percentage children correct
UP MP KA
Grade level at which the competency is specified in MLL framework
Can read at least 3 of 5 words (without matra) 46 54 92 I & II Can read at least 3 of 5 words (with matra) 33 38 89 I & II Can read simple sentence 22 33 73 II Can write at least 2 of 3 words (without matra) 31 35 78 I Can write at least 2 of 3 words (with matra) 16 22 68 I Can write short sentence 13 19 47 II
Table 3 What do grade 4 children know in mathematics*
Percentage children correct Test item UP MP KA
Grade level at which the competency is specified in MLL framework
Number recognition 2 digit
31 46 93 I Number recognition
3 digit
16 19 84 III 2 digit addition without
carryover
62+35 53 64 91 II
2 digit addition with carry over
85+46 26 42 80 III
2 digit subtraction without borrowing
54-32 41 48 84 II
2 digit subtraction with borrowing
84-39 18 20 63 II
Multiply 2 digit by 1 digit 43 х 8 15 25 59 III Multiply 2 digit by 2 digit 35 х 24 10 14 40 IV Divide 2 digit by 1 digit 54÷6 14 19 60 III Divide 3 digit by 1 digit 585÷9 8 11 41 IV
*End of school year for grade 4 in MP/UP and start of school year for class 5 in KA
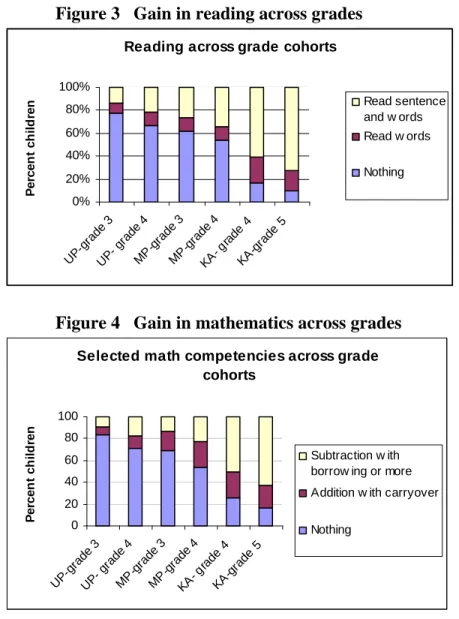
Second as figures 3-4 and tables 2-7 show, the gain across grade cohorts on any given competency is small for MP and UP. In UP, 15 percent of children in grade 3 can do addition with carryover compared to 26 percent of children in grade 4. In MP, the percentages of children who can do subtraction with borrowing are 11 percent in grade 3 and 20 percent in grade 4. The gain in Karnataka also seems small on a given competency, although what’s going on in Karnataka may be different. A large fraction of the sample children in Karnataka know the tested competencies (which are fairly basic for the grades) and so there may not be much room for an improvement.
Figure 3 Gain in reading across grades
Reading across grade cohorts
0%
20%
40%
60%
80%
100%
UP-grade 3
UP - gr
ade 4 MP
-grade 3 MP-grade
4
KA - grade
4
KA -grade
5
Percent children
Read sentence and w ords Read w ords Nothing
Figure 4 Gain in mathematics across grades
Selected math competencies across grade cohorts
0 20 40 60 80 100
UP -grade
3
UP- grade 4 MP-grade 3
MP-grade 4
KA - gr
ade 4
KA -grade
5
Percent children
Subtraction w ith borrow ing or more Addition w ith carryover Nothing
The gain in performance across grade cohorts is similar across competencies,
although somewhat smaller for the higher level competencies. If the sample of children
is similar across grades, these gains will be close to the actual learning gains on the
concepts tested as a child progresses through grades. This then presents a fairly stark
picture that despite the approximate 220 days of schooling that children are supposed to
receive in a year of school, the learning that is taking place is not much at all in MP and
UP where as many as 75-86 percent of children at the end of grade 3 cannot read a simple sentence and this percentage continues to be 67-78 for children at the end of grade 4.
4.2 Learning Decomposition
4.2.1 Are Observed Student and Family Characteristics Correlated with Performance?
Table 8 presents results from grade wise linear regression with school fixed effects, where the dependent variable is the percent correct score on language and math tests, respectively. School fixed effects will control for observed and unobserved characteristics of the school and the village that are correlated with learning achievement.
Student characteristics on the right hand side are age, gender, caste, education of parents and whether family’s own land is above the sample median.
The regression equation is as follows for student i in school/village j in block k.
Y
ijkis the test score (the percent correct score) in language or math. X
ijkis a vector of student i’s observed characteristics: age, gender, caste (two dummy variables for whether student belongs to general caste, other backward classes (OBC) or scheduled caste (SC)), whether mother is literate, whether father is literate, whether land owned by the household is above median land owned. f
jkis the vector of school fixed effects. ε
ijkis the error term representing the unobserved variables correlated with test scores.
Y
ijk= a + bX
ijk+ f
jk+ ε
ijkA number of the observed student characteristics in UP, a few of these in MP and
almost none in Karnataka are significantly correlated with test scores. In UP, student’s
age, gender, caste, parents’ education and family wealth are all significant and sizeable in
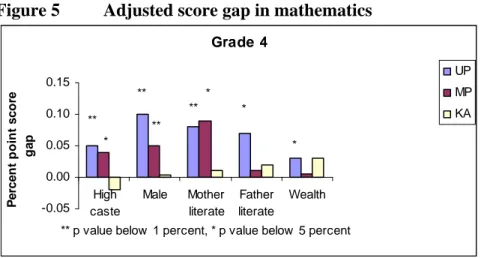
magnitude in the test score regressions (Table 8 and figures 5-6). Boys score 6
percentage points higher than girls. Students’ belonging to high caste (i.e. general caste
which is neither OBC nor SC/ST) have 5-8 percentage points higher score and those with
above median wealth have 3-4 percentage points higher score. Students’ with a literate
mother have an 8-10 percentage points higher score and those with a literate father have a
7-8 percentage point higher score.
Figure 5 Adjusted score gap in mathematics
Grade 4
-0.05 0.00 0.05 0.10 0.15
High caste
Male Mother literate
Father literate
Wealth
** p value below 1 percent, * p value below 5 percent Percent point score gap
UP MP
** KA
*
**
**
**
*
*
*
In MP, students’ gender, caste and mother’s education are significant variables in the test score regressions (Table 8 and figures 5-6). An increase of one year in age decreases language score by 2 percentage points but not so in math where the age variable is insignificant. This may reflect the fact that a number of students in the sample districts of MP migrate temporarily every year with their parents for employment. Boys do better, scoring 5 percentage points higher than girls. Students from high caste (i.e.
who are neither OBC nor SC/ST) have 4 percentage points higher score in math and ST students have a 7 percentage point lower score in language. Wealth variable is insignificant and so is father’s literacy. Those with a literate mother have 9-12 percent point higher score.
Figure 6 Adjusted score gap in language
Grade 4
-0.05 0.00 0.05 0.10 0.15
High caste
Male Mother literate
Father literate
Wealth
** p value below 1 percent, * p value below 5 percent
Percent point score gap
UP MP KA
**
**
**
*
**
**
*
In contrast, in Karnataka none of the observed student characteristics are
significantly correlated with test scores. This may suggest that when schools are good,
learning in school makes up for some of the household differences in learning and when
students are not learning in school, family factors continue to matter more for learning
outcomes. Results are generally similar for grades 3 and 2.
4.2.2 Which of the School and Teacher Characteristics Are Correlated with Performance?
Here we examine the correlation between school characteristics and test scores. Test score is regressed on observed student characteristics, school characteristics and block fixed effects. The regression equation is as follows where Y
ijkis the test score of student i in school/village j in block k:
Y
ijk= a + bX
ijk+ cZ
ijk+ f
k+ ε
ijkX
ijkis a vector of observed student characteristics (age, gender, caste, mother’s and father’s literacy, wealth), Z
ijkis a vector of observed school and teacher characteristics.
Since multi grade teaching seems to be widespread in the sample schools, it is difficult to identify a teacher to a class. Therefore, average teacher characteristics for the school are used on the right hand side. Z
ijkconsists of teacher-pupil ratio, index of school infrastructure, percentage of teachers with college degree, percentage of teachers with graduate degree, percentage of teachers with pre service training, percentage of male teachers, percentage of general caste teachers, mean age of teachers, mean years of experience, mean days of in service training in last school year, mean teacher attendance, mean teacher activity (see Table 1 for definition of these variables) and percentage of contract teachers. f
kare block dummy variables which control for block fixed effects and ε
ijkis the error term. Tables 9-12 present the results from these regressions.
In UP, teacher-pupil ratio is positively and significantly correlated with language and math test scores in all grades (Tables 9-10). An extra teacher is associated with 3 percentage point increase in scores. Teacher activity is positively and significantly correlated with language and math test scores in all grades. If 80 percent of the teachers were to become actively engaged in teaching, language and math scores would be higher by 7 and 8 percentage points respectively. Controlling for activity, teachers’ attendance is not significant in most regressions. Other characteristics of the school and teachers including teacher training are insignificant.
In MP, teacher activity is positively and significantly correlated with language and math test scores in all grades (Tables 11-12). If the percentage of teachers actively engaged in teaching increased by about 30 percentage points (the average percent of teachers actively engaged is 30 percent), the increase in grade 4 scores would be about 6 and 5 percentage points in language and math, in that order. The gains in grades 3 and 2 scores from a similar increase in teacher activity would be slightly higher. Most other characteristics of the school including teacher-pupil ratio and in service training are not significantly associated with test scores. Multi grade teaching is negatively correlated with scores in grades 3 and 2.
In Karnataka, teacher attendance is the only variable significantly correlated with
both language and math test scores in all grades (Table 13). Other school characteristics,
including teacher pupil ratio and teacher activity are not correlated with scores.
The one school characteristic that is consistently and significantly correlated with learning achievement is teacher engagement in teaching in MP and UP and teacher presence in Karnataka. In all three states, most other school or teacher characteristics are not associated with test scores. In Karnataka 88 percent of teachers are present and of those present, almost 80 percent are actively engaged in teaching. Since most teachers who are present are teaching, this may explain why teacher attendance is significant in the score regressions and not teacher activity.
Based on the regression coefficients, we calculate that if about half the teachers were engaged in teaching in MP and UP i.e., teaching activity roughly doubled in magnitude, scores would be higher by 17-31 percent in math and language in the three grades. We would have expected an increase in teacher activity of this proportion to be associated with a bigger increase in score. One reason for a small effect is that teacher activity may not measure real teacher effort precisely. Another reason is that teachers may not be effective in classrooms in MP and UP. For example, if average teacher attendance and engagement in teaching in MP and UP were to be the same as in Karnataka and assuming all other factors influencing learning stayed constant, the average scores in grade 4 in MP and UP would still be below 40 percent, far from the average of 70-75 percent in Karnataka.
Although we have reported test score correlations (not causations) based on a cross section survey, our findings are consistent with international evidence on the impact of school and teacher characteristics on student test scores. A number of studies find no conclusive impact of class size on student performance (Hanushek, 1998; Lazear, 1999) consistent with our results from MP and KA. There is evidence however that the impact of policies on class size may depend on the level of education concerned and the absolute level of class sizes. Class size may matter when the average size is quite large, as in UP schools which have average class size of 70.
On the other hand, there is fairly robust evidence that of the school level variables which can be influenced by policy, factors to do with teachers and teaching are the most important influences on student learning. The broad consensus is that teacher quality is the single most important school variable influencing student learning (Darling- Hammond, 2000; Rockoff, 2004; Rivkin, Hanushek and Kain, 2005). But what it is about teachers that matters is less well known. Researchers agree that many important aspects of teacher quality are not captured by the commonly used quality indicators such as education, experience, and subject matter knowledge. Two recent studies find that teacher attendance has a positive impact on test scores (Duflo, Hanna and Ryan 2007; Miller, Murnane and Willet, 2007). Broadly parallel to these findings, our results show that teacher effort is positively correlated with student performance, unlike other attributes of schools or teachers including education and experience that have no correlation.
4.2.3 How Much of the Variation in Test Scores Is between and within Schools?
Regressing scores on school fixed effects gives the variation in scores attributable to
variation in observed and unobserved characteristics across schools and villages. The
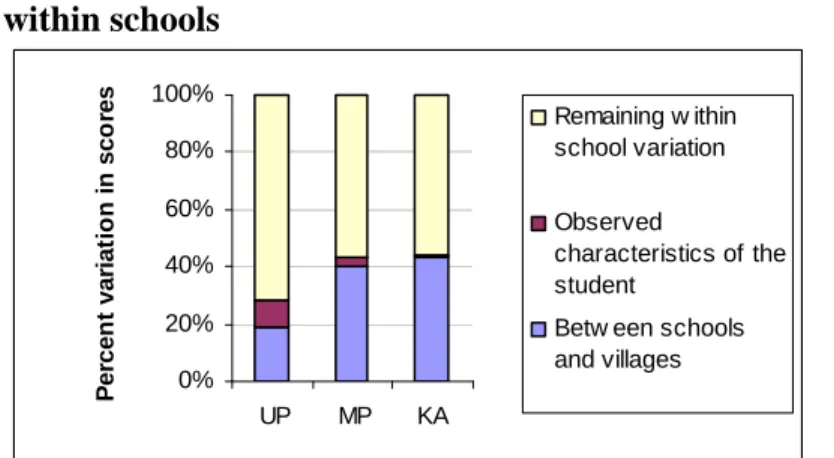
remaining variation is attributable to variation in within school characteristics. Schools and villages explain up to 20 percent of the variation in mathematics and language scores in grade 4 in UP, 40 percent in MP and 43 percent in Karnataka (Figure 7). This means a fairly large percent of the variation is within schools, larger in UP (about 72 percent) and smaller in KA (56 percent).
3This finding is quite consistent with international evidence, although from developed countries, that the largest source of variation in student learning is attributable to what students bring to school (Rivkin, Hanushek and Kain, 2005; OECD report, 2005).
The difference in the extent of within school variation across the states is in line with the finding above (in 4.2.1) that many observed student characteristics in UP, a few in MP and almost none in KA are significant in explaining the test scores.
Figure 7 Decomposing variations in grade 4 mathematics score between and within schools
0%
20%
40%
60%
80%
100%
UP MP KA
Percent variation in scores
Remaining w ithin school variation Observed
characteristics of the student
Betw een schools and villages
The within school variation in achievement is attributable to differences in students, classrooms characteristics, within school variation in teacher quality and unexplained variation in the data. However, observed family and student characteristics explain little of the variation in scores within schools. When the full set of observed student covariates are added to the test scores regression with school fixed effects, the explanatory power of the score regression goes up by 9 percent in UP, 3 percent in MP and a mere 1 percent in KA. This means that the observed dimensions of family background do not explain much of the variation in performance within schools but the unobserved dimensions such as motivation, ability and attitude possibly do.
4.3 Teacher Effort
Since teacher effort is correlated with student performance unlike other attributes of the school, we look at the data to see which teachers work harder than others. While the data cannot shed light on why teacher effort varies across states or why some teachers are more motivated than others, it captures the variation in teacher effort due to observed characteristics of teachers which are commonly used by policymakers and school administrators as indicators of teacher quality.
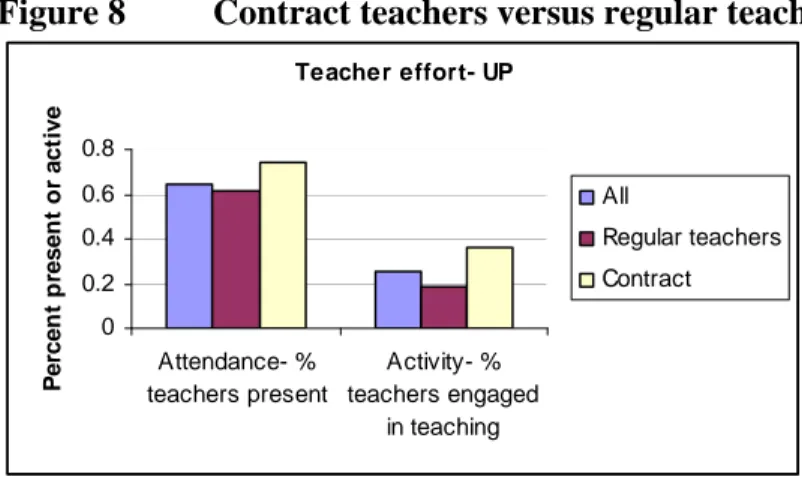
Teacher attendance and engagement in teaching are low in both MP and UP and much higher in Karnataka. On average, 88 percent of teachers were present in KA, 65 percent in UP and 67 percent in MP. The average fraction of teachers present and actively engaged in teaching was 68 percent in KA, 25 percent in UP and 30 per cent in MP. In all the states, a high proportion of teachers are male and from the high caste.
More than 50 percent of the teachers have a college education in MP and UP unlike Karnataka where 72 percent of the teachers have a grade 12 degree or less (Table 1).
Do we observe any variation in teacher effort by terms of appointment? Both MP and UP have a cadre of contract teachers. Contract teachers (called shiksha mitra in UP and samvida shikshak in MP) have significantly higher attendance and activity compared to regular teachers (Figures 8-9, Table 14).
Figure 8 Contract teachers versus regular teachers in UP
Teacher effort- UP
0 0.2 0.4 0.6 0.8
Attendance- % teachers present
Activity- % teachers engaged
in teaching
Percent present or active
All
Regular teachers Contract
Figure 9 Contract teachers versus regular teachers in MP
Teacher effort- MP
0 0.2 0.4 0.6 0.8
Attendance- % teachers present
Activity- % teachers engaged
in teaching
Percent present or active
All
Regular teachers Contract Former contract - shiksha karmi
Contract teachers, however, differ from regular teachers on a number of
characteristics- they tend to be younger, more educated, a greater fraction female, with
fewer years of experience and much less likely to have received any pre service training
(Table 15). These differences in attendance and activity remain significant after
controlling for observed teacher characteristics and school fixed effects (Tables 16-17).
4.3.1 What Are the Correlates of Teacher Presence and Engagement at Work?
To examine which teacher attributes are associated with teacher effort, we regress teacher attendance and activity on teacher characteristics and school fixed effects. The regression equations are below. Teacher attendance
ijkis a dummy variable which is 1 if teacher i in school/village j in block k was present on a given visit, 0 otherwise. Since there were four visits, there are four observations per teacher. Teacher activity
ijkis a dummy variable which is 1 if teacher i in school/village j in block k was present and actively engaged in teaching, 0 if the teacher is absent or engaged in non-teaching task (see bottom of table 1 for definition of activity). X
ijkis a vector of teacher characteristics that includes age, gender, caste, education, whether teacher has pre service training, number of years of service, number of days of in service training in last school year, whether teacher’s appointment is on a contract basis. f
jkis a vector of school fixed effects.
Teacher attendance
ijk= a + bX
ijk+ f
jk+ ε
ijkTeacher activity
ijk= a + bX
ijk+ f
jk+ ε
ijkTables 16-18 present the regression results. In UP, teachers more likely to be present are contract teachers, those without a college degree and those without a graduate degree. Teachers more likely to be engaged in teaching are contract teachers, those without a college or a graduate degree, younger and female teachers. Contract teachers’
attendance is higher by 10 percentage points and activity is higher by 7 percent points compared to regular teachers. Both these differences are significant at p values below 5 percent. Pre-service and in service trainings are not significant in the regressions (Table 16).
In MP, teachers more likely to be present are younger in age. Teachers more likely to be active are contract teachers, younger, without a college degree and with fewer years of experience. Pre service and in service trainings are not significantly associated with teacher effort (Table 17). Contract teachers’ attendance is not significantly different but their activity is 10 percentage points higher compared to regular teachers with p value below 5 percent.
In Karnataka, female teachers are more likely to be present. Teachers more likely to be actively engaged in teaching are female, older and those with a college degree.
Those with a post graduate degree are less likely to be engaged in teaching compared to those with a high school degree (Table 18).
There are three main themes here. The first is that teachers who are more
qualified in terms of measurable characteristics, for example those with more education
or experience, are likely to put in less effort compared to the teachers who appear to be
less qualified. This could have to do with the more qualified teachers having an elite
status in the local community. The second theme is that most of the variation in teacher
effort is within schools. The percentage of variation in teacher activity that is explained
by differences between schools and villages is 21 in MP, 17 in UP and 13 in KA. The third point is that in all of the states observed teacher characteristics explain less than 6 percent of the variation in teacher effort within schools. These observations are again consistent with other studies, although mainly from developed countries, that find substantial variation in teacher quality within schools and observed teacher characteristics explain very little of this variation in teacher quality (Rockoff, 2004; Rivkin, Hanushek and Kain, 2005; Aaroson, Barrow and Sander; 2007).
4.4 Are Local Communities Aware of Their Roles and Active in Managing Schools?
Last we discuss an important strand of the survey that measures local participation in school management. In line with the variation in teacher effort, there is a parallel variation in community participation across the three states.
4.4.1 The Committees with Oversight Responsibilities
Tables 19-24 present the awareness and participation of VEC, PTA and SDMC members in oversight of the school. A large proportion of committee members in all the three states stated not having received any training regarding their roles and responsibilities as members. Parent members of these committees had the lowest yes responses. About 20 percent of parent members reported receiving any training in Karnataka, compared to 8 percent in MP and 2 percent in UP.
In UP, most members seem to be aware that they are members of the VEC.
However headmasters seem to be most informed about the roles and responsibilities of the VEC. Parent members of the VEC seem to be the least informed and participating the least (Tables 19-20). When asked to list the roles and responsibilities of VEC, 52 percent of the parent members could not list a single one. These members could name on average only one out of five VEC members.
Figure 10 UP Village Education committee members’ responses
0 20 40 60 80 100
Whether received training
Percent of other VEC members
named
Whether VEC meeting held in this school year
Percent Headmaster
Pradhan Parents
Like in UP, headmasters in MP seem to be most informed of the roles and
responsibilities of the PTA (Tables 21-22). Parents seem to be the least informed of their
roles and participating the least. 58 percent of parent members of the PTA executive committee could not list a single role or responsibility. Parent members could name, on average, one out of ten members of the PTA.
Figure 11 MP PTA committee members’ responses
0 20 40 60 80 100 120
Whether received training
Percent of other PTA excecutive members named
Whether PTA meeting held in this school year
Percent Headmaster
PTA Chair Parents
Parent members of the SDMCs in Karnataka seem to be more informed about their roles and report participating in meetings and school inspections much more relative to their counterparts in MP and UP (Tables 23-24). Parent SDMC members could correctly name on average 4 out of 10 committee members (Figure 12 and Table 23).
Figure 12 KA SDMC members’ responses
0 20 40 60 80 100
Whether received training
Percent of other SDMC
members named
Whether SDMC meeting held in this school year
Percent Headmaster
SDMC chair
Parent/other members
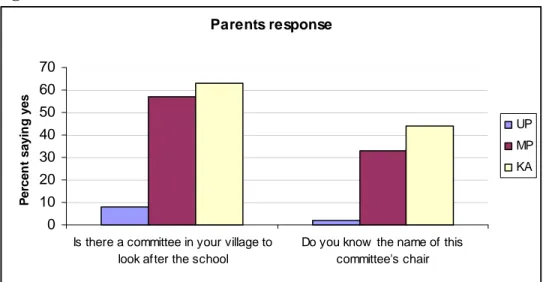
4.4.2 Are Parents Aware of the School Oversight Committees?
In UP only 8 percent of the parents interviewed were aware of the VEC. On the other
hand in MP and Karnataka, 57 percent and 63 percent of the parents were aware of the
respective committees. Parents were also asked if they could name the chair of the VEC,
PTA or SDMC. The percentage of parents able to name the committee chair is highest in
Karnataka, followed by MP and UP, where barely 2 percent of parents responded
Figure 13 Parents awareness of school committees
Parents response
0 10 20 30 40 50 60 70
Is there a committee in your village to look after the school
Do you know the name of this committee's chair
Percent saying yes
UP MP KA
5. Summary
Learning achievements differ substantially across states, low in both MP and UP and higher in Karnataka. On every single item, the percent of children answering correct is much higher in Karnataka compared to MP and UP. However in Karnataka as in the other two states, as we go to the slightly higher competencies such as writing a sentence or solving a division problem, students perform worse compared to their own performance on the more basic competencies.
More importantly, performance gains across grade cohorts are low on all competencies. The competencies tested fall within the set of competencies identified in the minimum levels of learning (MLL) framework recognized by the government of India. The norm of about 220 days of an additional school year is associated with an increase of 8-10 percentage points in the percent of children who can read or write simple text or solve basic math. To put it differently, if the goal is that every child should master at least the grade appropriate MLL competencies, then going from grade 3 to 4 in UP, 220 additional days of learning should lead to an increase in percent of children who can read simple text by 86 percentage points (since only 14 percent of grade 3 children can read). The actual gain from grade 3 to 4 in the data is only 8 percent points. This is 9 percent of the gain that should be taking place or equivalently worth only 20 additional school days.
Mirroring the differences in scores across states are systemic differences across
states in teacher attendance and in the fraction of teachers who were observed to be
engaged in teaching related activity. Karnataka has a much higher fraction of teachers
present and engaged in teaching compared to MP and UP. In regressions of student test
scores on school level variables, most physical inputs in the school are not correlated
with scores in all three states whereas teacher engagement in teaching in MP and UP and
teacher attendance in Karnataka are significantly and consistently associated with higher
scores. However there is substantial variation in teacher effort within schools and many
observable teacher characteristics are not related to teacher effort. This implies policies
that reward teachers on the basis of their credentials may not be effective in raising teacher effort.
One reason for low teacher effort in MP and UP may be low accountability of teachers in these states. Teachers may not be accountable and motivated in part because the communities do not have the capacity to hold them accountable. A large proportion of committee members in all three states had not received any training regarding their roles and responsibilities. Parent members of VEC and PTA are not actively participating in their oversight capacity and have very low levels of awareness regarding their roles and responsibilities. The headmasters seem to be executing most of the functions of VECs and PTAs. The communities at large are not aware of the existence of these committees.
Whereas in Karnataka data show that even though only 20 percent of parent SDMC members stated receiving any training, they are aware and participating to a much greater extent compared to their counterparts in the other two states. SDMC members report more frequent committee meetings and school visits as well as greater knowledge of their oversight roles. The evaluation of the experiment undertaken as part of this study will provide some evidence on how much increase occurs in teacher effort when communities are better informed of their oversight roles.
However, low rates of teacher attendance and teaching activity are only part of the problem of low learning achievement. Even if the level of average teacher attendance and engagement in teaching in MP and UP were to be the same as in Karnataka or even if 100 percent of the teachers were present and engaged in teaching and assuming all other factors influencing learning stayed the same, the associated gain in language or math scores in the two states would be in the range of 10-11 percentage points based on the regression results in the paper. This is roughly the size of gain in performance across grade cohorts observed in the data. It would still keep the average scores 30-40 percentage points below Karnataka which leaves a large fraction of the children without any mastery of basic competencies.
What is going on in classrooms when teachers are present and teaching is obviously quite important. Although our data cannot shed light on any differences in the classroom processes across states, it does suggest that teachers in MP and UP may not be as effective. This could be related to issues of accountability as well as teachers’
professional development. Classroom processes and teacher training need to be
researched. Experimental evaluations of innovations in these areas would be helpful in
answering what works towards classrooms that actually deliver learning.
Table 1 Summary of key variables UP
Mean Std. Dev.
MP
Mean Std. Dev.
KA
Mean Std. Dev.
Mean Student variables
% Correct score
Grade 4- Math (class 5 for KA)
.23 .29 .29 .29 .69 .28
Grade 4- language (class 5 for KA) .27 .35 .33 .34 .75 .29 Grade 3- Math (grade 4 for KA) .17 .28 .26 .30 .67 .31 Grade 3- language (grade 4 for KA) .21 .32 .30 .35 .68 .31 Grade 2- Math .13 .26 .25 .31 -
Grade 2- language .20 .29 .31 .33 -
Age 8.72 1.61 8.95 1.57 10.08 .82
Gender (1 if male) .49 .50 .51 .50 .52 .50
General caste (neither SC/ST, nor OBC)
.15 .36 .20 .40 .04 .19
OBC .40 .49 .31 .46 .51 .5
SC .44 .50 .15 .36 .33 .47
ST - - .34 .47 .13 .34
Mother literate .21 .40 .13 .33 .37 .48 Father literate .60 .49 .46 .50 .56 .50 Land owned (in acres) 1.13 1.65 2.50 4.27 3.33 4.54 Mean School level characteristics
Enrollment 178 89 119 66 137 129
Pupil-teacher ratio 66 39 56 30 27 17
% schools with toilet .33 .47 .38 .49 .72 .45
% schools with drinking water .83 .38 .72 .45 .66 .48
% schools with playground .79 .41 .50 .50 .46 .50
% schools with electricity .01 .07 .07 .25 .59 .49 Number of blackboards 3.75 1.77 3.32 1.84 5.84 3.81
Mean Teacher level characteristics
Attendance (mean over 4 visits) .64 .48 .67 .47 .88 .32
Activity (mean over 4 visits) .25 .43 .30 .46 .68 .47
% of contract teachers .41 .20 .15 .36 0 0
% of former contract - - .45 .50 - -
Age (years) 38 14 39 9 39 8
Non-SC/ST (general caste+OBC) .80 .40 .69 .46 .76 .43
Male .60 .49 .80 .40 .59 .49
% with class 12 degree .42 .49 .48 .50 .72 .45
% with college degree .32 .47 .30 .46 .26 .44
% with graduate degree .26 .44 .23 .42 .03 .16
% with preservice training .59 .49 .36 .48 .93 .26 Distance to work (km) 6 10 9 12 10 11
Teaching experience (years) 10.9 13 13.8 10 12 8
% doing multigrade .81 .39 .87 .34 .91 .29 Days of in service training 5.83 8 10.95 12 8.57 8
Definition of variables: Teacher attendance= 1 if teacher present, 0 otherwise (and averaged over the four visits), teacher activity=1 if teacher actively engaged in teaching i.e., if teacher is teaching, writing on the board, supervising written work, teaching by rote, 0 if teacher is absent, chatting with others, sitting idle/standing outside classroom, keeping order in school/class but not teaching, doing some other work unrelated to teaching (and averaged over the four visits)
Index of infrastructure in school= sum of four indicator variables for whether school has water, toilet, playground, electricity and the total number of blackboards in school.
Table 4 What do grade 3 children know in language*
Percentage children correct
UP MP KA Grade level for the competency as specified in MLL
Can read at least 3 of 5 words without matra 38 47 86 I Can read at least 3 of 5 words with matra 22 34 81 I Can read sentence 14 26 61 I & II Can write at least 2 out of 3 words without matra 31 36 76 I Can write at least 2 out of 3 words with matra 13 21 60 I Can write short sentence 10 18 40 I & II
Table 5 What do grade 3 children know in mathematics*
Percentage children correct
Test item UP MP KA Grade level for the competency as specified in MLL
Number recognition, 20-40 29 50 87 I Number recognition, 40-99 20 35 83 I 2 digit addition without carryover 62+35 35 51 87 II 2 digit addition with carry over 53+39 15 26 69 II 2 digit subtraction without borrow 45-23 28 35 77 II 2 digit subtraction with borrow 54-36 9 11 50 II Multiply 1 digit by 1 digit 6 x 8 12 20 66 II
Multiply 2 digit by 1 digit 42 x 5 10 14 50 III Divide 2 digit by 1 digit 64 ÷ 8 9 11 54 III
*End of school year for grade 3 in MP/UP and start of school year for class 4 in KA
Table 6 What do grade 2 children know in language
Percentage children correct
UP MP Grade level for the competency as specified in MLL
Alphabet recognition 32 53 I Can read at least 3 of 5 words without matra 22 31 I Can read at least 3 of 5 words with matra 11 19 I Can write at least 2 of 3 words without matra 21 28 I Can write at least 2 of 3 words with matra 7 15 I
Table 7 What do grade 2 children know in mathematics
Percentage children correct Test item
UP MP Grade level for the competency as specified in MLL
Number recognition, 11-20 21 45 I Number recognition, 21-40 14 29 I Writing 2 digit numbers, 21-40 14 31 I
1 digit addition 5+3 22 38 I
2 addition without carry over 26+43 17 27 II 1 digit subtraction 8-5 12 21 I 2 digit subtraction without borrowing 25-12 12 18 II Multiply 1 digit by 1 digit 6 x 4 7 14 II
Which is largest of three 2 digit numbers
56, 84, 69 8 16 I
Table 8 OLS: Are student characteristics correlated with scores?
Dependent variable is percent correct score, Grade 4 UP
Hindi Math
MP
Hindi Math
KA Kannada Math
Age 0.02 0.02 -0.02 -0.01 0.00 0.00
(0.01)** (0.00)** (0.00)** (0.13) (0.94) (0.83)
General caste 0.08 0.05 0.04 0.04 - -
(0.00)** (0.00)** 0.12 (0.05)* - -
OBC 0.05 0.04 -0.02 -0.02 -0.02 -0.02
(0.10) (0.05)* (0.39) (0.36) (0.13) (0.22)
ST (scheduled tribe) - - -0.07 -0.04 -0.04 -0.02 (0.02)* (0.16) (0.10) (0.30) Wealth (1 if land above
median)
0.04 0.03 0.02 0.01 0.02 0.03
(0.01)** (0.01)** (0.34) (0.68) (0.18) (0.07) Gender (1 if male) 0.06 0.10 0.05 0.05 -0.01 0.00
(0.00)** (0.00)** (0.01)** (0.00)** (0.32) (0.74)
Mother literate 0.10 0.08 0.12 0.09 0.02 0.01
(0.00)** (0.00)** (0.00)** (0.00)** (0.17) (0.31)
Father literate 0.08 0.07 0.02 0.01 0.00 0.02 (0.00)** (0.00)** (0.18) (0.24) (0.86) (0.08) School/village fixed
effects Yes Yes Yes Yes Yes Yes
n 2579 2579 2321 2321 2176 2176
R-squared 0.28 0.27 0.34 0.43 .35 .44
Robust p values in parentheses clustered at GP level, * significant at 5%; ** significant at 1%;
Table 9 OLS: Are school and teacher characteristics correlated with scores?
Dependent variable is percent correct score, Grade 4, UP
Hindi Math Hindi Math Hindi Math
Teacher-pupil ratio 5.00 5.00 5.0 4.9 4.9 4.9
(0.00)** (0.00)** (0.00)** (0.00)** (0.00)** (0.00)**
Index of infrastructure 0.00 0.00 0.00 0.00 0.00 0.00 (0.91) (0.70) (0.88) (0.62) (0.85) (0.62)
% non-sc teachers -0.03 -0.05 -0.03 -0.05 -0.03 -0.05 (0.56) (0.15) (0.56) (0.15) (0.54) (0.13)
% male teachers 0.01 0.01 0.01 0.01 0.01 0.02
(0.88) (0.70) (0.89) (0.71) (0.84) (0.66)
% teachers with college deg 0.05 0.01 0.05 0.01 0.06 0.02 (0.27) (0.72) (0.29) (0.83) (0.23) (0.62)
% teachers with graduate deg 0.05 0.02 0.05 0.02 0.05 0.03 (0.25) (0.56) (0.25) (0.57) (0.21) (0.47) Av. Years of service 0.00 0.00 0.00 0.00 0.00 0.00 (0.68) (0.60) (0.63) (0.76) (0.51) (0.86) Av. days in service in last year 0.00 0.00 0.00 0.00 0.00 0.00
(0.91) (0.41) (0.92) (0.40) (0.96) (0.30)
% teachers with pre service
training 0.01 -0.02 0.01 -0.02 0.07 0.04
(0.80) (0.64) (0.80) (0.64) (0.32) (0.41)
% teachers doing multi grade 0.00 0.03 -0.01 0.03 0.00 0.03 (0.94) (0.53) (0.94) (0.54) (0.95) (0.51)
% teachers actively engaged in
teaching (mean over 4 visits) 0.13 0.14 0.15 0.17 0.12 0.13
(0.05)* (0.01)* (0.05)* (0.00)** (0.09) + (0.03)*
% teachers present in school
(mean over 4 visits) - - -0.02 -0.05 - -
- - (0.73) (0.28) - -
% contract teachers - - 0.10 0.11
- - (0.26) (0.10)+
Block fixed effect Yes Yes Yes Yes Yes Yes
n 2553 2553 2553 2553 2553 2553
Robust p values in parentheses clustered at GP level, * significant at 5%; ** significant at 1%; + significant at 10%. Other controls include all student family background characteristics that are in table 8 and block fixed effects.