Transcranial magnetic stimulation combined with functional magnetic
resonance imaging:
From target identification to prediction of therapeutic effects in stroke patients
I n a u g u r a l - D i s s e r t a t i o n
zur
Erlangung des Doktorgrades
der Mathematisch-Naturwissenschaftlichen Fakultät der Universität zu Köln
vorgelegt von Svenja Diekhoff
aus Dormagen
2011
Berichterstatter: Prof. Dr. Ansgar Büschges
(Gutachter) Prof. Dr. Gereon Fink
PD Dr. Christian Grefkes
Tag der mündlichen Prüfung: 26.10.2011
Table of contents
I List of Abbreviations ... 1
II List of Figures ... 5
III List of Tables ... 7
IV Abstract ... 8
V Kurzzusammenfassung ... 12
1 General introduction ... 17
1.1 Stroke ... 17
1.2 The human motor system ... 18
1.3 Definition of terms ... 21
1.3.1 Clinical stages ... 21
1.3.2 Cerebral hemispheres ... 21
1.3.3 Cortico-cortical connectivity ... 22
1.4 Transcranial magnetic stimulation (TMS) ... 23
1.4.1 Stereotaxic frameless neuronavigation ... 25
1.4.2 Single-pulse TMS ... 27
1.4.3 Paired-pulse TMS ... 29
1.4.4 Repetitive transcranial magnetic stimulation (rTMS) ... 36
1.5 Functional magnetic resonance imaging (fMRI) ... 41
1.5.1 Fundamentals of magnetic resonance imaging (MRI) physics ... 41
1.5.2 MRI signal types ... 41
1.5.3 fMRI data analysis ... 45
1.6 Dynamic causal modelling (DCM) ... 46
2 Objectives and structure of the thesis ... 48
2.1 Summary of the medical problem ... 48
2.2 Study I & II: Reducing variance across studies ... 49
2.3 Study III: Reducing variance across patients ... 50
3 Study I: Spatial congruence of fMRI and TMS in healthy subjects ... 52
3.1 Introduction Study I ... 52
3.2 Methods Study I ... 54
3.2.1 Subjects ... 54
3.2.2 fMRI motor paradigm ... 54
3.2.3 fMRI data acquisition ... 55
3.2.4 Analysis of individual fMRI data ... 56
3.2.5 Identification of fMRI peak voxel ... 56
3.2.6 Identification of fMRI CoGs ... 57
3.2.7 Group analysis of fMRI data ... 57
3.2.8 Neuronavigated TMS apparatus ... 57
3.2.9 Motor hotspot and resting motor threshold ... 58
3.2.10 TMS motor mapping ... 58
3.2.11 TMS of peak voxel coordinates at 120 % RMT ... 60
3.3 Results Study I ... 60
3.3.1 fMRI group analysis ... 60
3.3.2 Individual fMRI peak voxel coordinates ... 62
3.3.3 Individual fMRI CoG coordinates ... 64
3.3.4 Differences in fMRI and TMS positions ... 64
3.3.5 Euclidian distances between fMRI and TMS positions ... 65
3.3.6 TMS of fMRI peak voxel with 120 % RMT ... 66
3.3.7 Tests to exclude spatial errors of the TMS equipment ... 68
3.4 Discussion Study I ... 72
3.4.1 Localization differences between fMRI sequences ... 72
3.4.2 Localization differences between fMRI and TMS ... 76
3.4.3 Possible explanations for the anterior shift of optimal TMS positions ... 77
3.4.4 Implications and limitations ... 80
4 Study II: Spatial Congruence of fMRI and TMS in stroke patients ... 81
4.1 Introduction Study II ... 81
4.2 Methods Study II ... 83
4.2.1 Subjects ... 83
4.2.2 fMRI motor paradigm ... 85
4.2.3 fMRI data acquisition ... 86
4.2.4 fMRI data analysis ... 87
4.2.5 Identification of fMRI peak voxel and fMRI CoGs ... 87
4.2.6 Group analysis of fMRI data ... 88
4.2.7 Neuronavigated TMS apparatus ... 88
4.2.8 Motor hotspot and resting motor threshold ... 89
4.2.9 TMS Motor Mapping ... 89
4.2.10 TMS of peak voxel coordinates at 120 % RMT ... 90
4.3 Results Study II ... 90
4.3.1 fMRI group analysis ... 90
4.3.2 Statistical Z-values at individual fMRI peak voxels ... 98
4.3.3 Differences in fMRI and TMS positions ... 98
4.3.4 Euclidian distances between fMRI and TMS positions ... 102
4.3.5 TMS of fMRI peak voxel with 120 % RMT ... 103
4.3.6 Results of TMS motor mappings ... 104
4.4 Discussion Study II ... 106
4.4.1 fMRI group analysis ... 106
4.4.2 Statistical Z-values at individual fMRI peak voxels ... 109
4.4.3 Differences in fMRI and TMS positions ... 109
4.4.4 Euclidian distances between fMRI and TMS positions ... 110
4.4.5 TMS of fMRI peak voxel with 120 % RMT ... 111
4.4.6 Results of TMS motor mappings ... 111
4.4.7 Conclusions Study II ... 112
5 Study III: Prediction of TBS effects ... 114
5.1 Introduction Study III ... 114
5.2 Methods Study III ... 116
5.2.1 Subjects ... 116
5.2.2 Clinical impairment score (CIS) ... 119
5.2.3 Experimental design ... 119
5.2.4 Theta-burst stimulation (TBS) interventions ... 121
5.2.5 TBS effects ... 122
5.2.6 Investigation of electrophysiological TMS parameters at baseline... 124
5.2.7 Functional magnetic resonance imaging (fMRI) at baseline... 127
5.2.8 Effects of lesion location, lesion size, and lesion age ... 138
5.2.9 Statistical analyses ... 139
5.3 Results Study III ... 139
5.3.1 Motor impairment in stroke patients ... 139
5.3.2 TBS effects ... 140
5.3.3 Electrophysiological TMS parameters ... 143
5.3.4 Functional magnetic resonance imaging (fMRI)... 145
5.3.5 Dynamic causal modelling (DCM) ... 152
5.4 Discussion Study III ... 164
5.4.1 TBS effects in stroke patients ... 164
5.4.2 Baseline parameters – differences between patients and controls ... 169
5.4.3 Movement related fMRI signal ... 175
5.4.4 The functional role of the contralesional hemisphere ... 177
5.4.5 Dynamic Causal Modelling (DCM) ... 178
5.4.6 Prediction of TBS effects ... 183
6 Conclusions and outlook ... 192
6.1 Study I & II: Reducing variance across studies ... 192
6.2 Study III: Reducing variance across patients ... 194
7 References ... 195
8 Acknowledgements ... 213
9 Erklärung ... 214
1
I List of Abbreviations
AMT: Active motor threshold ANOVA: Analysis of variance AP: Anterior-posterior
APB: Abductor pollicis brevis muscle ARAT: Action Research Arm Test ASL: Arterial spin labelling BA: Brodmann area
BET: Brain extraction tool BMS: Bayesian model selection
BOLD: Blood oxygenation level dependent CASL: Continuous arterial spin labelling CBF: Cerebral blood flow
CBV: Cerebral blood volume
CI: Constraint-induced movement therapy CIS: Clinical impairment score
CoG: Centre of gravity CS: Conditioning stimulus CSF: Cerebrospinal fluid CST: Cortico-spinal tract
cTBS: Continuous theta-burst stimulation DCM: Dynamic causal modelling
DLPFC: Dorsolateral prefrontal cortex dPMC: Dorsal premotor cortex
DWI: Diffusion-weighted imaging EEG: Electroencephalography EF: Electric field
EHI: Edinburgh Handedness Inventory EMG: Electromyography
EPI: Echo-planar imaging
EPSP: Excitatory postsynaptic potential
FAIR: Flow sensitive alternating inversion recovery
2 FDI: First dorsal interosseous muscle
FDR: False discovery rate
FEAT: Functional magnetic resonance imaging expert analysis tool FILM: FMRIB‟s improved linear model
FLAME: FMRIB‟s local analysis of mixed effects FLIRT: FMRIB‟s linear image registration tool fMRI: Functional magnetic resonance imaging
FMRIB: Oxford Centre for Functional Magnetic Resonance Imaging of the Brain FNIRT: FMRIB‟s non-linear image registration tool
FOCI: Frequency offset corrected inversion FOV: Field-of-view
FSL: FMRIB's Software Library FT: Finger tapping
FWHM: Full width at half maximum
GABAA: gamma-aminobutyric acid receptor A GF: Grip force
GLM: General linear model GRE: Gradient-Echo HF: High frequency H-reflex: Hoffmann reflex
HRF: Haemodynamic response function ICF: Intracortical facilitation
IHF: Interhemispheric facilitation IHI: Interhemispheric inhibition ISI: Inter-stimulus interval
iTBS: Intermittent theta-burst stimulation JTT: Jebsen-Taylor Hand Function Test LI: Laterality index
LICF: Long-interval intracortical facilitation LICI: Long-interval intracortical inhibition LTD: Long-term depression
LTP: Long-term potentiation M1: Primary motor cortex
3 M1/S1: Primary sensorimotor cortex
MCA: Middle cerebral artery
MCFLIRT: Motion correction using FMRIB's linear image registration tool MEP: Motor-evoked potential
MIS: Motor improvement score MNI: Montreal Neurological Institute
MP-RAGE: Magnetization-prepared rapid acquisition gradient echo MRI: Magnetic resonance imaging
mRS: Modified Rankin-Scale MT: Motor threshold
MTAT: Motor threshold assessment tool NBS: Navigated brain stimulation
NIHSS: National Institutes of Health stroke scale NMDA: N-methyl-D-aspartate acid
PA: Posterior-anterior
PASL: Pulsed arterial spin labelling PASW: Predictive Analysis Software PCA: Principal Component Analysis PD: Perfusion deficit
PET: Positron emission tomography
PICORE: Proximal inversion with a control for off-resonance effects PMC: Premotor cortex
PPI: Psychophysiological interactions
Q2TIPS: Quantitative imaging of perfusion using a single subtraction with interleaved thin- slice TI1 periodic saturation
QUIPSS II: Quantitative imaging of perfusion using a single subtraction ROI: Region-of-interest
RMT: Resting motor threshold
rTMS: Repetitive transcranial magnetic stimulation S1: Primary somatosensory cortex
S2: Secondary somatosensory cortex SE: Spin-Echo
SEM: Structural equation modelling
4 SICF: Short-interval intracortical facilitation
SICI: Short-interval intracortical inhibition SMA: Supplementary motor area
SNS: Stereotaxic neuronavigation systems SNR: Signal-to-noise ratio
SPL: Superior parietal lobule
SPM: Statistical Parametric Mapping T1: Longitudinal relaxation time T2/T2*: Transverse relaxation time TBS: Theta-burst stimulation TE: Echo time
TES: Transcranial electric stimulation TFT: Thin film transistor
TI: Inversion time
TMS: Transcranial magnetic stimulation TR: Time of repetition
TS: Test stimulus
V1: Primary visual cortex vPMC: Ventral premotor cortex
VLSM: Voxel-based lesion symptom mapping WHO: World Health Organization
5
II List of Figures
Figure 1.1: Introduction: The hand knob formation ... 18
Figure 1.2: Introduction: The transition between BA4 and BA6 ... 19
Figure 1.3: Introduction: The human premotor cortex ... 20
Figure 1.4: Introduction: Designation of cerebral hemispheres ... 22
Figure 1.5: Introduction: Principles of transcranial magnetic stimulation ... 24
Figure 1.6: Introduction: Stereotaxic frameless neuronavigation ... 26
Figure 1.7: Introduction: Example TMS motor map ... 29
Figure 1.8: Introduction: Paired-pulse TMS applied to one hemisphere ... 31
Figure 1.9: Introduction: Paired-pulse TMS applied to both hemispheres ... 34
Figure 1.10: Introduction: Repetitive transcranial magnetic stimulation protocols ... 37
Figure 1.11: Introduction: The model of hemispheric competition ... 39
Figure 1.12: Introduction: The haemodynamic response function ... 43
Figure 3.1: Study I: Results of the fMRI group analysis... 61
Figure 3.2: Study I: Localization of the primary motor cortex with fMRI and TMS ... 63
Figure 3.3: Study I: Stimulation of brain tissue at fMRI peak voxel coordinates with TMS .. 68
Figure 3.4: Study I: Results of TMS motor mappings ... 71
Figure 3.5: Study I: TMS motor mapping with inverted induced current direction ... 71
Figure 4.1: Study II: Results of the fMRI group analysis (fixed movement condition) ... 94
Figure 4.2: Study II: Results of the fMRI group analysis (adjusted movement condition) ... 96
Figure 4.3: Study II: Localization of the primary motor cortex with fMRI and TMS ... 101
Figure 4.4: Study II: Results of TMS motor mappings in healthy subjects ... 105
Figure 5.1: Study III: Lesion locations ... 117
Figure 5.2: Study III: Experimental design ... 120
Figure 5.3: Study III: Hypothetical models on interregional coupling (models 1-16) ... 135
Figure 5.4: Study III: Hypothetical models on interregional coupling (models 17-28) ... 136
Figure 5.5: Study III: Hypothetical models on interregional coupling (models 29-36) ... 137
Figure 5.6: Study III: Behavioural improvements following theta-burst stimulation ... 141
Figure 5.7: Study III: Movement-related fMRI signal in cortical motor areas ... 148
Figure 5.8: Study III: Correlation between laterality and TBS effects ... 151
Figure 5.9: Study III: Results of the Bayesian model selection procedure ... 153
6
Figure 5.10: Study III: Significant interregional couplings ... 156
Figure 5.11: Study III: Significant group differences in effective connectivity ... 158
Figure 5.12: Study III: Prediction of theta-burst stimulation effects ... 161
Figure 5.13: Study III: Results of the voxel-based lesion symptom mapping ... 162
7
III List of Tables
Table 1.1: Introduction: Designation of clinical stages ... 21
Table 1.2: Introduction: Paired-pulse TMS parameters applied to one hemisphere ... 30
Table 1.3: Introduction: Paired-pulse TMS parameters assessed over both hemispheres ... 33
Table 3.1: Study I: Positions of highest fMRI signals and highest TMS effects ... 64
Table 3.2: Study I: Euclidean distances between fMRI and TMS sites ... 66
Table 3.3: Study I: Qualitative comparison of different motor mapping approaches ... 76
Table 4.1: Study II: Demographical, clinical, and behavioural data ... 84
Table 4.2: Study II: Peak activation cluster of the fMRI group analysis ... 97
Table 4.3: Study II: Mean fMRI and TMS positions in MNI space ... 99
Table 4.4: Study II: Mean Euclidean distances between fMRI and TMS positions ... 103
Table 5.1: Study III: Demographical, clinical, and behavioural data ... 118
Table 5.2: Study III: Peak voxel coordinates used for ROI analyses and DCM ... 133
Table 5.3: Study III: Summary of previous studies using TBS... 167
Table 5.4: Study III: Summary of results ... 170
8
IV Abstract
Repetitive transcranial magnetic stimulation (rTMS), particularly theta-burst stimulation (TBS), can be applied to modulate cortical excitability beyond the period of stimulation (Huang et al., 2005). Consequently, rTMS is regarded to have high therapeutic potential for treatment of various psychiatric and neurological diseases related to cortical hypo- or hyperexcitability such as stroke (Ridding & Rothwell, 2007). Whether rTMS induced effects are sufficiently robust to be useful in clinical settings is currently under intense investigation.
The most challenging problem appears to be considerably high variability in rTMS induced effects both, across studies (Hoogendam et al., 2010) and individual patients (Ameli et al., 2009). Hence, the major goal of the present thesis was to improve rTMS intervention strategies in stroke patients suffering from chronic motor hand deficits by multimodal uses of (repetitive) TMS with state-of-the-art neuroimaging techniques.
Sources of variance across studies are likely to be methodological in origin. They might result from different strategies to identify the cortical rTMS target position. Individual functional magnetic resonance (fMRI) data have been demonstrated to yield best spatial approximations of the most excitable TMS position compared to other techniques (Sparing et al., 2008).
However, there is still a considerably large spatial mismatch between the cortical position showing highest movement-related fMRI signal and the cortical position yielding highest muscle responses when stimulated with TMS of up to 14 mm (Bastings et al., 1998;
Boroojerdi et al., 1999; Herwig et al., 2002; Krings et al., 1997; Lotze et al., 2003; Sparing et al., 2008; Terao et al., 1998). The underlying cause of this spatial mismatch is unknown.
Hence, the aim of the first study (Study I) of the present thesis was to test the hypothesis that the spatial mismatch between positions with highest fMRI signal change and positions with highest TMS excitability might be caused by the widely-used Gradient-Echo blood oxygenation level dependent (GRE-BOLD) fMRI technique. GRE-BOLD signal has been demonstrated to occur further downstream from the site of neural activity in large veins running on the cerebral surface (Uludag et al., 2009). Consequently, we tested the hypothesis that alternative fMRI sequences may localize neural activity (i) closer to the anatomical motor hand area, i.e. Brodmann Area 4 (BA4), and (ii) closer to the optimal TMS position than GRE-BOLD. The following alternative fMRI techniques were tested: (i) Spin-Echo (SE- BOLD) assessing blood oxygenation level dependent signal changes with decreased sensitivity for the macrovasculature at high magnetic fields (≥ 3 Tesla, Uludag et al., 2009)
9 and (ii) arterial spin labelling (ASL), assessing local changes in cerebral blood flow (ASL- CBF) which have been shown to occur in close proximity to synaptic activity (Duong et al., 2000). GRE-BOLD, SE-BOLD, and ASL-CBF signal changes during right thumb abductions were obtained from 15 healthy young subjects at 3 Tesla. In 12 subjects, brain tissue at fMRI peak voxel coordinates was stimulated with neuronavigated TMS to investigate whether spatial differences between fMRI techniques are functionally relevant, i.e. impact on motor- evoked potentials (MEPs) recorded from a contralateral target muscle, which is involved in thumb abductions. A systematic TMS motor mapping was performed to identify the most excitable TMS position (i.e. the TMS hotspot) and the centre-of-gravity (i.e. the TMS CoG), which considers the spatial distribution of excitability in the pericentral region. Euclidean distances between TMS and fMRI positions were calculated for each fMRI technique. Results indicated that highest SE-BOLD and ASL-CBF signal changes occurred in the anterior wall of the central sulcus (BA4), whereas highest GRE-BOLD signal changes occurred significantly closer to the gyral surface where most large draining veins are located. fMRI techniques were not significantly different from each other in Euclidean distances to optimal TMS positions since optimal TMS positions were located considerably more anterior (and slightly surprisingly in premotor cortex (BA6) and not BA4). Stimulation of brain tissue at GRE-BOLD peak voxel coordinates with TMS resulted in significantly higher MEPs (compared to SE-BOLD and ASL-CBF coordinates). This was probably the case because GRE-BOLD positions tended to be located at the gyral crown, which was slightly (but not significantly) closer to the TMS hotspot position. Taken together, findings of Study I suggest that spatial differences between fMRI and TMS positions are not caused by spatial unspecificity of the widely-used GRE-BOLD fMRI technique. Hnece, other factors such as complex interactions between brain tissue and the TMS induced electric field (Opitz et al., 2011), could be the underlying cause.
Identification of the cortical rTMS target position is particularly challenging in stroke patients since reorganization processes after stroke may shift both, fMRI and TMS positions in unknown direction and extend (Rossini et al., 1998). In the second study (Study II) of the present thesis, we therefore tested whether findings obtained from healthy young subjects in Study I do also apply to chronic stroke patients and older (i.e. age-matched) healthy control subjects. In this study, arterial spin labelling (ASL) was used to assess CBF and BOLD signal changes simultaneously during thumb abductions with the affected/non-dominant and the unaffected/dominant hand in 15 chronic stroke patients and 13 age-matched healthy control
10 subjects at 3 Tesla. Brain tissue at fMRI peak voxel coordinates was stimulated with neuronavigated TMS to test whether spatial differences are functionally relevant and impact on MEPs. Systematic TMS motor mappings were performed for both hemispheres in overall 12 subjects (6 stroke patients and 6 healthy subjects). Euclidean distances between fMRI and TMS positions were calculated for each hemisphere and fMRI technique. In line with results of Study I, highest ASL-CBF signal changes were located in the anterior wall of the central sulcus (BA4), whereas highest ASL-BOLD signal changes occurred significantly closer to the gyral surface. In contrast to Study I, there were no significant differences between ASL-CBF and ASL-BOLD positions in MEPs when stimulated with neuronavigated TMS, which suggests that spatial differences (in depth) were not functionally relevant for TMS applications. In line with Study I, there were no significant differences between fMRI techniques in Euclidean distances to optimal TMS positions, since optimal TMS positions were located considerably more anterior than fMRI positions (in premotor cortex, i.e. BA6).
Stroke patients showed overall larger displacements (between fMRI and TMS positions) on the ipsilesional (but not the contralesional) hemisphere compared to healthy subjects.
However, none of the fMRI techniques yielded positions significantly closer to the optimal TMS position. Hence, functional reorganization may impact on spatial congruence between fMRI and TMS, but the effect is similar for ASL-CBF and ASL-BOLD.
Pathomechanisms underlying stroke induced motor deficits are still poorly understood but a simplified model of hemispheric competition has been suggested, which proposes relative hypoexcitability of the ipsilesional hemisphere and hyperexcitability of the contralesional hemisphere leading to pathologically increased interhemispheric inhibition from the contralesional onto the ipsilesional hemisphere during movements of the paretic hand (Duque et al., 2005; Grefkes et al., 2008b, 2010; Murase et al., 2004). In line with the model of hemispheric competition, both increasing excitability of the ipsilesional hemisphere (Khedr et al., 2005; Talelli et al., 2007) as well as decreasing excitability of the contralesional hemisphere (Fregni et al., 2006; Di Lazzaro et al., 2008a) have been demonstrated to normalize cortical excitability towards physiological levels and/or ameliorate motor performance of the stroke affected hand. However, there is considerably high inter-individual variance and some patients may even show deteriorations of motor performance after rTMS (Ameli et al., 2009). Therefore, the aim of the third study (Study III) was to identify reliable predictors for TBS effects on motor performance of the affected hand in stroke patients, which appears essential for successful implementation of TBS in neurorehabilitation. Overall,
11 13 chronic stroke patients with unilateral motor hand deficit and 12 age-matched healthy control subjects were included in the study. All patients received 3 different TBS interventions on 3 different days: (i) intermittent TBS (iTBS, facilitatory) over the primary motor cortex (M1) of the ipsilesional hemisphere, (ii) continuous TBS (cTBS, inhibitory) over M1 of the contralesional hemisphere, and (iii) either iTBS or cTBS over a control stimulation site (to control for placebo effects). Motor performance was measured before and after each TBS session with 3 different motor tasks and an overall motor improvement score was calculated. All subjects participated in an fMRI experiment, in which they performed rhythmic fist closures with their affected/non-dominant and unaffected/dominant hand. A laterality index (LI), reflecting laterality of fMRI signal in cortical motor areas was calculated.
Effective connectivity, i.e. the direct or indirect causal influence that activity in one area exerts on activity of another area (Friston et al., 1993a), was inferred from fMRI data by means of dynamic causal modelling (DCM). Due to relatively high inter-individual variance, neither iTBS nor cTBS was significantly different from control TBS in terms of average behavioural (or electrophysiological) changes over the group of patients. However, beneficial effects of iTBS over the ipsilesional hemisphere were predicted by a unilateral fMRI activation pattern during movements of the affected hand and by the integrity of the cortical motor network. The more pronounced the promoting influence from the ipsilesional supplementary motor area (SMA) onto ipsilesional M1 and the more pronounced the inhibitory effect originating from ipsilesional M1 onto contralesional M1, the better was the behavioural response to facilitatory iTBS applied to the ipsilesional hemisphere. No significant correlations were found for behavioural improvements following cTBS or behavioural changes of the unaffected hand. Taken together, Study III yielded promising results indicating that laterality of fMRI signal and integrity of the motor network architecture constitute promising predictors for response to iTBS. In patients in whom the connectivity pattern of the ipsilesional motor network resembled physiological network connectivity patterns (i.e. preserved inhibition of the contralesional hemisphere and supportive role of the SMA of the ipsilesional hemisphere), beneficial effects of iTBS over the ipsilesional hemisphere could be observed. In contrast, patients with severely disturbed motor networks did not respond to iTBS or even deteriorated.
12
V Kurzzusammenfassung
Die repetitive transkranielle Magnetstimulation (rTMS), insbesondere die Theta-Burst Stimulation (TBS), kann dazu verwendet werden, kortikale Erregbarkeit über den Stimulationszeitraum hinaus zu modulieren (Huang et al., 2005). Daher wird der rTMS ein hohes therapeutisches Potenzial für die Behandlung diverser psychiatrischer und neurologischer Erkrankungen zugeschrieben, die mit einer kortikalen Hypo- oder Hyperexzitabilität einhergehen, wie es beispielsweise nach einem Schlaganfall der Fall ist (Ridding & Rothwell, 2007). Ob die durch die rTMS induzierten Effekte ausreichend robust sind, um sich im klinischen Alltag durchzusetzen, wird momentan intensiv untersucht. Die größte Herausforderung besteht möglicherweise darin, die hohe Varianz in rTMS vermittelten Effekten sowohl zwischen Studien (Hoogendam et al., 2010) als auch zwischen einzelnen Patienten (Ameli et al., 2009) zu reduzieren. Daher war das Hauptziel der vorliegenden Doktorarbeit, die Verbesserung von rTMS-Interventionsstrategien für Schlaganfallpatienten mit chronifiziertem motorischem Defizit der Hand durch die multimodale Anwendung der (repetitiven) TMS mit modernsten bildgebenden Verfahren.
Die Quelle hoher Varianz über Studien hinweg ist höchstwahrscheinlich methodischen Ursprungs und könnte daraus resultieren, dass verschiedenen Strategien zur Identifizierung der kortikalen rTMS Zielposition verwendet werden. Individuelle funktionelle Magnetresonanz Tomographie (fMRT) liefert die beste räumliche Annäherung an die Position mit höchster TMS-Erregbarkeit im Vergleich zu anderen Methoden (Sparing et al., 2008).
Dennoch gibt es immer noch eine relativ große räumliche Diskrepanz zwischen der kortikalen Position höchster bewegungsabhängiger fMRT-Aktivität und der kortikalen Position, die zu höchsten Muskelantworten führt wenn sie mit TMS stimuliert wird, von bis zu 14 mm (Bastings et al., 1998; Boroojerdi et al., 1999; Herwig et al., 2002; Krings et al., 1997; Lotze et al., 2003; Sparing et al., 2008; Terao et al., 1998). Die Ursache dieser räumlichen Diskrepanz ist unbekannt. Daher war das Ziel der ersten Studie (Study I) die Hypothese zu testen, dass die räumliche Diskrepanz zwischen Positionen mit höchster fMRT-Aktivität und Positionen mit höchster TMS-Erregbarkeit durch die Verwendung der weitverbreiteten Gradienten-Echo blood oxygenation level dependent (GRE-BOLD) fMRT-Methode zustande kommt. Das GRE-BOLD-Signal entsteht „stromabwärts“ von neuraler Aktivität in großen Venen, die auf der Hirnoberfläche verlaufen (Uludag et al., 2009). Daher testeten wir die Hypothese, dass alternative fMRT-Sequenzen neurale Aktivität (i) näher zum anatomischen
13 motorischen Handareal, Brodmann Area 4 (BA4) und (ii) näher zur optimalen TMS-Position lokalisieren als GRE-BOLD. Die folgenden fMRT-Sequenzen wurden als Alternativen zu GRE-BOLD getestet: (i) Spin-Echo das den blood oxygenation level dependent Effekt (SE- BOLD) bei höheren magnetischen Feldstärken (≥ 3 Tesla) mit verringerter Sensitivität für große Gefäße misst und (ii) die arterielle Spinmarkierung (arterial spin labelling, ASL), die lokale Veränderungen im zerebralen Blutfluss (cerebral blood flow, CBF) misst, die in unmittelbarer Nähe synaptischer Aktivität entstehen (Duong et al., 2000). GRE-BOLD-, SE- BOLD- und ASL-CBF-Signalveränderungen während Abduktionsbewegungen des rechten Daumens wurden von 15 jungen gesunden Probanden bei einer Feldstärke von 3 Tesla erhoben. Bei 12 Probanden wurde außerdem Hirngewebe an der Position des fMRT- Maximums mittels neuronavigierter TMS stimuliert, um zu testen ob räumliche Unterschiede zwischen fMRT-Methoden funktionell relevant sind, das heißt einen messbaren Einfluss auf motorisch evozierte Potentiale (MEPs) haben, die vom einem kontralateralen Zielmuskel abgeleitet wurden, der an der Daumenabduktion maßgeblich beteiligt ist. Mittels TMS wurde eine systematische Kartierung des motorischen Kortex vorgenommen, anhand derer die Position höchster kortikaler Erregbarkeit (TMS hotspot) und ein sogenanntes centre-of- gravity (TMS CoG) bestimmt wurde, welches die Verteilung kortikaler Erregbarkeit des benachbarten Gewebes mitberücksichtigt. Euklidische Abstände zwischen TMS- und fMRT- Positionen wurden für jede fMRT-Methode berechnet. Die Ergebnisse deuten darauf hin, dass die höchsten SE-BOLD- und ASL-CBF-Signalveränderungen in der Vorderwand des Sulcus centralis auftreten (BA4), während höchste GRE-BOLD-Signalveränderungen signifikant näher zur Hirnoberfläche auftraten, wo die meisten großen Venen verlaufen. Die fMRT- Methoden unterschieden sich nicht signifikant bezüglich ihrer Distanz zur optimalen TMS- Position voneinander, da optimale TMS-Positionen deutlich weiter anterior (und etwas überraschend im prämotorischen Kortex (BA6) und nicht in BA4 lagen). Stimulation des Hirngewebes (das höchste GRE-BOLD-Signalveränderungen zeigte) mittels TMS resultierte in signifikant höheren MEPs im Vergleich zu den anderen beiden fMRT-Methoden. Dies war vermutlich der Fall weil GRE-BOLD-Positionen dazu tendierten auf der Gyruskuppe zu liegen und somit leicht (aber nicht signifikant) näher an der TMS hotspot position lagen.
Insgesamt konnte also durch die erste Studie gezeigt werden, dass die räumliche Diskrepanz zwischen fMRT- und TMS-Positionen nicht durch die räumliche Unspezifität der weitverbreiten GRE-BOLD-Methode zustande kommt. Andere Faktoren, wie komplexe
14 Interaktionen zwischen Hirngewebe und dem durch die TMS induzierten elektrischen Feld (Opitz et al., 2011) könnten stattdessen die Ursache darstellen.
Die Identifizierung der kortikalen Zielregion für die rTMS ist bei Patienten erschwert, da nach einem Schlaganfall Reorganisationsprozesse im Gehirn stattfinden, die dazu führen können, dass sich sowohl fMRT- als auch TMS-Positionen in unbekanntem Ausmaß und in unbekannte Richtung räumlich verschieben (Rossini et al., 1998). In der zweiten Studie (Study II) der vorliegenden Doktorarbeit testeten wir daher, ob die Ergebnisse von Study I, die von jungen gesunden Probanden erhoben wurden, auf Schlaganfallpatienten und ältere (d.h. gleichaltrige) gesunde Kontrollprobanden ebenfalls zutreffen. In dieser Studie wurde die arterielle Spinmarkierung (arterial spin labelling, ASL) dazu verwendet, Veränderungen im blood oxygenation level dependent effect (BOLD) und im zerebralen Blutfluss (cerebral blood flow, CBF) simultan während Daumenabduktionsbewegungen der betroffenen/nicht- dominanten und der nicht-betroffenen/dominanten Hand zu erheben. Die Studie wurde an 15 Patienten im chronischen Stadium und 13 gleichaltrigen gesunden Kontrollprobanden bei einer Feldstärke von 3 Tesla durchgeführt. Hirngewebe an fMRT-Maximums-Positionen wurde mittels neuronavigierter TMS stimuliert, um zu testen ob räumliche Unterschiede funktionell relevant sind und sich auf MEPs auswirken. Eine systematische Kartierung beider motorischer Kortizes wurde bei insgesamt 12 Probanden (6 Schlaganfallpatienten und 6 Kontrollprobanden) mittels TMS erstellt. Euklidische Abstände zwischen fMRT- und TMS- Positionen wurden berechnet. Wie auch in Studie I, traten höchste ASL-CBF- Signalveränderungen in der Vorderwand des Sulcus centralis (BA4) auf, wohingegen höchste ASL-BOLD-Signalveränderungen signifikant näher zur Hirnoberfläche auftraten. Im Gegensatz zur ersten Studie gab es in dieser Studie keinen signifikanten Unterschied zwischen ASL-CBF- und ASL-BOLD-Positionen in durch die direkte TMS-Stimulation resultierenden MEPs, was darauf hinweist, dass signifikante räumliche Unterschiede (in Tiefe) keine funktionelle Relevanz für die TMS besaßen. Wie auch in der ersten Studie, gab es keine signifikanten Unterschiede zwischen den fMRT-Methoden in Euklidischen Abständen zur optimalen TMS-Position, die sich deutlich weiter anterior im prämotorischen Kortex (BA6) befand. Obwohl Patienten auf der ipsiläsionellen Hemisphäre insgesamt größere Distanzen (zwischen fMRT- und TMS-Positionen) im Vergleich zu den gesunden Kontrollprobanden aufwiesen, lieferte keine der fMRT-Methoden Positionen die signifikant näher zur optimalen TMS-Position lagen. Daher scheinen Reorganisationsprozesse einen
15 Einfluss auf die räumliche Kongruenz von fMRT und TMS zu haben, betreffen aber ASL- CBF ebenso wie ASL-BOLD.
Der Pathomechanismus, der Schlaganfall-induzierten motorischen Defiziten zugrunde liegt, ist größtenteils noch unverstanden. Das stark vereinfachte Modell der Hemisphärenkonkurrenz postuliert eine relative Hypoexzitabiliät der ipsiläsionellen und Hyperexzitabilität der kontraläsionellen Hemisphäre, was zu einer pathologisch verstärkten Inhibition von der kontraläsionellen Hemisphäre auf die ipsiläsionelle Hemisphäre während Bewegung der betroffenen Hand führt (Duque et al., 2005; Grefkes et al., 2008b, 2010;
Murase et al., 2004). Dem Modell der Hemisphärenkonkurrenz entsprechend, kann sowohl durch Erhöhung der Exzitabilität der ipsiläsionellen Hemisphäre (Khedr et al., 2005; Talelli et al., 2007) als auch durch Verringerung der Exzitabilität der kontraläsionellen Hemisphäre (Fregni et al., 2006; Di Lazzaro et al., 2008a) eine Normalisierung der kortikalen Exzitabilität hin zu einem physiologischen Gleichgewicht und/oder eine Verbesserung der motorischen Leistung der betroffenen Hand erzielt werden. Es gibt jedoch eine relativ hohe interindividuelle Varianz und einige Patienten können sogar eine verschlechterte motorische Leistung der betroffenen Hand nach rTMS aufweisen (Ameli et al., 2009). Daher war das Ziel der dritten Studie (Study III) die Identifizierung zuverlässiger Prädiktoren für die Effekte der TBS auf die motorische Leistung der betroffenen Hand von Schlaganfallpatienten, da dies ein essentieller Schritt für die Implementierung der rTMS in die Neurorehabilitation zu sein scheint. 13 Schlaganfallpatienten mit chronifiziertem motorischem Defizit der Hand und 12 gleichaltrige gesunde Kontrollprobanden nahmen an der Studie teil. Alle Patienten erhielten 3 verschiedene TBS-Interventionen an 3 verschiedenen Tagen: (i) intermittierende TBS (iTBS, fazilitierend) über dem primärmotorischen Kortex (M1) der ipsiläsionellen Hemisphäre, (ii) kontinuierliche (continuous) TBS (cTBS, inhibitorisch) über dem M1 der kontraläsionellen Hemisphäre und (iii) entweder iTBS oder cTBS über einer Kontrollstimulationsposition. Die motorische Leistung wurde vor und nach jeder TBS-Intervention mit 3 unterschiedlichen motorischen Skalen gemessen, auf denen basierend ein allgemeiner Verbesserungswert errechnet wurde. Alle Probanden nahmen an einem fMRT-Experiment teil, in dem sie rhythmische Faustschlussbewegungen mit ihrer betroffenen/nicht-dominanten und ihrer nicht- betroffenen/dominanten Hand durchführten. Ein Lateralitätsindex, der die Lateralität des fMRT-Signals in kortikalen motorischen Arealen widerspiegelt wurde berechnet. Die effektive Konnektivität, also der direkte oder indirekte kausale Einfluss, den Aktivität eines Areals auf die Aktivität eines anderen Areals ausübt (Firston et al., 1993a), wurde mittels
16 dynamic causal modelling (DCM) aus den fMRT-Zeitreihen geschätzt. Aufgrund einer relativ hohen inter-individuellen Varianz unterschied sich weder die iTBS noch die cTBS signifikant von der Kontrollstimulation bezüglich induzierter Veränderungen in der Leistungsfähigkeit der betroffenen Hand oder Veränderungen in der Exzitabilität der ipsiläsionellen Hemisphäre über die gesamte Gruppe der Patienten hinweg. Positive Effekte der iTBS über der ipsiläsionellen Hemisphäre wurden jedoch signifikant durch ein unilaterales fMRT- Aktivierungsmuster während Bewegung der betroffenen Hand und die Integrität des motorischen Netzwerks prädiziert. Je ausgeprägter der fördernde Einfluss vom ipsiläsionellen supplementär motorischen Areal (SMA) auf den ipsiläsionellen M1 und je ausgeprägter der inhibitorische Einfluss ausgehend vom ipsiläsionellen M1 auf den kontraläsionellen M1, desto höher war die Wahrscheinlichkeit, dass ein Patient von der fazilitierenden iTBS über dem ipsiläsionellen M1 profitierte. Für Verhaltenseffekte nach cTBS und Verhaltenseffekte der nicht-betroffenen Hand wurden keine signifikanten Korrelationen gefunden.
Zusammenfassend weisen die Ergebnisse der dritten Studie darauf hin, dass die Lateralität des fMRT-Signals und die Integrität des motorischen Netzwerks vielversprechende Prädiktoren für Verhaltenseffekte nach iTBS darstellen. Bei Patienten bei denen ipsiläsionelle motorische Netzwerkinteraktionen physiologisch auftretenden Netzwerkinteraktionen glichen (erhaltene Inhibition der kontraläsionellen Hemisphäre und unterstützende Rolle des ipsiläsionellen SMA), stellte sich eine Verbesserung der vom Schlaganfall betroffenen Hand ein, wohingegen Patienten mit schwer geschädigtem motorischen Netzwerk keine Veränderungen oder gar eine Verschlechterung nach iTBS zeigten.
General introduction
17
1 General introduction
1.1 Stroke
Stroke is caused by an interruption of blood supply to the brain either due to blood vessel blockage (ischaemic stroke, approx. 82%) or blood vessel rupture (haemorrhagic stroke, approx. 14%; Feigin et al., 2009). Both leads to a sudden breakdown in oxygen- and nutrition supply and may cause permanent brain tissue damage. The following World Health Organization (WHO) standard criterion is frequently used to define stroke: “rapidly developing clinical signs of focal (at times global) disturbance of cerebral function, lasting more than 24 hours (if not leading to death) with no apparent cause other than that of vascular origin” (Hatano, 1976). Stroke incidence rates in the years 2000-2008 varied between countries in the range of 74 to 223 (per 100 000 persons per year; Feigin et al., 2009).
Spontaneous recovery occurs within three months after stroke until a plateau with relatively stable motor performance is reached after three to six months (Kwakkel et al., 2004).
However, clinical outcome after stroke is highly variable across individuals. Data of the German Stroke Database (including 1754 patients) suggest that three months after stroke, 9.5% of patients had died, 58.4% had completely recovered, and 32.1% retained permanent deficits (Weimar et al., 2002). Hemiparesis is the most frequent neurological deficit (occurring in more than 80% of patients), followed by sensory deficits (approx. 45%) and speech deficits (approx. 24%; Rathore et al., 2002). Hemiparesis occurs most often in upper (76%) but also in lower limbs (69%) and the face (55%; Rathore et al., 2002). The ability to live independently after stroke largely depends on reconstitution of motor control. Currently, physical and occupational therapy and at times constraint-induced movement therapy (CI) are used for treatment of stroke-induced hand motor deficits. CI involves immobilization of the unaffected limb to induce “forced use” of the affected limb combined with intense training of the affected limb (Taub et al., 1993). However, additional therapeutic strategies are needed since stroke is the most common cause for permanent disability in adults (Kolominsky-Rabas et al., 2006; Nelles, 2007) and one of the most expensive diseases in industrialised countries (Kolominsky-Rabas et al., 2006).
General introduction
18
1.2 The human motor system
The human motor system is composed of cortical and subcortical structures interacting in complex subsystems, which are organized either hierarchically or in parallel (Amunts &
Zilles, 2007). Important part of the cortical human motor system is the primary motor cortex (M1; also Brodmann Area (BA) 4; Brodmann, 1909), which is located in the anterior wall of the central sulcus. BA4 is somatotopically organized: foot and leg representations are located in the mesial wall of the precentral gyrus followed by trunk, arm, hand, fingers (from little finger to thumb), face, lips, and tongue representations (from dorsomedial to ventrolateral;
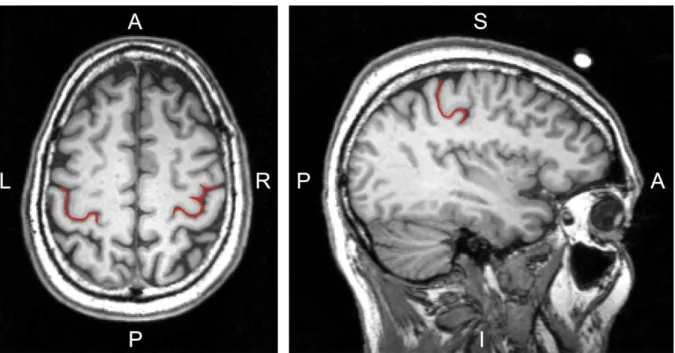
Penfield & Rasmussen, 1950). A reliable anatomical landmark for the motor hand representation is the hand knob structure, which is shaped like an omega or epsilon in axial slices and hook shaped in sagittal slices (Yousry et al., 1997; Figure 1.1).
Figure 1.1: Introduction: The hand knob formation. The central sulcus at the hand knob formation is highlighted in red colour on a high-resolution anatomical magnetic resonance image of a healthy volunteer. In the axial slice (image on the left) the hand knob is omega-shaped in the left hemisphere and epsilon-shaped in the right hemisphere. In the sagittal slice (image on the right) the hand knob is shaped like a posteriorly directed hook. (A: anterior; I: inferior; L: left; P: posterior; R: right; S:
superior)
The anterior margin of BA4 is the posterior margin of the premotor cortex (PMC; also BA6).
Brodmann initially assumed that BA4 extents over the entire surface area of the precentral gyrus (Brodmann, 1909). However, recent histological studies demonstrated that BA4 occupies only a limited part of the exposed surface of the precentral gyrus. The transition
General introduction
19 between BA4 and BA6 depends on the lateral position along the central sulcus (Geyer et al., 2000; Rademacher et al., 2001; White et al., 1997). In its dorsomedial part, BA4 covers posterior aspects of the crown of the precentral gyrus, more laterally BA4 tends to submerge inside the central sulcus (Geyer et al., 2000; Figure 1.2).
Gerloff et al. (2006) Figure 1.2: Introduction: The transition between BA4 and BA6. As a rule, the primary motor cortex (BA4) occupies only a limited part of the exposed surface of the precentral gyrus, mainly in its dorsomedial part. More laterally, BA4 tends to be buried in the depth of the central sulcus. This latter aspect is depicted in the figure on the right. (BA: Brodmann Area; BA3: primary somatosensory cortex; BA4: primary motor cortex; BA6: premotor cortex; CS: central sulcus)
Cytoarchitectonically, BA4 is characterized by absence of lamina IV and presence of giant Betz cells in lamina V whose axons bend down in the precentral gyrus and form the cortico- spinal tract (CST). The CST passes through the posterior limb of the internal capsule and the cerebral peduncle before 80-85% of the fibres cross at the decussation of pyramids in the medulla oblongata to the contralateral side (referred to as lateral CST). Fibres not crossing in the brain stem (referred to as ventral CST) cross in the spinal cord segment of their target cells. Pyramidal cells enervate motoneurons in the anterior horn of the spinal cord either directly or indirectly via interneurons (Amunts & Zilles, 2007). Finally, spinal cord motoneurons terminate onto skeletal muscles. The human extra-pyramidal motor system is composed of the basal ganglia, cerebellum, and extra-pyramidal fibre tracts connecting the motor cortex with motor brain stem nuclei and the spinal cord respectively. These fibre tracts may act as alternative pathways in the case of severe CST damage after stroke.
General introduction
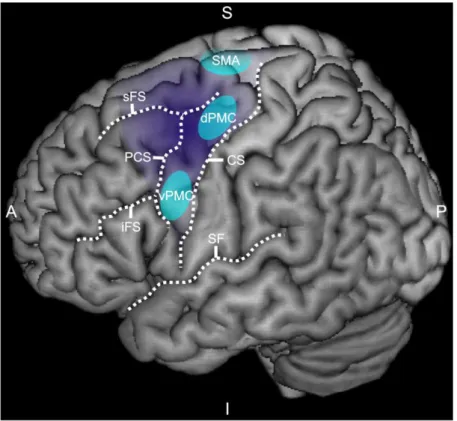
20 The PMC (BA6) is an important cortical motor area engaged in both movement preparation and movement execution. BA6 can be subdivided into at least three distinctive functional areas: (i) the supplementary motor area (SMA), (ii) the dorsal premotor cortex (dPMC), and (iii) the ventral premotor cortex (vPMC). The anterior limit of BA6 is at an individually variable distance anterior to the precentral sulcus and does not correspond to a specific anatomical landmark (Geyer et al., 2004). However, the extent of BA6 is greater in dorsomedial parts of the hemispheres and recedes caudally in ventrolateral parts merging with the precentral sulcus close to the Sylvian fissure (Amunts et al., 1999; Figure 1.3).
Figure 1.3: Introduction: The human premotor cortex. The lateral view on the left cerebral hemisphere shows the extent of the premotor cortex (in dark purple) and representative areas (in light blue) corresponding to the dorsal premotor cortex (dPMC), ventral premotor cortex (vPMC), and the supplementary motor area (SMA). (A: anterior; CS: central sulcus; I: inferior; iFS: inferior frontal sulcus; P: posterior; PCS: precentral sulcus; S: superior; SF: Sylvian fissure; sFS: superior frontal sulcus)
The SMA is mainly situated in the mesial wall of the hemisphere. Its boundaries are usually located at the Mantelkante of the hemisphere (Grafton et al., 1996) but may extend slightly in dorsolateral direction (Mayka et al., 2006; Tanji & Hoshi, 2009). The ventrolateral limit of the SMA is the dorsomedial border of the dPMC. Although SMA and dPMC constitute two functionally distinct regions (Penfield & Welch, 1951), data allowing differentiation of those
General introduction
21 two regions based on anatomical grounds are scarce (Matelli et al., 1985). The border between dPMC and vPMC has traditionally been assigned to the intersection of the precentral sulcus and the inferior frontal sulcus (Grezes & Decety, 2001; Picard & Strick, 2001). However, more recent studies based on structural imaging suggest that it is much more dorsal, namely between superior and inferior frontal sulcus (average Z coordinate: 48; Tomassini et al., 2007). Similar to BA4, premotor areas are somatotopically organized and have direct projections to spinal cord motoneurons (He at al., 1993). Additionally, premotor areas send efferent connections to functionally related representations in BA4 (Dum & Strick, 2002).
Homotopic transcallosal connections between M1, SMA, vPMC, and dPMC as well as heterotopic transcallosal connections between M1, SMA, and lateral premotor cortex (dPMC and vPMC) have been demonstrated in anatomical tracer studies in macaque monkeys (McGuire et al., 1991; Rouiller et al., 1994).
1.3 Definition of terms 1.3.1 Clinical stages
Based on a recent review article summarizing mechanisms of spontaneous recovery after stroke, the following definitions for clinical stages of the disease are used throughout the manuscript (Cramer, 2008; Table 1.1).
Table 1.1: Introduction: Designation of clinical stages
Acute stage ≤ 3 days after stroke
Subacute stage 4 days to 3 months after stroke
Early chronic stage 3 to 6 months after stroke
Chronic stage ≥ 6 months after stroke
1.3.2 Cerebral hemispheres
Throughout the manuscript, the term ipsilesional will be used to refer to the side of the stroke lesion and the term contralesional will be used to refer to the side opposite to the stroke lesion. Hence, the ipsilesional hemisphere is ipsilateral to the stroke lesion and the contralesional hemisphere is contralateral to the stroke lesion. Although, in principle, the ipsilesional hemisphere corresponds to the affected hemisphere and the contralesional
General introduction
22 hemisphere corresponds to the unaffected hemisphere these terms may be misleading, since stroke lesions may also impact on the “unaffected” hemisphere (Grefkes et al., 2008b;
Loubinoux et al., 2003; Ward et al., 2003a, 2003b), and hence these terms will not be used.
The terms ipsilesional hemisphere and contralesional hemisphere should not be confused with the terms ipsilateral hemisphere and contralateral hemisphere which are used to refer to the hemisphere which is ipsi- or contralateral to an event such as hand movements or an intervention. During movements of the affected hand (sometimes referred to as the paretic hand) the ipsilateral hemisphere refers to the contralesional hemisphere and the contralateral hemisphere refers to the ipsilesional hemisphere (Figure 1.4).
Figure 1.4: Introduction: Designation of cerebral hemispheres. The ipsilesional hemisphere is on the same side as the stroke lesion, whereas the contralesional hemisphere is the hemisphere opposite to the stroke lesion. During movements of the paretic (i.e. affected) hand, the contralateral hemisphere corresponds to the ipsilesional hemisphere and the ipsilateral hemisphere corresponds to the contralesional hemisphere.
1.3.3 Cortico-cortical connectivity
Two important concepts of current brain research are the concept of functional segregation and the concept of functional integration (Friston, 2002; Friston, 1994). Functional segregation refers to the finding that in the human brain, particularly in the cerebral cortex, different areas take over different specific tasks, whereas functional integration relies on observations that brain functions are not localized in a specific brain region but rely on coordinated exchange of information between different areas with distinct functions (Friston,
General introduction
23 2002). Hence, functional segregation and functional integration are not competing concepts since functional integration is based on the concept of functional segregation, which postulates interactions between areas with distinct functions.
Connectivity describes structural and functional properties of brain networks. Three different subtypes can be distinguished: (i) anatomical connectivity, (ii) functional connectivity, and (iii) effective connectivity. Anatomical connectivity refers to anatomical fibre tracts connecting brain regions and providing the neuronal basis for cortico-cortical connectivity.
By contrast, functional connectivity refers to temporal coherence between remote neurophysiological events (Friston et al., 1993b) whereas effective connectivity refers to either direct or indirect causal influences that activity in one neuronal system exerts on activity of another neuronal system (Friston et al., 1993a). Effective connectivity can be inferred from functional magnetic resonance imaging (fMRI) data by means of dynamic causal modelling (DCM). Although not considered a measure of effective connectivity per se, transcranial magnetic stimulation (TMS) can be employed to probe intra- and intercortical physiology and causal changes in functional circuits of the brain (Reis et al., 2008; Westlake
& Nagarajan, 2011).
1.4 Transcranial magnetic stimulation (TMS)
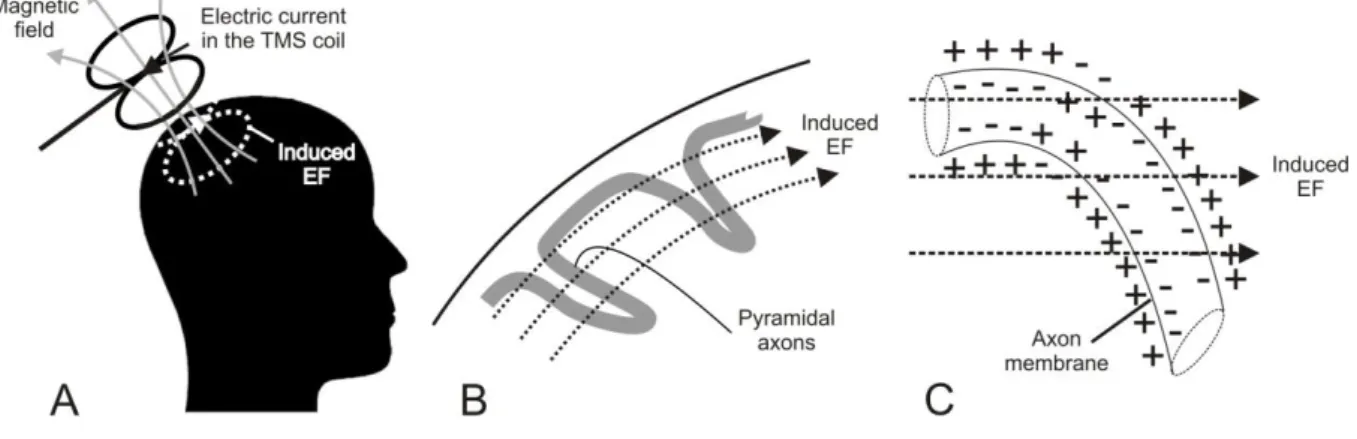
TMS was introduced in 1985 by Barker et al. and has since then gained recognition as safe technique to stimulate the human cerebral cortex non-invasively and pain-free (Barker et al., 1985). TMS makes use of Faraday‟s principle of electromagnetic induction, which states that electrical energy can be converted into magnetic fields and vice versa (Faraday, 1832). During TMS, a copper stimulation coil is held tangentially to the subject‟s scalp. The electric current in the stimulation coil produces a strong magnetic pulse of short duration (~2 Tesla, ~50-100 µs) which passes the skull nearly unhindered and induces an electric field (EF) in the underlying brain tissue (Figure 1.5A). The induced EF causes depolarization of fast conducting large pyramidal cells, which have excitatory monosynaptic connections to spinal cord motoneurons. Hence, TMS pulses may finally result in motor-evoked potentials (MEPs) in contralateral peripheral muscles which can be recorded by means of electromyography (EMG). There is evidence that TMS excites pyramidal cells either directly at the axon membrane or indirectly via transsynaptic input from interneurons (Di Lazzaro et al., 1998a).
General introduction
24 Evidence for this suggestion comes from so-called descending waves or descending volleys recorded from a bipolar electrode inserted into the cervical epidural space of conscious human subjects (Di Lazzaro et al., 1998a). Descending waves are rapidly transmitted (60-70 m/s) synchronized action potentials in fast conducting axons of pyramidal cells, which innervate motoneurons in the spinal cord (Amassian et al., 1987). The first of these descending waves is referred to as direct wave or D-wave, which is thought to reflect direct excitation of axons in white matter due to its short latency (Amassian et al., 1987). The early D-wave is followed by several later indirect waves or I-waves which follow in constant intervals of ~1.5 ms and correlate with excitatory postsynaptic potentials (EPSP) of fast conducting pyramidal cells (Amassian et al., 1987) and hence are thought to reflect indirect excitation of pyramidal cells by transsynaptic input from excitatory interneurons. TMS may induce both, D-waves and I- waves indicating that the induced EF may excite motoneurons either directly at the axon membrane or indirectly via transsynaptic input (Di Lazzaro et al., 1998a). Axons are preferentially excited if the induced EF changes relative to their trajectory (Figure 1.5B).
Since the EF in the brain tissue is horizontal, particularly axons which bend downwards will be locally depolarised at the axon membrane (Basser, 1994; Ilmoniemi et al., 1999; Roth &
Basser, 1990; Figure 1.5C).
Modified from: http://www.biomag.hus.fi/tms/Thesis/Fig1.jpg (19.10.2011)
Figure 1.5: Introduction: Principles of transcranial magnetic stimulation (TMS). A: The electric current in the TMS coil (solid black line; flowing in posterior-anterior direction) generates a transient magnetic field (solid grey line), which induces an electric field (EF) in the brain (dashed white line; in posterior-anterior direction). B: Motor cortex stimulation and trajectory of pyramidal axons. The induced EF runs in posterior-anterior direction and approximately parallel to the gyral surface. C:
Direct axonal excitation at the microscopic level. The induced EF causes local depolarisation of the axon membrane at the position where the pyramidal axon bends downwards.
General introduction
25 Excitation of motoneurons has been demonstrated to be maximal if the induced EF is approximately perpendicular to the central sulcus and in posterior-anterior (PA) direction (Mills et al., 1992). Traditional circular-shaped TMS coils induce strong electric fields whereas figure-of-eight TMS coils offer the advantage of increased focality since maximal current is induced in a relatively small area at the intersection of the two round components (Lontis et al., 2006). A recent study of Thielscher and colleagues suggests that TMS has a spatial resolution of at least 7.7 mm (Thielscher & Wichmann, 2009). Since the EF strength decreases exponentially as a function of distance from the TMS coil (Eaton, 1992), TMS is restricted to stimulation of more superficial cortical areas (1-6 cm distant from the TMS coil;
Weyh & Siebner, 2007).
Two major approaches can be pursued with TMS:
1) Investigation of physiological properties of neuronal tissue by means of several pulses applied at low frequencies (< 1 Hz):
Two different subtypes are:
a) Single-pulse TMS (to assess e.g. corticospinal excitability; cf. 1.4.2)
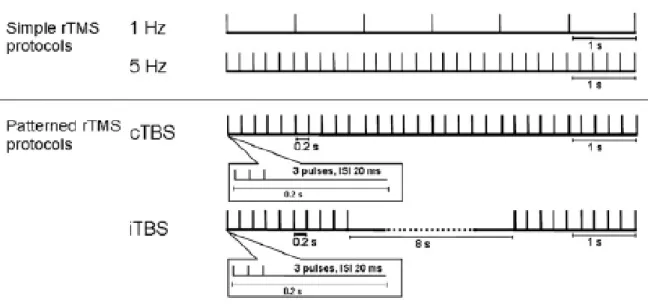
b) Paired-pulse TMS (to assess intra- or intercortical neuronal pathways; cf. 1.4.3) 2) Modulating corticospinal excitability beyond the period of stimulation by means of repetitive transcranial magnetic stimulation (rTMS), i.e. many pulses (usually > 500) applied at higher stimulation frequencies (≥ 1 Hz)
The following paragraph gives an overview of TMS techniques with emphasis on the methods applied in the present thesis.
1.4.1 Stereotaxic frameless neuronavigation
Although exact coil positioning is crucial for correct interpretation of TMS effects, accurate positioning of the TMS coil over the cortical target area represents one of the most challenging aspects of the experimental procedure (Sparing et al., 2010). Two conventional strategies have been used before the introduction of stereotaxic frameless neuronavigation for TMS: (i) the international 10-20 electroencephalography (EEG) electrode system and (ii) standardized function guided procedures (Sparing et al., 2008). The former strategy assumes consistent correlation between scalp positions and underlying brain structures and may lead to spatial variations of up to 20 mm with some electrode positions showing larger variability
General introduction
26 than others (Herwig et al., 2003). The latter strategy assumes that brain areas are subsequently located in a certain spatial relation to a reference point (e.g. M1 leading to MEPs when stimulated). Accuracy of this procedure falls off with increasing distance from the reference point (Herwig et al., 2001). Since the early 1990s, image-guided frameless stereotaxic neuronavigation systems (SNS) have been used for presurgery evaluation as well as online navigation during neurosurgery (Herwig & Schonfeldt-Lecuona, 2007). Since 1997, SNS is also available for coil guidance during TMS and three different strategies have been suggested, which make use of: (i) the subject‟s individual structural (anatomical) magnetic resonance imaging (MRI) scan allowing navigation after subject-image coregistration based on facial and/or cranial landmarks, (ii) individual fMRI data, and (iii) probabilistic (group) fMRI data. Highest precision can be achieved with the latter two strategies in which task- related fMRI signal is used as functional landmark for coil positioning (Sparing et al., 2008;
Figure 1.6). The probabilistic approach might be particularly useful if reliable fMRI activations cannot be obtained on the single-subject level. Nonetheless, a spatial mismatch of up to 14 mm between the individual position yielding highest MEPs when stimulated with TMS and the position with highest individual fMRI signal has consistently been reported for the human motor cortex (Bastings et al., 1998; Boroojerdi et al., 1999; Herwig et al., 2002;
Krings et al., 1997; Lotze et al., 2003; Sparing et al., 2008; Terao et al., 1998). The underlying cause of this spatial mismatch between fMRI and TMS is unknown and will be matter of investigation in the present thesis (Study I & II).
Figure 1.6: Introduction: Stereotaxic frameless neuronavigation for transcranial magnetic stimulation (TMS). The screenshot of the eXimia software (Nexstim, Helsinki) shows a 3D head reconstruction model based on a volunteer‟s individual high-resolution anatomical magnetic resonance imaging (MRI) scan. The position of the TMS coil and the position of the subject‟s head are tracked via an infrared camera which allows online navigation. The anatomical MRI scan is overlaid with the subject‟s individual functional magnetic resonance imaging (fMRI) data during index finger tapping (red/yellow activation cluster in the motor hand area). The electric field (EF) is colour coded (highest EF strength depicted in red).
General introduction
27
1.4.2 Single-pulse TMS
1.4.2.1 Motor-evoked potentials (MEPs) and motor thresholds (MTs)
When investigating the human motor system, TMS effects are usually probed by inducing MEPs measured at contralateral peripheral target muscles by means of EMG recordings. Two small hand muscles served as target muscles in the present thesis: (i) the first dorsal interosseous (FDI) muscle involved in index finger abduction, and (ii) the abductor pollicis brevis (APB) muscle involved in thumb abduction. Both muscles, particularly the FDI muscle, have the advantage of relatively large representation areas in M1 and are well suitable for EMG recordings due to their superficial anatomical position. Motor thresholds (MTs) and peak-to-peak amplitudes of MEPs are measures of corticospinal excitability involving both, excitation of cortical neurons (either directly or transsynaptically) and synaptic mechanisms at the level of the spinal cord (Hallett, 2007). The MT is defined as the minimum TMS stimulator output intensity needed to generate MEPs in the target muscle and can be obtained either at rest (resting motor threshold = RMT) or during permanent low-level contraction of the target muscle (active motor threshold = AMT). The RMT depends on at least three different independent factors: (i) excitability of corticospinal axons, (ii) excitability of intracortical synapses, and (iii) excitability of synapses in the spinal cord. The AMT is usually lower than the RMT of the same subject since tonic muscle contraction pre-activates synapses in the spinal cord which lowers their threshold to generate an MEP if a TMS pulse is simultaneously applied (Hess et al., 1987; Rosler et al., 2008). Since synapses in the spinal cord are pre-activated, AMT is assumed to depend mostly on the excitability of cortical axons and intracortical synapses. Hence, AMT is thought to be a measure of cortical rather than corticospinal excitability (Talelli et al., 2006).
1.4.2.1.1 MEPs and MTs early after stroke
In some stroke patients, single-pulse TMS applied to the ipsilesional hemisphere fails to elicit any MEPs in the acute phase (Foltys et al., 2003; Manganotti et al., 2002; Trompetto et al., 2000). According to a systematic review, absence of MEPs in the affected limb in the acute phase is a strong predictor for poor motor recovery (Hendricks et al., 1997). In patients in whom MEPs can be elicited, the RMT of the ipsilesional hemisphere is usually increased (i.e.
corticospinal excitability is decreased) compared to healthy subjects and compared to the contralesional hemisphere both in the acute (Manganotti et al., 2002) and sub-acute phase
General introduction
28 (Cicinelli et al., 1997). Likewise, AMT which has been suggested to be less sensitive to changes in spinal cord excitability was found to be increased in the sub-acute phase (Cicinelli et al., 2003) indicating reduced cortical excitability. Excitability increases (i.e. MEPs increase and MTs decrease) gradually over time concomitant to motor recovery (Manganotti et al., 2002; Thickbroom et al., 2002; Traversa et al., 2000). MTs of the contralesional hemisphere are usually within normal limits even in the acute phase (Foltys et al., 2003; Manganotti et al., 2002; Shimizu et al., 2002).
1.4.2.2 TMS motor mapping
TMS motor mappings are used to define the position and extend of the cortical representation of a particular peripheral muscle. During this procedure, a focal figure-of-eight TMS coil is systematically moved (usually in 5-10 mm increments) to scalp positions. As a result, a cortical excitability map is generated based on muscle responses (i.e. MEPs) recorded from the target muscle (Figure 1.7). The most important parameters which can be obtained by TMS motor mappings are: (i) the geometric centre-of-gravity (CoG; i.e. the MEP amplitude weighted centre of the map) and (ii) the size of the cortical representation (i.e. the number of excitable scalp positions). The area of tissue which can be excited by means of TMS is considerably larger than the actual representation in M1. This might be due to several reasons including geometry of the EF causing excitation of neurons not only exclusively directly underneath the TMS coil and excitation of axons running horizontally and terminating onto distant neurons. The size of the map area is highly dependent on the stimulation intensity used. By contrast, the CoG is relatively insensitive to stimulation intensity and coil shape (Brasil-Neto et al., 1992; Wassermann et al., 1992).
General introduction
29 Figure 1.7: Introduction: Example TMS motor map of a healthy volunteer generated with transcranial magnetic stimulation (TMS). Single-pulse suprathreshold TMS (120% resting motor threshold) pulses were applied at different scalp positions spaced at intervals of 5 mm (7 pulses per position).
Resulting motor-evoked potentials (MEPs) of the abductor pollicis brevis (APB) muscle were used to generate a colour coded excitability map (purple:
lowest MEP; red: highest MEP) and calculate the MEP amplitude weighted centre of the map (i.e. the centre-of-gravity; CoG) which is marked with a white cross.
1.4.2.2.1 TMS motor maps early after stroke
In the acute phase, cortical representations of paretic hand muscles in the ipsilesional hemisphere are significantly smaller than cortical representations of homologue muscles in the contralesional hemisphere (Foltys et al., 2003). The map area increases concomitant with motor recovery (Cicinelli et al., 1997; Traversa et al., 1997). However, stimulation intensities were not adjusted in these studies, and therefore, the results might be confounded by decreases in MT while patients recovered. Analyses on map area would anyway only allow conclusions on a general increase of corticospinal excitability whereas a spatial shift of the CoG suggests changes in somatotopy of motor cortical projections. In the acute phase, the CoG is within the normal range but spatial shifts may occur later during recovery either in the anterior-posterior or medial-lateral direction (Bastings et al., 2002; Thickbroom et al., 2002).
Such spatial shifts may range from several millimetres (Byrnes et al., 2001; Thickbroom et al., 2002) up to few centimetres (Bastings et al., 2002; Delvaux et al., 2003), which is well beyond the normal variation range of 2-3 mm in healthy subjects (Wassermann et al., 1996).
Motor maps of the contralesional hemisphere usually remain unchanged (Bastings et al., 2002; Liepert et al., 1998).
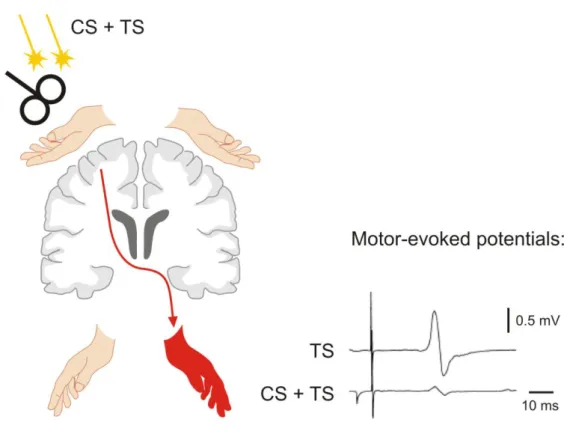
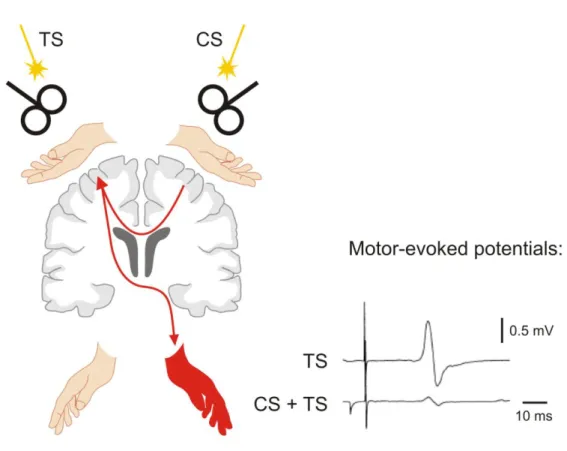
1.4.3 Paired-pulse TMS
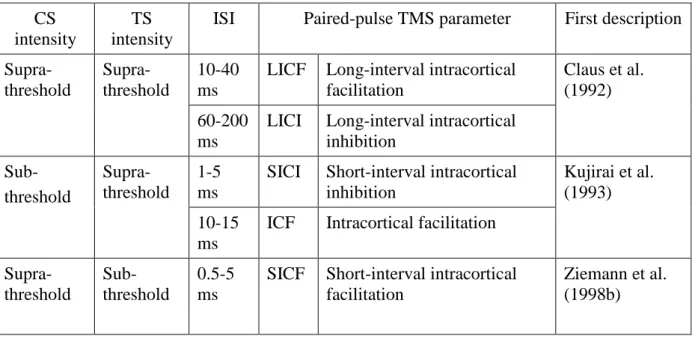
Paired-pulse TMS paradigms can be used to investigate inhibitory and excitatory neuronal circuits either within or between hemispheres with high temporal resolution. What all paired-